TIMESCALES OF SOFT X-RAY VARIABILITY AND PHYSICAL CONSTRAINTS IN AGNs
Abstract
We present soft X-ray variability time-scales for 65 active galactic nuclei (AGNs) derived from ROSAT/PSPC pointing data. For these 65 objects with obvious exponential increasing or decreasing patterns in their light curves, we use the exponential time-scales and find they are more suitable for analyzing ROSAT light curve data. We also discuss some physical constraints on the central engine implied by our results. Assuming that this soft X-ray variability exponential time-scale is approximately equal to the thermal timescale of the standard accretion disk, we obtain the accretion rate, the size of soft x-ray radiation region and the compactness parameter for 37 AGNs, using their recently estimated central black hole masses. For 12 of these 37 AGNs, the radii of the gravitational instability in the standard thin accretion disks are obtained using central black hole masses and the calculated accretion rates. These are consistent with the results from the reverberation mapping method. These results provide supporting evidence that such gravitational instabilities contribute to the formation of the Broad Line Regions (BLRs) in AGNs.
1 INTRODUCTION
X-ray variability has long been known to be a common property of active galactic nuclei (AGNs). The X-ray variability in the continuum and in the emission lines can give a clue to the central engine in AGNs (Mushotzky et al. 1993). The variance amplitude and the time-scale are two main parameters which characterize the variance. There are many quantities can be used to describe the variability amplitude or the timescale in X-ray variability, such as the flux-doubling time-scale (Barr & Mushotzky 1986), normalized variability amplitude (Green et al. 1993), and the excess variance (Nandra et al. 1997). Some powerful methods are also introduced in the analysis of the X-ray light curves. These include the power density spectrum (PDS), the wavelet method (Otazu et al. 2002 ), and the power density in the time domain (Li 2001).
There has been steady progress on the analysis of X-ray variability since the launch of EXOSAT, RXTE, ROSAT, ASCA, XMM-Newton. For an individual X-ray light curve, PDS analysis is now popular and can offer more information about the X-ray variability. Early attempts to constrain a PDS flattening or “cut off”, which relates to a characteristic time-scale, were made with the EXOSAT data of NGC 5506 (McHardy 1988) and NGC 4151 (Papadakis 1995). These analyses yield evidence for a cutoff time-scale of several weeks. However, the uneven sampling of these data made their reliability uncertain. The situation was significantly improved with the launch of RXTE. Using RXTE data, Edelson & Nandra (1999) obtained an evenly sampled X-ray light curve of NGC 3516 and produced a PDS covering four decades in temporal frequency, finding a cutoff time-scale of about one month. Pounds et al. (2001) also found a cutoff time-scale of about 13 days for a narrow line Seyfert 1 galaxy (Akn 564). Uttley et al. (2002) recently developed a Monte Carlo method to test models for the true power spectrum of intermittently sampled light curves against the observed noisy power spectra of four Seyfert galaxies, which are flat towards lower frequencies. They fit two models for the flattening: a “knee” model and a “high-frequency break” model. They reduced the characteristic frequency for these four AGNs.
The X-ray characteristic time-scale or frequency usually relates to the size of the X-ray emission region, which then can be used to constrain the central engine, e.g. the central black hole masses, accretion rates, and the radiation mechanism.
ROSAT observations of AGNs offer plenty of information about the soft X-ray variability, which is thought to come from the accretion disk around the central black hole in these AGNs. However, PDS analysis is not suitable for analyzing ROSAT pointed data, since there are usually large time gaps between adjacent exposures in ROSAT pointing observations. Thus, time-scale analysis remains necessary in AGN samples. There are obvious exponentially increasing or decreasing patterns in the soft X-ray light curves in some AGNs observed with ROSAT/PSPC in pointing mode. In this paper we use the exponential time-scale (Zhao & Fink 1996) to investigate the soft X-ray variability in AGNs with this kind of pattern. This paper is a continuation of the previous work of Zhao & Fink (1996) .
The standard model of AGNs is an accretion disk with a jet around a central massive black hole. Progress on a reliable estimate about black hole masses can effectively constrain the central engine when combined with the research on the X-ray variability. Several methods have been used to estimate the mass of a black hole in the center of a galaxy. These include stellar dynamical studies (reviewed by Kormendy & Gebhardt 2001) , reverberation mapping methods (Kaspi et al. 2000), analyses of the high frequency tail of the power density spectrum (Czerny et al. 2001), the relation between central black hole masses and the bulge velocity dispersion (Merritt & Ferrarese 2001), and the use of single-epoch rest-frame optical spectrophotometric measurements (Vestergaard 2002).
In next section time-scales and central black hole masses of our sample are presented. We then give the physical constraints on the central engine of 38 AGNs in Section 3. In Section 4 we derive the radii of the gravitational instability in the standard accretion disks of 12 AGNs and compare them with BLRs sizes from the reverberation mapping method. Our results are summarized in Section 5. The cosmological parameters and have been adopted in this work.
2 SAMPLE AND TIMESCALES OF VARIABILITY
All sources were observed in ROSAT/PSPC mode over periods varying from days to years. We picked out the AGNs from cross identification of the Veron-Cetty (2001) AGN catalogue with the ROSAT point source catalog. From the ROSAT public archive of PSPC observations, only sources with total X-ray photon counts greater than 1000 were selected to ensure the quality of the X-ray spectra. This yielded more than 200 AGNs. The data were processed for instrument corrections (such as vignetting and dead time effects) and background subtraction using the EXSAS/MIDAS software.
The light curve for each AGN was obtained from original ROSAT observations with a 400 seconds time bin in three energy bands; 0.1-2.4 (total band), 0.1-0.4 (A band), 0.5-2.0 (B band) keV. The estimates of time-scales for all AGNs described below are based on those light curves. From these light curves we can find that there exist obvious exponentially increasing or decreasing patterns. Since X-ray emission is believed to come from the accretion disk around the central black hole in AGNs, these exponential patterns may provide physical insight. We select the AGN light curves with exponential patterns by the following criteria: (1)The count rate increased or decayed continually in the light curves, considering count rate uncertainties of 3 , (2)the number of the contiguous data points fitted by the exponential function (Eq. 1) are greater than 4, (3)the magnitude of the count rate variance is greater than , where and are the count rate errors of the jumping-off point and end-point, respectively. The soft X-ray luminosity in the 0.1-2.4 keV of each AGN is obtained by averaging the power-law fitting spectra of all the observations.
2.1 Exponential Time-scales
We use the exponential time-scale (Zhao & Fink 1996) to characterize the exponential pattern in the light curves in AGNs. The exponential time-scale, , is defined as
| (1) |
where is the count rate at t, and are constants.
The definition of exponential time-scale is based on instabilities which increase or decrease exponentially. Thus the exponential time-scale is equivalent to a rising or a descending time-scale and is the amplitude of variability. is an additional constant component, which is equal to the intensity before or after the instability. It is exponentially increasing if the sign of is positive while it is exponentially decaying if the sign is negative. For AGNs with some values of , we select with the smallest error as the time-scale. Taking the Seyfert 1 galaxy NGC 5548 as an example (Fig. 1), there are three obvious exponentially increasing or decreasing patterns in the light curve. Three patterns fitting by Eq. 1 showed similar exponential time-scales. The exponential time-scales are , , seconds, respectively, which are consistent if taking the errors into account. And are , , photons , respectively.
We think there is more physical information in the exponential time-scale than in the two-folding time-scale, which only considers the amplitude increased by a factor of two. There are usually large time gaps between adjacent exposures in ROSAT pointed observations. The two-folding time-scale will overestimate the time-scale of ROSAT sources. Using our selection criteria as defined above, we searched for any obvious continually exponentially increasing or decreasing pattern in the light curve of each AGN and then fitted the pattern with the form of Eq. 1, considering the errors of the count rates (Press et al. 1992). The exponential time-scales fir 65 AGNs are listed in column 3 of Table 1, in which there are nine QSOs, 37 Seyfert 1 galaxies, nine NLS1s, one Seyfert 2 galaxies, four BL Lacs and five high optical polarization (HP) objects. The time-scales calculated as rising exponentials are marked with a star. The rest are derived from decaying exponentials.
2.2 Estimations of Central Black Hole Masses
The masses of 13 AGNs labelled with “a” in Table 1 are adopted from Nelson (2000). They were estimated from the reverberation mapping methods with a high level of reliability. There is strong correlation between the black hole mass and the host velocity dispersion, namely the relation (Ferrarese et al. 2001). We adopt the relation found by Merritt & Ferrarese (2001), namely,
| (2) |
We derive masses for seven AGNs with measured host velocity dispersions, which are labelled with “b” in Table 1 (Nelson & Whittle 1995; Falomo et al. 2002). The errors for black hole masses in these seven AGNs are estimated from the error of the bulge velocity dispersion. An empirical relationship between single-epoch rest-frame optical spectrophotometric measurements and the central masses was recently presented (Vestergaard 2002). These methods for estimating AGN masses are all calibrated using masses from the reverberation mapping method. The total number of AGNs with available black hole masses is 37, of which there are 22 Seyfert 1 galaxies, five NLS1s, one Seyfert 2 galaxies, eight Quasars and one BL Lac objects. The central black hole masses of these 37 AGNs are listed in column 5 in Table 1.
3 ANALYSIS AND PHYSICAL CONSTRAINTS
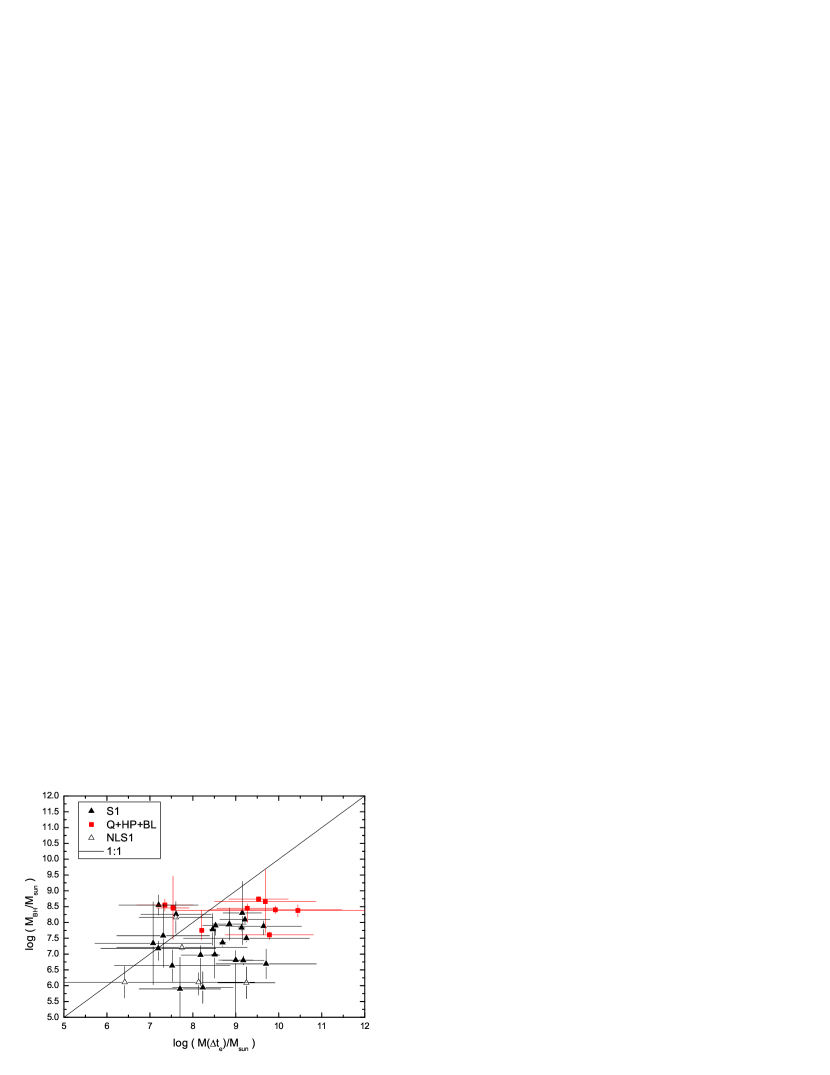
3.1 Central Black Hole Mass and Mass Limits from the exponential Time-scale
The upper limit on the mass of the central black hole in AGNs derived from the time-scale is defined as (Mushotzky et al. 1993):
| (3) |
assuming that the size of the X-ray radiation region is 5 Schwarzschild radii.
3.2 Constrains on the Radiation Mechanism in AGNs
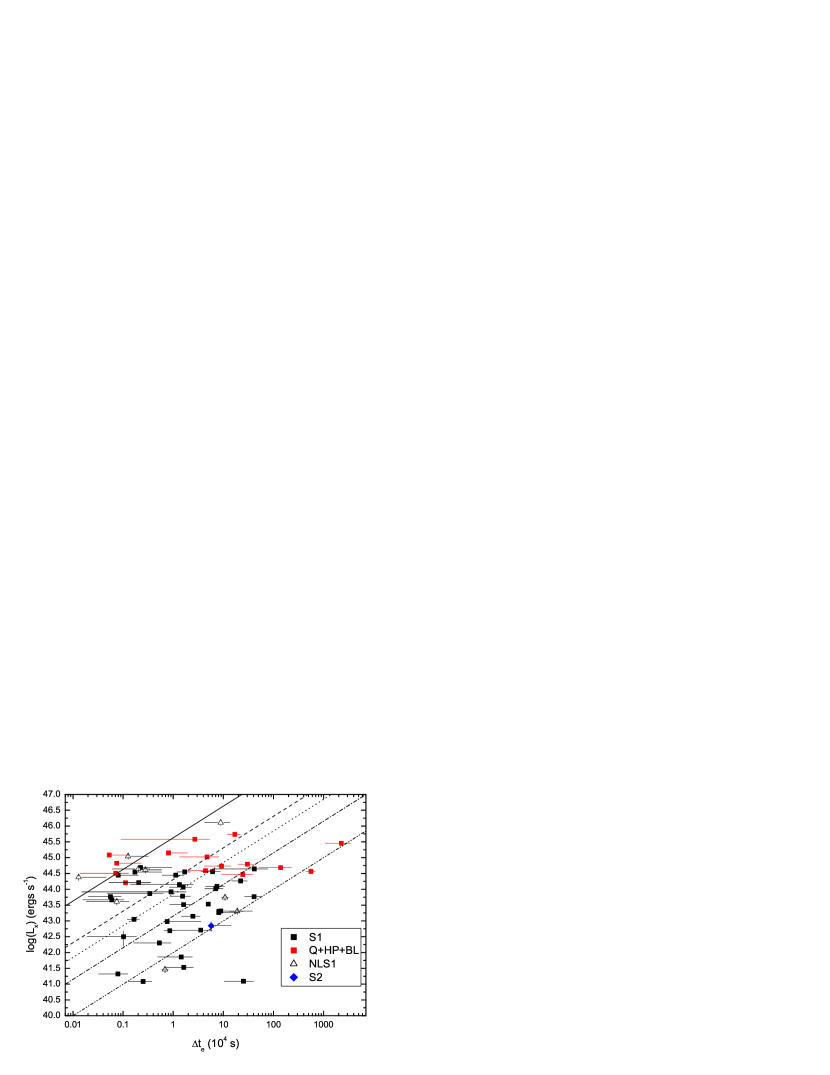
Some physical constraints on the relationship of bolometric luminosity and the time-scale were proposed by Fabian (1979; 1992). If the source luminosity is below the Eddington limit, we obtained a limit:
| (4) |
When the luminosity is produced by matter being transferred into radiation with some efficiency , there is a second limit:
| (5) |
If the primary spectrum of the source extends to -ray energies, electron-positron pair production gives a third limit:
| (6) |
Thermal bremsstrahlung radiation supplies more power than Compton process only if:
| (7) |
where the temperature of the electrons is K.
The bolometric luminosity is larger than the X-ray luminosity in ROSAT’s energy band. For example, the ratio of the bolometric luminosity of 3C 273 (Padovani & Rafanelli 1988), , and the X-ray luminosity in ROSAT’s energy band, , is 14. In Figure 3 we show the soft X-ray luminosity in 0.1-2.4 keV versus the exponential time-scale. The lines in Figure 3 are from Eq. 4-7 assuming .
From Figure 3 bremsstrahlung is ruled out as the primary radiation source except in several low luminosity sources because of the observed rapid variability.
The objects whose bolometric luminosity are larger than the Eddington limit are MS 01585+0019 (BL) ,PKS 0548-322 (HP) ,MS 23409-1511 (NLS1), PG 1244+026 (NLS1) . These objects may display relativistic effects.
The efficiency factors, , of most objects are larger than 0.007, which would not be associated with stellar process (see Fig. 3) . It suggests strongly that most AGNs, at least, have non-thermal and non-stellar processes which are produced by a very efficient central engine.
3.3 Sizes of the X-ray Radiation Regions
Under unified model schemes, an accretion disk surrounds the central massive black hole in an AGN. There are two instabilities, thermal and viscous, usually occurring in accretion disks. However, the rapid variability in X-rays cannot arise from viscous instability because the viscous time-scale is too long (Mushotzky et al. 1993). The time-scale of thermal instability in accretion disks (Frank et al. 1992) is
| (8) |
where is a parameter in the standard thin accretion disk, is the Keplerian angular velocity in the orbit of radius R surrounding a central black hole with the mass of M.
Assuming the exponential time-scale is approximately equal to the thermal time-scale, we can obtained the size of radiation region, , as
| (9) |
where is the Schwarzschild radius. is adopted.
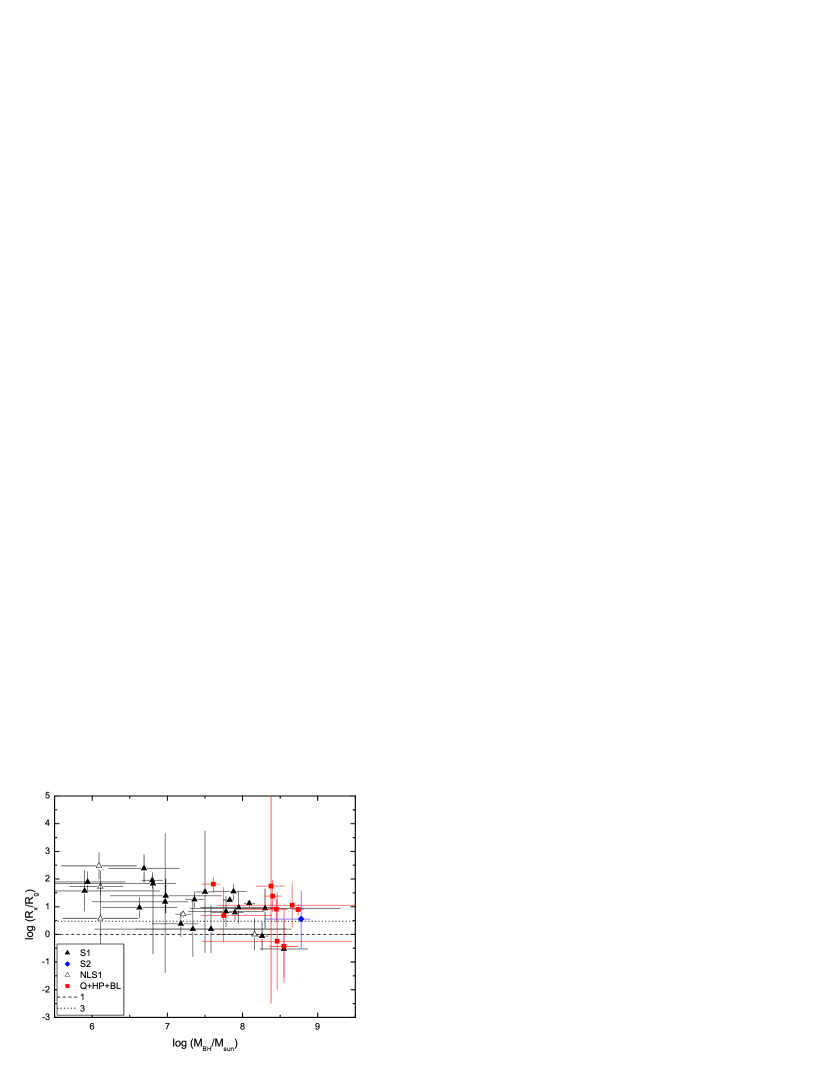
Taking the above estimated black hole masses and exponential time-scales, we can obtained the ratios of the size of X-ray radiation region to the Schwarzschild radius, which are listed in column 7 of Table 1. distribution is with a standard deviation of 0.75. We plot versus in Figure 5. A simple least square linear regression (Press et al. 1992) gives , with a Pearson correlation coefficient of R=0.54 corresponding to a probability of P0.000431 that the correlation is caused by a random factor. The error of is estimated from the errors of the exponential time-scale and the black hole mass. The sizes of radiation regions of all AGNs are larger than the so-called last stable radius , if we consider errors of calculated sizes.
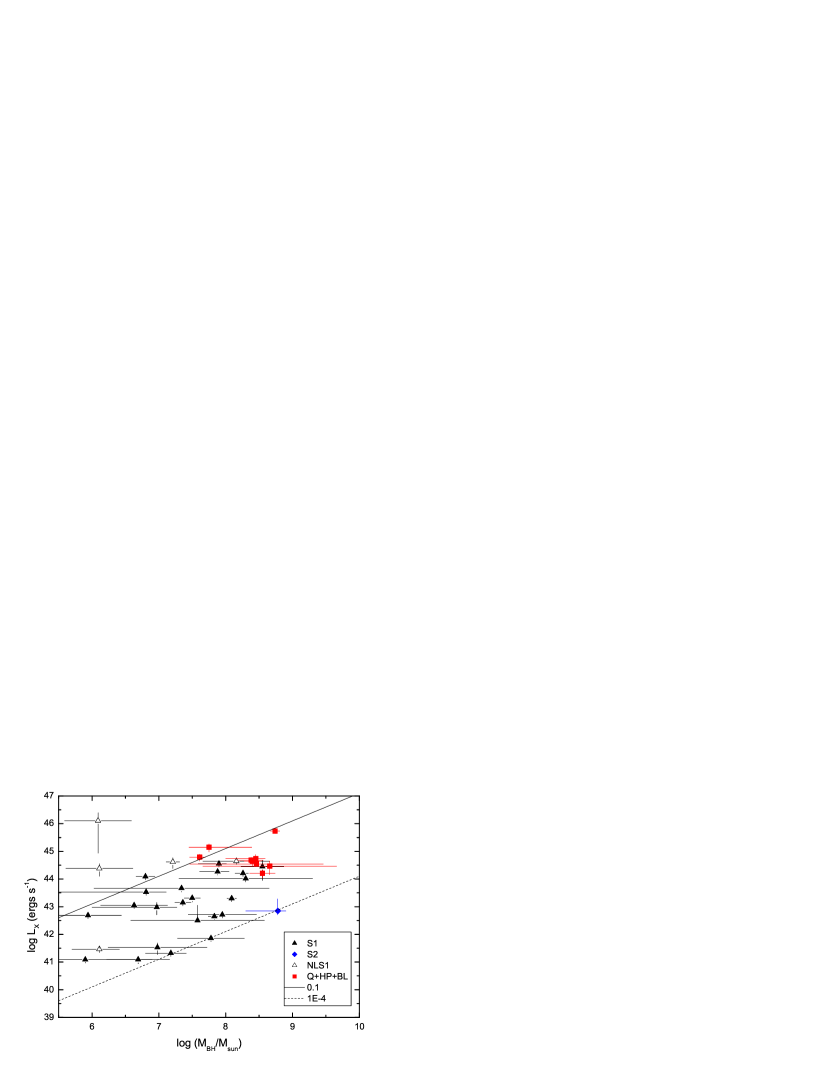
3.4 Accretion Rates
The accretion rate can be derived from the relation,
| (10) |
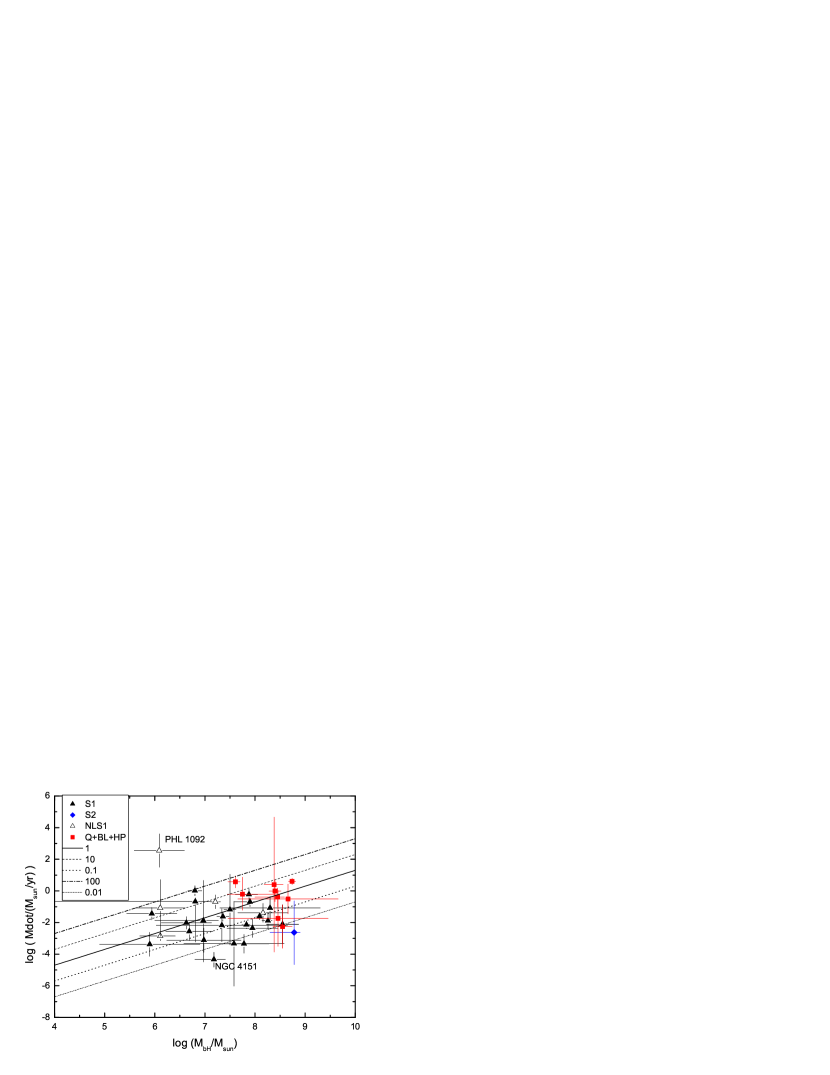
where is the soft X-ray luminosity in 0.1-2.4 keV band, G is gravitational constant, and is the size of the X-ray radiation region. Using and , accretion rates for 37 AGNs are obtained from Eq. 10, which are listed in column 6 of Table 1. The distribution is with a standard deviation of 1.42. In Figure 6 we show the accretion rates () versus black hole masses (). The accretion rates of most of AGNs are 1000.01 , taking .
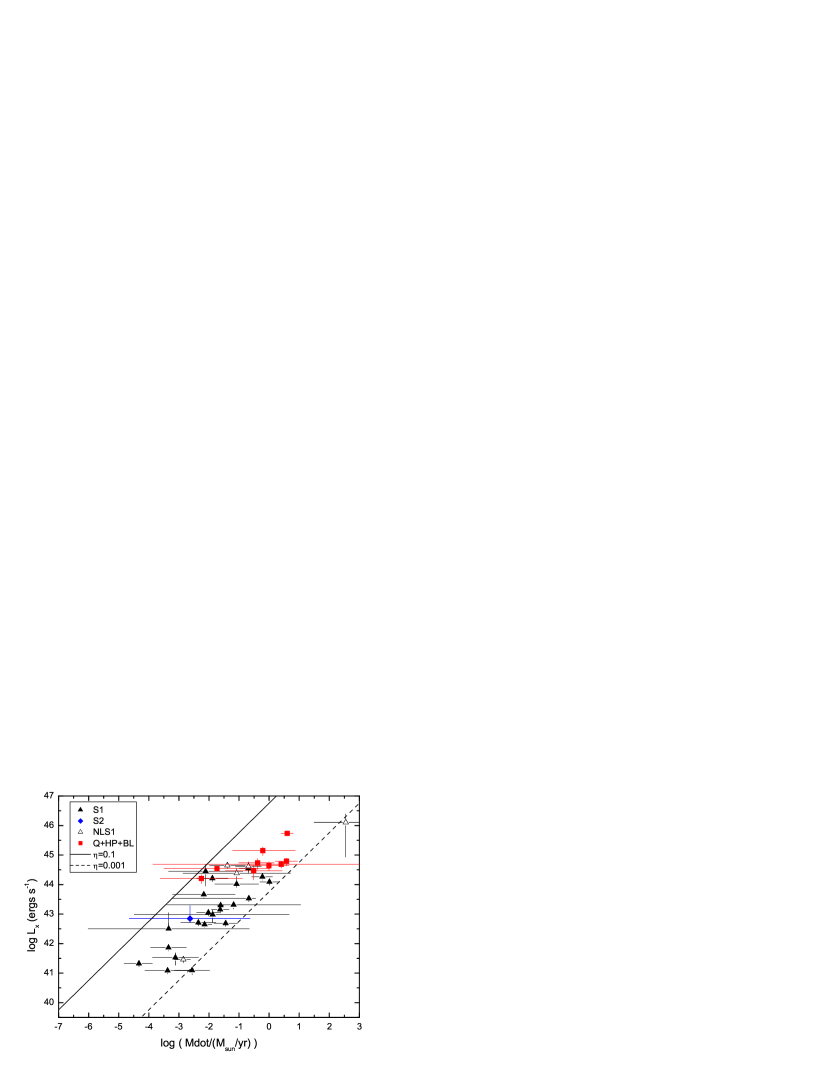
We plot versus in Figure 7. , where is the accretion efficiency. The solid line in Figure 7 is and the dash line is . Most AGNs are in the range of 0.10.001 of . Combining Eq. 10, we can drive the accretion efficiency . From Figure 5 we find the values of in most AGNs are in the range of 5500, which is consistent with the value of (0.10.001).
3.5 The Compactness Parameter
If the power law spectra observed in AGNs in the X-ray extend to much higher energies, then pairs may be expected to be produced if the optical depth of the -ray photons for pair production exceeds unity. The condition is usually stated in terms of the compactness parameter (Done & Fabian 1989),
| (11) |
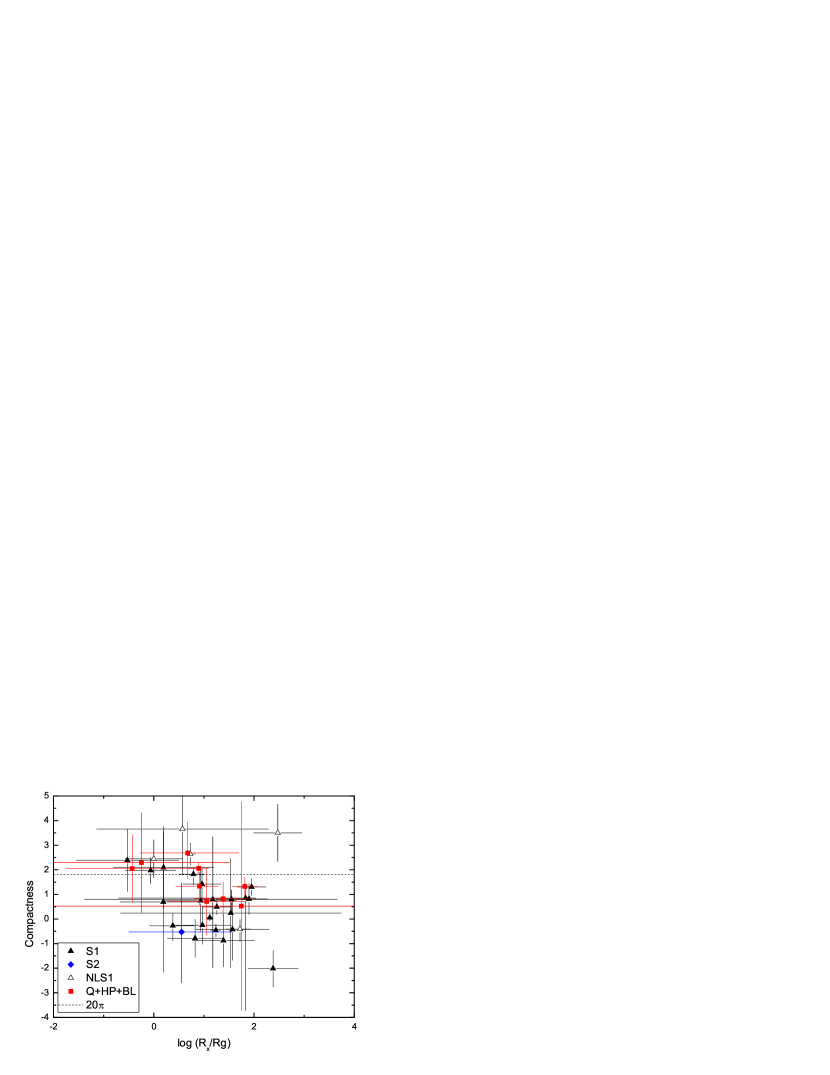
Where is the luminosity produced in the region of , is the mass of electron and is Thomson cross section. The values of the compactness parameters are listed in column 9 of Table 1. If , the source has unity optical depth in X-ray for -ray absorption at about one Mev and a significant fraction of the source luminosity can then pass through electron-positron pairs. The distribution of the compactness parameter is with a standard deviation of 1.23. We plot the compactness parameter versus in Figure 8. A simple least square linear regression (Press et al. 1992) gives (excluding PHL 1092) (R=-0.50, P=0.00168 ). Those AGNs with smaller appear to have larger compactness parameter. From Figure 8 we can find that several AGNs have , while several AGNs have , which is consistent with the results of Done & Fabian (1989).
4 THE SIZES OF THE BLR
Broad emission lines are one of the dominant features of spectra of AGNs. Broad Line Regions (BLRs) play a particularly important role in our understanding of AGNs by virtue of their proximity to the central source. With reverberation mapping techniques, the sizes of the BLRs can be obtained through the study of correlated variations of the lines and continuum fluxes (Peterson 1993). The BLR sizes for 17 Seyfert 1 galaxies (Wandel et al. 1999) and for 17 PG quasars (Kaspi et al. 2000) have been recently obtained. In Table 2, we list 12 AGNs with available BLRs sizes and the calculated accretion rates. Here we adopted 3 light days as the error of the BLRs size of NGC3516, which is not given in Ho (1998). Errors of BLRs sizes of other 11 AGNs are from Kaspi et al. (2000).
We assume that the gravitational instability of the standard thin disk at large radius leads to the formation of BLRs (Bian & Zhao 2002). The criterion is (Golreich & Lynden-Bell 1965), where is the Keplerian angular velocity at R away from the central black hole , is the black hole mass, and is the local mass density. We adopted the solutions of for the standard thin disk from Shakura & Sunyaev (1973) , , where is the parameter of the standard disk, , , , and . and are adopted in AGNs. We can obtain the sizes of the BLRs if we know the central black hole masses and accretion rates,
| (12) |
The BLRs sizes of 12 AGNs are obtained from Eq. (12), which are listed in Table 2. The uncertainties of our calculated BLRs sizes are estimated by considering ( Golreich & Lynden-Bell 1965 ), errors of the black hole masses and the accretion rates.
Figure 9 shows that the calculated BLRs sizes derived from Eq. 12 are consistent with the sizes from the reverberation mapping method. We have a (Press et al. 1992) test of to show whether our calculated BLRs sizes are consistent with that from reverberation mapping method . and probability are 0.933 and 99.996% for 12 AGNs.
5 SUMMARY
We use the exponential time-scale to characterize the soft X-ray variabilities of AGNs with obvious exponentially increasing or decreasing patterns in the light curves and obtain time-scales for 65 AGNs. The exponential time-scale is suitable for analyzing X-ray variability, especially for the data with larger time gaps such as ROSAT data. The exponential time-scales can provide good upper limits for the central black hole masses and the sizes of the X-ray radiation region. From the relationship of and we can reject bremsstrahlung as the primary radiation source for most AGNs here. Many AGNs have very efficient engines. There is no explicitly grouped distribution in diagram for different kinds of AGNs. This means that, under the same soft X-ray luminosity, the central mass or radiation region, compared with Schwarzschild radius, varies from one AGN to another.
Using the recent mass estimates of central black holes and the exponential time-scales of AGNs from ROSAT/PSPC pointing data, the sizes of X-ray radiation region, the accretion rate and the compactness parameter of 37 AGNs are obtained. We use the calculated accretion rates to calculate the radius of gravitational instability for 12 AGNs among 37 AGNs, which is consistent with the BLRs sizes from the reverberation mapping method. This provides further evidence for the gravitational instability leading to the formation of BLRs.


References
- (1) Barr, P. & Mushotzky, R. F. 1986, Nature, 320, 421
- (2) Bian, W. & Zhao, Y. 2002, A&A, 395, 465
- (3) Czerny, et al. 2001, MNRAS, 325, 865
- (4) Done, C. & Fabian, A. C. 1989, MNRAS, 240, 81
- (5) Edelson, R. & Nandra, K. 1999, ApJ, 514, 682
- (6) Fabian, A. C. 1979, Proc. R. Soc. Lond. A. 266, 449
- (7) Fabian, A. C. 1992, In: Tananka Y. & Koyama K. (eds.) Frontiers of X-ray Astronomy, Universal Academy Press, Tokyo, p. 603
- (8) Falomo, R. , et al. 2002, ApJ, 569, L35
- (9) Ferrarese, L. , et al. 2001, ApJ, 555, L79
- (10) Frank, J. , et al. 1992, In: Accretion Power in Astrophysics, Cambridge Univ. Press, p.98
- (11) Green, A. R., McHardy, I. M., & Lehto, H. J. 1993, MNRAS, 265, 664
- (12) Ho, L.C. 1998, In “Observational Evidence for Black Holes in the Universe”, ed. S.K. Chakrabarti (Dordrecht: Kluwer) P157, astr-ph/9803307
- (13) Goldreich, P. , & Lynden-Bell, D. 1965, MNRAS, 130, 97
- (14) Kaspi, S., Smith, P.S., Netzer, H., Maoz, D., Jannuzi, B.T., Giveon, U. 2000, ApJ, 533, 631
- (15) Kormendy, J. & Gebhardt, K. 2001, the 20th Texas Symposium on Relativistic Astrophysics, ed. H. Martel & J.C. Wheeler, AIP, 586, p.363
- (16) Li, T.P., 2001, ChJA&A, 1, 313
- (17) Mathur, S., Kuraszkiewicz, J., & Czerny B. 2001, New Astronomy, 6, 321
- (18) McHardy, I. M. 1988, Mem. Soc. Astron. Italiana, 59, 239
- (19) Merrit, D. , & Ferrarese, L. 2001, ApJ, 547, 140
- (20) Mushotzky, R. F. , et al. 1993, ARA&A, 31, 717
- (21) Nandra, K., George, I.M., Mushotzky, R.F., Turner, T.J., Yaqoob, T. 1997, ApJ, 476, 70
- (22) Nelson, C.H., Whittle M. 1995, ApJS, 99, 67
- (23) Nelson, C. H. 2000, ApJ, 544, L91
- (24) Otazu, X. , et al. 2002, MNRAS, 333, 365
- (25) Padovani, P. & Rafanelli P. 1988, A&A, 205, 53
- (26) Padovani, P. , et al. 1990, ApJ, 353, 438
- (27) Papadakis, I. & McHardy, I. 1995, MNRAS, 273, 923
- (28) Peterson, B. M. 1993, PASP, 105, 247
- (29) Pounds, K. et al. 2001, ApJ, 550, L15
- (30) Press, W. H. , et al. 1992, In: Numerical Recipes, Cambridge Univ. Press
- (31) Shakura, N. I. & Sunyaev R. A. 1973, A&A, 24, 337
- (32) Tremaine, S., et al. 2002, ApJ, 574, 740
- (33) Uttley, P., et al. 2002, MNRAS, 332, 231
- (34) Veron-Cetty, M. P. , Veron P. 2001, A&A, 374, 92
- (35) Vestergaard, M. 2002, ApJ, 571, 733
- (36) Wandel, A. , Peterson, B. M. , Malkan, M.A. 1999, ApJ, 526,579
- (37) Wang, T.G. & Lu, Y.J. 2001, A&A, 377,52
- (38) Zhao, Y. & Fink, H. 1996, Proc. ’Rontgenstrahlung from the Universe’, eds. Zimmermann, H. U. ; Trümper, J. ; and Yorke, H. ; MPE Report 263, 535
| Name | Type | log(l) | |||||
|---|---|---|---|---|---|---|---|
| () | () | () | |||||
| (1) | (2) | (3) | (4) | (5) | (6) | (7) | (8) |
| MARK 335a | S1 | ||||||
| I Zw 1d | NLS1 | ||||||
| TON S180c | NLS1 | ||||||
| F 9a | S1 | ||||||
| PHL 1092f | NLS1 | ||||||
| MS 01585+0019 | BL | ||||||
| MARK 586g | Q | ||||||
| ESO 198-G24 | S1 | ||||||
| MARK 372 | S1 | ||||||
| NGC 1275b | S1.5 | ||||||
| NGC 1566b | S1 | ||||||
| AKN 120a | S1 | ||||||
| PKS 0548-322 | HP | ||||||
| S5 0716+71 | HP | ||||||
| MS 07379+7441 | BL | ||||||
| MARK 10b | S1 | ||||||
| VII Zw 244 | S1 | ||||||
| ESO 434-G40h | S1 | ||||||
| NGC 3031(M81)e | S1 | ||||||
| IRAS 09595-075 | S1 | ||||||
| HE 1029-1401 | Q | ||||||
| MS 10590+7302 | S1 | ||||||
| NGC 3516a | S1 | ||||||
| MARK 180b | BL | ||||||
| NGC 3783a | S1 | ||||||
| MARK 1310 | S1 | ||||||
| NGC 4051a | NLS1 | ||||||
| GQ COM | Q | ||||||
| NGC 4151a | S1 | ||||||
| PG 1211+143 | Q | ||||||
| B2 1215+30 | HP | ||||||
| MARK 766c | S1 | ||||||
| PG 1307+085a | Q | ||||||
| PG 1218+304 | HP | ||||||
| B2 1223+25h | Q | ||||||
| 3C 273.0a | Q | ||||||
| TON 1542a | S1 | ||||||
| NGC 4579b | S1.9 | ||||||
| WAS 61 | NLS1 | ||||||
| PG 1244+026c | NLS1 | ||||||
| MS 12480-0600A | S1 | ||||||
| K07.01 | S1 | ||||||
| NGC 5033h | S1.9 | ||||||
| K08.02 | S1 | ||||||
| MS 13326-2935 | BL | ||||||
| MCG 06.30.015f | S1 | ||||||
| IRAS 13349+243 | Q | ||||||
| 2E 1346+2646 | NLS1 | ||||||
| NGC 5548 a | S1 | ||||||
| PG 1416-129d | S1.2 | ||||||
| MARK 474 | S1 | ||||||
| MARK 841 | S1 | ||||||
| MARK 290d | S1 | ||||||
| MARK 876a | Q | ||||||
| NGC 6251e | S2 | ||||||
| 3C 345.0 | HP | ||||||
| EXO 1652.4+393 | NLS1 | ||||||
| NGC 6814b | S1.5 | ||||||
| F 339 | S1 | ||||||
| NGC 7214 | S1 | ||||||
| NGC 7213b | S1 | ||||||
| MS 22549-3712 | S1 | ||||||
| NGC 7469a | S1 | ||||||
| MARK 926h | S1.5 | ||||||
| MS 23409-1511 | NLS1 |
| Name | ||||
|---|---|---|---|---|
| F9 | ||||
| NGC3783 | ||||
| AKN120 | ||||
| 3C273 | ||||
| PG1211 | ||||
| MARK335 | ||||
| Ton1542 | ||||
| NGC5548 | ||||
| NGC4151 | ||||
| NGC4051 | ||||
| 3C390.3 | ||||
| NGC3516 |