Separating the X-Ray Emissions of UV Ceti A and B with Chandra
Abstract
We present the first spatially separated X-ray observation of the active UV Ceti binary with Chandra, providing important new information on the relative X-ray activity levels of its nearly identical dM5.5e components. The two components had similar X-ray luminosities during low-level periods and emission measure loci derived from Low Energy Transmission Grating spectra reveal similar coronal temperatures ( MK). However, the B component showed a higher degree of variability, resulting in a higher average X-ray luminosity than that of UV Cet A. We discuss possible causes of this enhanced activity in UV Ceti B.
1 Introduction
The nearby ( pc) binary UV Ceti (catalog ) (GJ 65 AB (catalog ); L726 -8 AB (catalog )) is composed of two dM5.5e stars with similar masses and radii (, ) in a highly eccentric orbit with a period of 26.5 y and a semi-major axis of ( AU; Worley & Behall, 1973; Geyer, Harrington, & Worley, 1988). UV Ceti is the prototype of flare stars and has been extensively studied from radio to X-rays (e.g., de Jager et al., 1989; Stepanov et al., 1995; Güdel et al., 1996). Previous X-ray observatories could not separate the components (Pallavicini et al., 1990; Schmitt et al., 1993). However, high angular resolution radio observations have resolved the binary into its components and show that their radio emissions significantly differ: UV Ceti B flares more frequently than UV Ceti A and is also an order of magnitude brighter in its steady radio emission (e.g., Gary & Linsky, 1981; Gary et al., 1982; Kundu et al., 1987; Jackson et al., 1987; Kundu et al., 1988; Jackson et al., 1989; Benz et al., 1998). The different radio behavior between UV Cet A/B raises the obvious question of whether the X-ray properties of the two components are also different. Although previous X-ray observatories lacked sufficient angular resolution to answer this question, it can now be addressed with Chandra. We present here the first spatially separated X-ray observation of UV Ceti A/B. Light curves and spectral emission lines were extracted for both components. A detailed analysis of the Chandra data, and of XMM-Newton and VLA observations of UV Ceti will be presented in a forthcoming paper.
2 Observations
The Chandra X-ray Observatory observed the UV Ceti binary for 75 ksec from 2001 November 26 at 20:55:39 UT to 2001 November 27 at 18:09:27 UT, with the Low Energy Transmission Grating Spectrometer (LETGS) inserted. This configuration provides grating spectra from 1.7 to 177 Å with a constant resolution of Å (FWHM). The positive and negative order spectra are dispersed on the High-Resolution Camera (HRC-S) on each side of the focal aim point, and the latter provides a direct zeroth order image of the target in the energy range keV with an angular resolution of 0.4″ (FWHM). The HRC “pixel” size is . Further details on the instruments can be found in the Chandra Proposers' Observatory Guide111http://cxc.harvard.edu/proposer/POG.
We reduced level 2 files provided by the Chandra X-ray Center, following recommended procedures with the CIAO 2.2.1 software. The binary was aligned almost along the dispersion axis, and was separated in the grating spectra by about 80 mÅ. This way, in the negative order spectrum, emission lines of UV Cet A were shifted to shorter wavelengths relative to UV Cet B, whereas they were shifted to longer wavelengths in the positive order.
3 Separating UV Ceti A and B
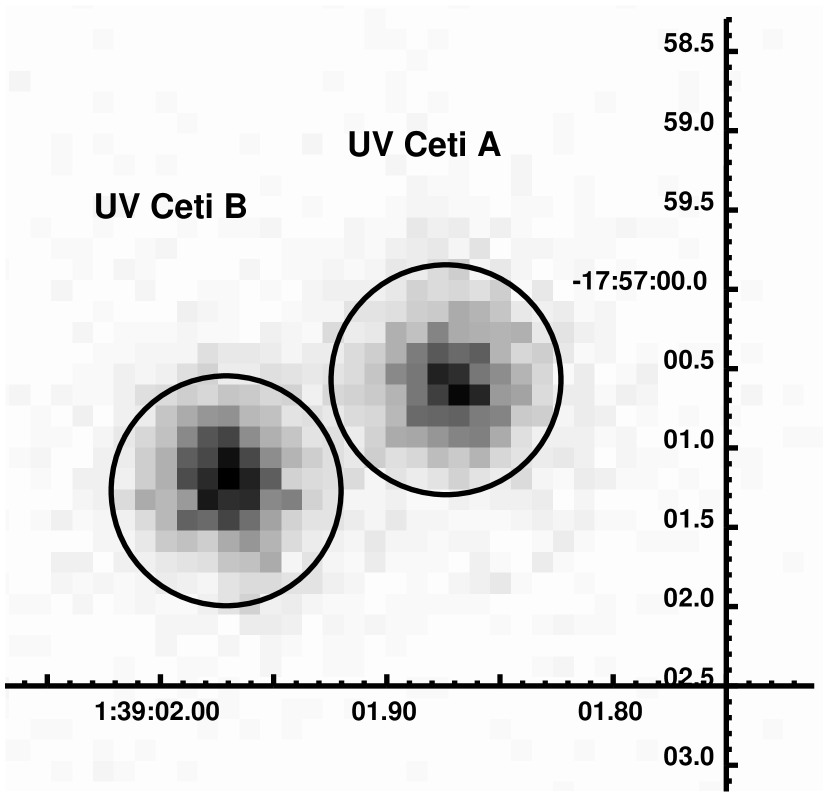
Figure 1 shows the zeroth order image of the binary; the astrometry is expected to be accurate within 1″. We used a sliding cell source detection algorithm with a fixed cell size of 6 pixels (). The components were separated by with UV Ceti B lying at a position angle of relative to A. At the epoch of our observation, the orbital solution of Geyer et al. (1988) gives a separation of and a position angle of , whereas the solution of Worley & Behall (1973) gives and an angle of . Our X-ray positions are therefore in excellent agreement with the expected optical positions.
4 Light Curves
We extracted zeroth order light curves for each component using circular regions with radii of 5.5 pixels () and applied dead-time corrections. The background contribution was estimated from nearby regions and was negligible ( ct s-1, scaled to the source extraction region).
Figure 2 shows the X-ray light curves for both components. Obviously, UV Cet B was highly variable and showed at least five large flares, while UV Cet A only showed a gradual rise and fall at the start of the observation. The small flare in UV Cet A occurring simultaneously with the large flare in UV Cet B is an artifact due to flux contamination from component B to component A. The two stars had a similar low-level X-ray count rate (excluding the five large flares, see Fig. 2), around ct s-1 ( erg s-1 for each component, 0.1-10 keV; based on a simulation of a 0.34 keV [see §5] coronal plasma with solar abundances in the Portable, Interactive Multi-Mission Simulator, PIMMS; Mukai 1993).
UV Cet B displayed two types of flares: the first type is characterized by a slow increase and a slow decay, with similar time scales. The second flare type is reminiscent of “impulsive” solar flares, with a rapid rise and a slower decay. Both flare types however share similar total durations of s. The peak count rate of the giant flare in UV Cet B is about a factor of 100 over the low-level count rate ( erg s-1; for a 1.37 keV plasma in PIMMS); the flare has a very short rise time of 80 s, and returns to the preflare level after s (see inset in Fig. 2). A secondary peak occurs during the decay phase of the first flare, perhaps indicating the occurrence of a second flare.
5 Spectra
We present in this section a discussion of the Chandra LETGS spectra of UV Ceti A and B. In this paper, our analysis focuses on the low-level emission (50.8 ksec), however we do note that emission lines from higher ionization stages of Fe (e.g., Fe XXIII and Fe XXIV in the 10-12 Å range) were seen during flares. The selected time intervals for the low-level emission are shown in the upper panel of Fig. 2. Figure 3 shows the full Chandra positive and negative order spectra during the low-level emission. Since the latter is faint (a total of 0.11 ct s-1 in the dispersed spectra), only a few bright emission lines have been positively detected. The low-level X-ray spectra of UV Cet A and B are similar. They show the strongest emission in the O VIII Ly line. Emission lines from Fe XVII, Ne IX, Ne X, C VI, N VII, O VII are also detected below 40 Å. The range of temperatures over which these lines form indicates that there is significant emission measure (EM) in the range MK, which is confirmed by electron temperature diagnostics such as line ratios. Reliable density measurements could not be obtained because of low fluxes in the closely-spaced He-like triplets and line blending (see, e.g., panels b and d in Fig. 4). At longer wavelengths ( Å), the signal-to-noise ratio was insufficient to significantly detect emission lines. We derived upper limits to fluxes of Fe L-shell lines with typical large emissivities, such as Fe XVIII 93.92 Å, Fe XIX 108.37 Å, Fe XXI 128.73 Å, Fe XX/Fe XXIII 132.85 Å, Fe IX 171.07 Å, and Fe X 174.53 Å. The absence of detectable emission from these lines suggests that there is no significant EM at high ( MK) or low ( MK) temperatures.
We fitted the positive and negative order spectra simultaneously with two monochromatic emission lines per feature (for UV Cet A and B) folded through the Chandra line response function. In the negative order spectrum, the model line wavelengths were shifted by mÅ to account for the wavelength discrepancy between the positive and negative order spectra with CIAO 2.2.1. The emission lines from UV Cet A and B were separated by a fixed 80 mÅ. First order grating response matrices from July 2002 as provided by the LETGS calibration team were used222http://cxc.harvard.edu/cal/Links/Letg/User/Hrc_QE/ea_index.html. Line emissivities from APEC 1.2 (Smith et al., 2001) were used to calculate the EM loci curves. We assumed that the coronal abundances in UV Cet A and B were identical to the solar photospheric abundances (Anders & Grevesse, 1989). The line fluxes were not corrected for interstellar absorption, since it is very small ( cm-2, based on the canonical interstellar density cm-3, Paresce 1984), even at the long wavelength end of the LETGS (% absorption at 170 Å). We provide EM loci of UV Cet A and B in Figure 5; EM loci of detected Fe lines (solid curves) and of detected other elements (dotted curves) are shown with 68% confidence ranges at the maximum formation temperatures (), suggesting that Ne and O are overabundant relative to Fe. Upper limits (90% confidence ranges) for the EM loci of undetected Fe lines (dashed curves) are also shown with arrows at .
We have checked the consistency of our upper limits with the archival EUVE data of UV Cet. Since this paper aims at presenting the new Chandra results, we present here only a summary of the EUVE analysis. The UV Cet binary was observed during a time span of 885 ksec, with an effective exposure of about 230 ksec. Its Deep Survey (DS; 65–190 Å) light curve displayed strong variability with several short flare-like events. We extracted the Short Wavelength (SW; 70–190 Å) spectrum during the low-level emission (DS count rates lower than 0.1 ct s-1; exposure of 188 ksec), and compared the line fluxes with those in the Chandra LETGS spectrum. We emphasize that EUVE could not separate the binary spatially and spectroscopically. Only two lines were detected, the Fe XX/Fe XXIII 132.85 Å blend, and the Fe XVIII 93.92 Å line; their measured fluxes were ph cm-2 s-1 and ph cm-2 s-1, respectively. The sum of the upper limits for UV Cet A/B obtained from the LETGS ( 132.85 Å: and ph cm-2 s-1, 93.92 Å: and ph cm-2 s-1, for UV Cet A and B, respectively) are compatible with the measured fluxes in EUVE SW. The other Fe L-shell lines formed at high or low temperature (see previous paragraph) remain undetected by EUVE, and their upper limits are also consistent with our Chandra upper limits.
6 Discussion and Conclusions
Numerous radio observations of the UV Ceti binary system have shown that the coronae of both components differ significantly. The non-flaring radio emission of the primary is much weaker than that of the secondary and often remains undetected (e.g., Gary et al., 1982; Kundu et al., 1987). Their flares also are different: on UV Cet A, flares are often highly circularly polarized, thus suggesting some coherent emission mechanism (Gary et al., 1982; Benz et al., 1998; Bingham et al., 2001), whereas flares in UV Cet B often show only weak or moderate polarizations consistent with gyrosynchrotron emission (e.g., Jackson et al., 1987; Güdel et al., 1996), and occur more frequently than flares in the primary.
The contrasting behavior in the radio is peculiar since the two stars are otherwise thought to be very similar, with almost identical masses and radii. A study of their spatially separated X-ray emissions thus promises to uncover differences in the coronal energy release behavior of the two stars. UV Cet A did not display any strong X-ray variability, while UV Cet B was on average twice as luminous as the primary, essentially because it displayed a higher flare rate (Fig. 2, top panel). The radio emission is due to the production of high-energy electrons during the flare process. Gyrosynchrotron emission would, under solar-like conditions, decay rapidly due to radiation and collisional losses (within minutes). However, if extended, weak magnetic fields were present, then part of the relativistic electron population produced during the detected large X-ray flares could be efficiently trapped for durations much longer than the characteristic time between large flares since for synchrotron losses. Spatially resolved VLBA observations support such a model for UV Cet B (whereas no extended structure was identified in the primary). Benz et al. (1998) inferred magnetospheric structures around UV Cet B several times larger than the star, and from the decay time of a gradual flare ( s) they inferred magnetic field strengths of only a few tens of Gauss. Based on this observation, Kellett et al. (2002) further proposed a magnetic trap model that would at the same time explain steady radio and X-ray emission.
In contrast to the quasi-steady radio emission of each component, the quasi-steady X-ray count rates of the two components are similar. A closer look at the Chandra low-level light curve of UV Cet B (Fig. 2, middle panel) shows that its “quiescent” emission is in fact flickering and is composed of numerous temporally resolved flares, with a possible quasi-steady emission not exceeding 0.01 ct s-1 or 30% of the average low-level emission. It may well be that the entire X-ray emission is a superposition of the detected flare decays, including very small events. This could be similar for the X-ray emission of UV Cet A (Fig. 2, bottom panel). Accelerated electrons from these flares can further add to the quasi-steady radio emission, but they are particularly well trapped in the extended magnetosphere of UV Cet B. XMM-Newton data of the dM5.5e star Proxima Centauri have yielded similar results; its quiescent X-ray emission was temporally resolved into a continual sequence of weak flares (Güdel et al., 2002). These results provide strong support for the hypothesis that low-energy flares contribute significantly to the coronal heating in stars (Audard et al., 2000; Kashyap et al., 2002; Güdel et al., 2003). In the Sun, flares with small energies contribute a significant amount to the total coronal heating (e.g., Krucker & Benz, 1998; Parnell & Jupp, 2000).
In conclusion, the radio and X-ray behaviors of UV Cet A and B are strikingly different. VLBA measurements have revealed an extended magnetosphere around UV Cet B only, and Chandra shows that the B component displays a harder distribution of X-ray flares. Such flares may repeatedly produce and trap electrons in the extended magnetosphere at a rate sufficient to sustain the quasi-steady radio emission. Given the similar masses and spectral types of the binary components, it is yet unclear why their coronal behavior should differ. Stellar rotation may play an important role, since coronal activity is roughly proportional to the rotation rate. Infrared spectroscopy has recently shown that UV Cet A rotates relatively fast ( km s-1; Hinkle et al. 2003), but no measurement is yet available, to our knowledge, for UV Cet B. The physical causes responsible for the disparate coronal behaviors of these two stars remain yet unexplained, however the answer to this question may provide important information on the generation and sustainment of magnetic fields in late-type stars.
References
- Anders & Grevesse (1989) Anders, E., & Grevesse, N. 1989, Geochim. Cosmoschim. Acta, 53, 197
- Audard et al. (2000) Audard, M., Güdel, M., Drake, J. J., & Kashyap, V. L. 2000, ApJ, 541, 396
- Benz et al. (1998) Benz, A. O., Conway, J., & Güdel, M. 1998, A&A, 331, 596
- Bingham et al. (2001) Bingham, R., Cairns, R. A., & Kellett, B. J. 2001, A&A, 370, 1000
- de Jager et al. (1989) de Jager, C., et al. 1989, A&A, 211, 157
- Gary & Linsky (1981) Gary, D. E., & Linsky, J. L. 1981, ApJ, 250, 284
- Gary et al. (1982) Gary, D. E., Linsky, J. L., & Dulk, G. A. 1982, ApJ, 263, L79
- Geyer et al. (1988) Geyer, D. W., Harrington, R. S., & Worley, C. E. 1988, AJ, 95, 1841
- Güdel et al. (2003) Güdel, M., Audard, M., Kashyap, V. L., Drake, J. J., & Guinan, E. F. 2003, ApJ, 582, 423
- Güdel et al. (2002) Güdel, M., Audard, M., Skinner, S. L., & Horvath, M. 2002, ApJ, 580, L73
- Güdel et al. (1996) Güdel, M., Benz, A. O., Schmitt, J. H. M. M., Skinner, S. L. 1996, ApJ, 471, 100
- Hinkle et al. (2003) Hinkle, K. H., Valenti, J., Wallace, L., & Tsuji, T., BAAS, 34, 144.01
- Jackson et al. (1987) Jackson, P. D., Kundu, M. R., & White, S. M. 1987, ApJ, 316, L85
- Jackson et al. (1989) Jackson, P. D., Kundu, M. R., & White, S. M. 1989, A&A, 210, 284
- Kashyap et al. (2002) Kashyap, V. L., Drake, J. J., Güdel, M., & Audard, M. 2002, ApJ, 580, 1118
- Kellett et al. (2002) Kellett, B. J., Bingham, R., Cairns, R. A., & Tsikoudi, V. 2002, MNRAS, 329, 102
- Krucker & Benz (1998) Krucker, S., & Benz, A. O. 1998, ApJ, 501, L213
- Kundu et al. (1987) Kundu, M. R., Jackson, P. D., White, S. M., & Melozzi, M. 1987, ApJ, 312, 822
- Kundu et al. (1988) Kundu, M. R., Pallavicini, R., White, S. M., & Jackson, P. D. 1988, A&A, 195, 159
- Mukai (1993) Mukai, K. 1993, Legacy 3, 21
- Pallavicini et al. (1990) Pallavicini, R., Tagliaferri, G., & Stella, L. 1990, A&A, 228, 403
- Paresce (1984) Paresce, F. 1984, AJ, 89, 1022
- Parnell & Jupp (2000) Parnell, C. E., & Jupp, P. E. 2000, ApJ, 529, 554
- Schmitt et al. (1993) Schmitt, J. H. M. M., Haisch, B., & Barwig, H. 1993, ApJ, 419, L81
- Smith et al. (2001) Smith, R. K., Brickhouse, N. S., Liedahl, D. A., Raymond, J. C. 2001, ApJ, 556, L91
- Stepanov et al. (1995) Stepanov, A. V., Fürst, E., Krüger, A., Hildenbrandt, J., Barwig, H., & Schmitt, J. H. M. M. 1995, A&A, 299, 739
- Worley & Behall (1973) Worley, C. E., & Behall, A. L. 1973, AJ, 8, 650