HETE-2 Localization and Observation of the Bright, X-Ray-Rich Gamma-Ray Burst GRB 021211
Abstract
A bright, X-ray-rich gamma-ray burst (GRB) was detected by the French Gamma Telescope (FREGATE) and localized with the Wide-field X-ray Monitor (WXM) and Soft X-ray Camera (SXC) instruments on the High Energy Transient Explorer 2 satellite (HETE-2) at 11:18:34.03 UT (40714.03 SOD) on 11 December 2002. The WXM flight software localized the burst to a 14′ radius; this was relayed to the astronomical community 22 seconds after the start of the burst. Ground analysis of WXM and SXC data provided refined localizations; the latter can be described as a circle with a radius of 2′ centered at R.A. 08h 09m 00s, Dec 06° 44′ 20″ (J2000). GRB 021211 consists of a single, FRED-like pulse with a duration s at high energies (85–400 keV) which increases to s at low energies (2–10 keV). The peak photon number and photon energy fluxes in the 2–400 keV band are ph cm-2 s-1 and erg cm-2 s-1, respectively. The energy fluences in the 2–30 keV and 30–400 keV energy bands are erg cm-2 and erg cm-2, respectively. Thus GRB 021211 is an “X-ray-rich” GRB (). The average spectrum of the the burst is well-fit by a Band function (low-energy power-law index ; high-energy power-law index ; and energy of the peak of the spectrum in , keV). The near-real time optical follow-up of GRB 021211 made possible by HETE-2 led to the detection of an optical afterglow for what otherwise would quite likely have been classified as an “optically dark” GRB, since the optical transient faded rapidly (from to ) within the first 20 minutes, and was fainter than within 24 hours after the burst. GRB 021211 demonstrates that some fraction of burst afterglows are “optically dark” because their optical afterglows at times 1 hour after the burst are very faint, and previously have often escaped detection. Such bursts are “optically dim” rather than truly “optically dark.” GRB 021211 also shows that even such “optically dim” bursts can have very bright optical afterglows at times 20 minutes after the burst.
1 Introduction
The bane of the gamma-ray burst (GRB) field are the so-called “optically dark” bursts: those frustrating events for which, despite the best efforts of the satellite observers to provide an accurate and rapid location for the burst, and the diligence of the followup community in searching for a corresponding transient event, in the end, only upper limits on any optical afterglow can be established. In this paper we report on an event that provides a partial answer to the puzzle of such “optically dark” GRBs.
On Dec 11 2002, at 11:18:34.03 UT (40714.03 SOD), the High Energy Transient Explorer 2 Satellite (HETE-2; Ricker et al. 2003) detected a GRB (Crew et al., 2002), with the French Gamma Telescope (FREGATE) (Atteia et al., 2003). GRB 021211 lasted only a few seconds, but it was bright enough and soft enough to allow the Wide-field X-ray Monitor (WXM) (Kawai et al., 2003) to unambiguously locate its position. The Soft X-ray Camera (SXC) (Villasenor et al., 2003a) also easily detected the burst. The WXM flight location was relayed to the ground via the burst alert network (Crew et al. 2003; Villasenor et al. 2003.; Vanderspek et al. 2003) 22 s after the start of the burst. HETE-2 was at this moment emerging from a no-contact zone over the Pacific Ocean—the burst message was caught on the horizon by the HETE-2 secondary ground station in the Galapagos Islands.
Three robotic telescopes, RAPTOR (RAPid Telescopes for Optical Response), KAIT (Katzman Automatic Imaging Telescope), and Super-LOTIS (Livermore Optical Transient Imaging System), caught the optical transient during the second minute of the event (Wozniak et al., 2002; Li et al., 2002; Park et al., 2002) and a fourth provided the identification of the optical afterglow only 54 minutes after the start of the burst (Fox & Price, 2002). However, the afterglow had already faded to R 19 at the time of this fourth observation, and subsequent observations showed that it had faded to 23rd magnitude within 24 hours of the burst (Klose et al., 2002; Lamb et al., 2002b; McLeod et al., 2002; Fox et al., 2003b; Pandey, et al., 2003). The host galaxy of the burst was identified in HST images taken on 18 December (Fruchter et al., 2002); soon thereafter, the redshift of the host galaxy was determined to be (Vreeswijk et al., 2002).
The optical afterglow of GRB 021211 is only the third to be caught in near-real time, the other two being GRB 990123 (Briggs et al., 1999; Akerlof et al., 1999) and GRB 021004 (Shirasaki et al., 2002; Doty et al., 2002; Lamb et al., 2002a; Fox et al., 2003a). The afterglow of GRB 021211 was more than three magnitudes fainter than was the afterglow of GRB 990123 at the same epochs, and about 70% of the searches conducted to date would have failed to detect it at one day after the burst (see Berger et al., Figure 4; Lazzati, Covino & Ghisellini 2002, Figure 1; Fox et al. 2003b, Figure 2).
We turn now to a discussion of the properties of the prompt X-ray and -ray emission from GRB 021211, which will allow a comparison of this event with GRB 990123 (and other bursts with bright optical afterglows), in the hope that such a comparison may shed some light on the nature of “optically dark” bursts. We show that GRB 021211, while having a duration that is shorter than that of most long-duration bursts and lying near the boundary in duration between long and short GRBs (Hurley 1992; Lamb, Graziani, and Smith 1993; Kouveliotou et al. 1993) is definitely a long burst, by virtue of its spectral properties. Indeed, the burst is “X-ray-rich,” with a spectrum that peaks at keV. The duration of the burst decreases with increasing energy and exhibits strong spectral evolution from hard to soft, which are also properties that are typical of long GRBs.
2 Observations
2.1 Localization
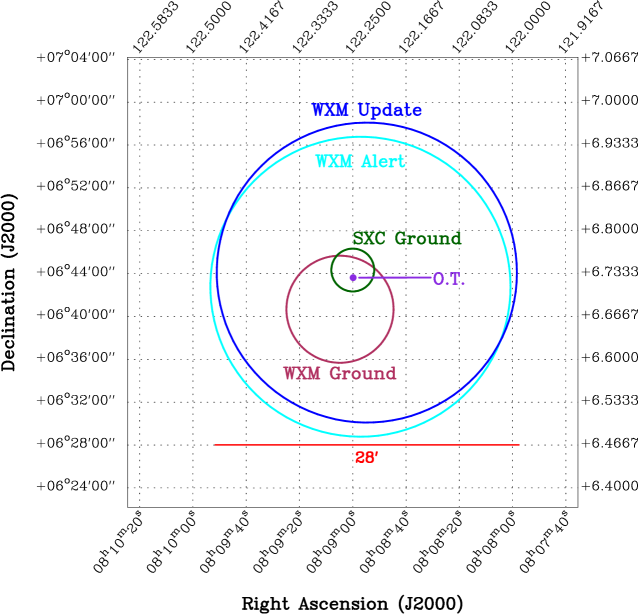
At the time of the burst, the HETE-2 spacecraft was pointed 30° away from its nominal anti-solar pointing direction, in order to make calibration observations of the Crab. The burst triggered the FREGATE instrument on the 0.160 s trigger timescale in the FREGATE 85–400 keV energy band. The WXM flight software determined an initial position using the first 3 s of data from the burst; this was relayed to the ground in the Alert message. Several seconds later it found a better Update position using the first 4.8 s of data after the trigger: R.A. = 08h 08m 54.7s, Dec = 06° 44′ 05″. Both positions were assigned a 14′ error radius based on the strength of the image signal to noise ratios ( and 33.5 in the X- and Y-detectors, respectively). The WXM localization was also relayed to the flight SXC software, which correctly localized the burst. However, the SXC flight localization was not sent out to the astronomical community because the calibration of SXC flight localizations had not yet been completed.
Owing to preventive maintenance of the Cayenne Primary Ground Station, burst buffer data were not relayed to the ground until an hour after the burst. The WXM and SXC data were then analyzed (Graziani et al., 2003; Shirasaki et al., 2003; Monnelly et al., 2003), and produced refined localizations that are in good agreement with the WXM flight localization (see Figure 1). Using a 4–5 s foreground region (similar to the choice made by the flight software), the radius of the 90% confidence region for the burst location is 3′ from statistical error alone; including systematic errors, it is conservatively 5′. The SXC analysis was also straightforward. The 2′ radius of the final SXC localization, centered at R.A. = 08h 09m 00.0s, Dec = 06° 44′ 20″, is dominated by systematic errors. The localization history is summarized in Table 1.
GRB 021211 was observed by other spacecraft in the Interplanetary Network, and the resulting IPN localization (Hurley, 2002) is fully consistent with the WXM and SXC localizations. All of these localizations are consistent with the location of the optical transient (Fox & Price, 2002), as shown in Table 1 and Fig. 1.
2.2 Temporal Properties
The burst time history is FRED-like (fast-rise, exponential decay) and relatively featureless in all energy bands of all instruments. The burst lasts 10 s in the SXC (2–10 keV) as shown in Fig. 2a. The SXC data have been binned in 250 ms bins in order to resolve the fast rise of the burst. The duration of the burst in the WXM decreases from s in the 2–5 keV energy band to s in the 10–25 keV energy band, as shown in Fig. 2b–d; the data are binned in 100 ms bins. Fig. 2e–h shows the time history of the burst in various FREGATE energy bands, again binned in 100 ms bins. The duration of the burst decreases to s in the highest FREGATE energy band (85–400 keV).
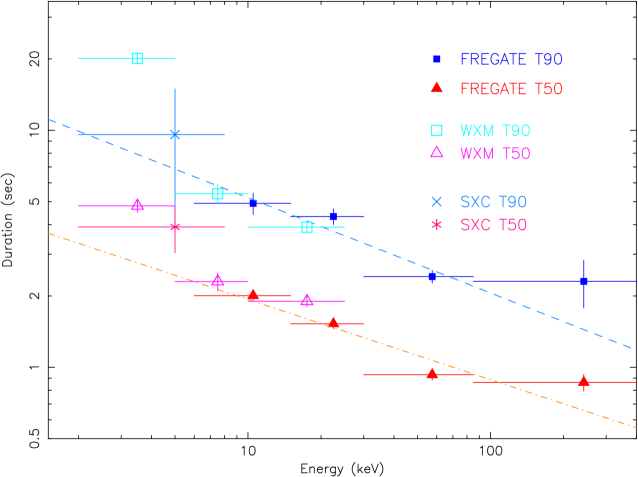
Table 2 gives the and durations for various SXC, WXM and FREGATE energy bands. Figure 3 shows that both duration measures decrease with increasing energy: = (s/keV) and = (s/keV). This behavior is typical of long-duration GRBs (Fenimore et al., 1995). The SXC and WXM data both suggest a departure from this relation at the lowest energies ( 5 keV), and there is indeed some evidence in the WXM 2–5 keV time history for a weak, soft tail (see Figures 2b and 3).
2.3 Spectrum
We investigated the average spectral properties of the burst, using an interval of 8.0 s, which corresponds to the of the burst in the WXM 2–25 keV energy band (see Table 2). To examine the spectral evolution of the burst, we also analyzed the spectra for two subintervals: t = 0–2.3 s, in which the high energy photons are clearly seen in the FREGATE 85–400 keV band in Fig. 2h; and t = 2.3–8.0 s, in which they are absent.
Table 3 presents the results of our time-resolved and time-integrated spectral analysis of the burst. In this analysis, we consider two models: (1) power law times exponential (PLE) [the COMP model in Preece et al. (2000)], and (2) Band function (Band et al., 1993). Both the PLE and the Band function models provide satisfactory descriptions of the data: for the PLE model, (111 DOF), while for the Band function, (110 DOF). However, the difference between for the PLE and Band function models is for one additional parameter. Thus the Band function is preferred at the confidence level.
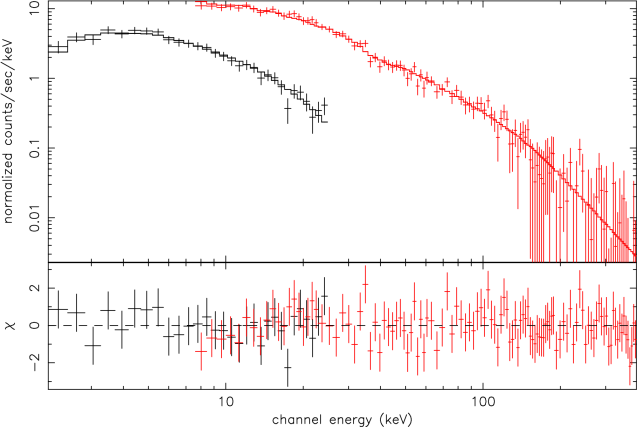
Figure 4 shows the fit of the Band function to the WXM and FREGATE spectral data. The energy of the peak of the spectrum is keV, for the burst-average spectrum, which is at the low end of the range of values observed by BATSE (Preece et al., 2000) and BeppoSAX (Amati et al., 2002). Comparing the values obtained when the full interval is split into two sub-intervals, we find that the spectral index steepens from the first to the second. Likewise, the value decreases dramatically from keV to keV.
The overall emission characteristics of the burst are estimated from the best-fit Band function, and summarized in Table 4. In particular, the peak photon number and photon energy fluxes in 1 s are ph cm-2 s-1 and erg cm-2 s-1 in the 2–400 keV energy band. 111We compute the peak photon number flux using the ratio 2.672 of the flux of photons found in the 1 s time interval containing the largest number of photons and the average flux of photons in the 5 s time interval containing the largest number of photons and that brackets the 1 s time interval. We compute the peak photon energy flux in exactly the same way, except that we use the ratio 2.782 of the total photon energy flux (found by weighting each photon with its energy and summing the energies) found in the 1 s time interval containing the largest total photon energy and the average photon energy flux in the 5 s time interval containing the largest total photon energy and that brackets the 1 s time interval. The energy fluence over the first 8.0 s of the burst was erg cm-2 in the 2–30 keV band and erg cm-2 in the 30-400 keV energy band. This gives a hardness ratio of 0.63, which is softer than many of the bursts seen by HETE-2 to date (Barraud et al., 2003) and makes this an “X-ray-rich” GRB. 222Throughout this paper, we define “X-ray-rich” GRBs and XRFs as those events for which and 0.0, respectively.
3 Discussion
3.1 Burst Properties
GRB 021211 was bright, and its duration was relatively short ( s and s in the FREGATE 85–400 keV energy band; see Table 2) for a long-duration GRB (Hurley, 1992; Lamb et al., 1993; Kouveliotou et al., 1993). The duration of the burst decreases with increasing energy and the spectrum of the burst evolves from hard to soft; both properties are typical of long-duration GRBs. The burst is “X-ray-rich,” with a soft spectrum having a peak energy of only keV, and exhibits a soft tail, which may indicate that the X-ray afterglow of the burst had already begun at this time.
3.2 Optical Follow-Up Observations
Previous to GRB 021211, only two GRB optical afterglows had been caught in near-real time: the optical afterglow of GRB 990123, which was caught by a single robotic telescope (Akerlof et al., 1999); and the optical afterglow of GRB 021004 (another HETE-2 burst), which was caught by two automated telescopes and a robotic telescope (Fox et al., 2003a).
The real-time localization of GRB 021211 by the WXM flight software, which was rapidly followed by a refined WXM location and an SXC location, both based on ground analysis, led to identification of the optical afterglow in automated, filterless observations, using the 48-inch Schmidt telescope at Mt. Palomar, taken 20 minutes after the start of the burst, and reported 53 minutes later (Fox & Price, 2002).
The prompt reporting of the location of GRB 021211 by the HETE-2 flight software made possible an unprecedented number of successful near-real time observations of the optical afterglow by three robotic telescopes: RAPTOR (Wozniak et al., 2002), KAIT (Li et al., 2002), and Super-LOTIS (Park et al., 2002). The observations began 65 s, 108 s, and 143 s, respectively, after the start of the burst, and revealed a light curve for the optical afterglow that decreased rapidly during the first 12 minutes (), followed by a slower decline () (Li et al., 2003). The latter decay rate is not atypical of the early-time behavior of GRB afterglows (see Figure 2 of Fox et al. 2003b).
The host galaxy of the burst was identified in HST images taken using the ACS on 18 December UT (six days after the burst) and using the NICMOS on 24 and 25 December UT (twelve and thirteen days after the burst) (Fruchter et al., 2002). Soon thereafter, observations at the European Southern Observatory using the Very Large Telescope showed that the redshift of the host galaxy is (Vreeswijk et al., 2002).
3.3 Implications for the Nature of GRB Jets
GRB 021211 is the second burst for which an exceptionally bright, rapidly decaying component of the optical afterglow has been seen, the other being the famous event GRB 990123 (Briggs et al., 1999; Akerlof et al., 1999). The rapidly decaying component in GRB 990123 has been interpreted as due to emission from the reverse shock resulting from the the GRB jet striking circumburst material (Sari & Piran, 1999a, b). The behavior of the bright, rapidly decaying component of the optical afterglow of GRB 021211 also appears to be consistent with this interpretation (Fox et al., 2003b).
Zhang, Kobayashi & Mészáros (2003) and Kumar & Panaitescu (2003) have shown that knowledge of both the early-time behavior of the optical afterglow (which is thought to be due to the reverse shock component), and the late-time behavior (which is thought to be due to the forward shock component) provides a diagnostic of whether or not the GRB jet is magnetic energy dominated. A detailed analysis by Kumar & Panaitescu (2003) shows that the early- and late-time behavior of the optical afterglow of GRB 021211 requires that the magnetic energy density in the jet exceed the kinetic energy in the ejecta by a factor . Zhang, Kobayashi & Mészáros (2003) reach a similar conclusion for GRB 990123 (Briggs et al., 1999), the only other GRB which is known to have had an optical afterglow that was very bright at early times (Akerlof et al., 1999).
3.4 Implications for the Nature of “Optically Dark” GRBs
Two explanations of why some GRBs are not detected optically, despite early and deep follow-up observations, have been widely discussed: (1) the optical afterglow is extinguished by dust in the host galaxy of the burst (see, e.g., Reichart & Price 2002) or (2) the GRB lies at very high redshifts (), and the optical afterglow is absorbed by neutral hydrogen in the host galaxy and in the intergalactic medium along the line of sight from the burst to us (see, e.g., Lamb & Reichart 2000). A third explanation has also been mentioned: some GRBs have optical afterglows that are very faint (Fynbo et al., 2001; Berger et al., 2002; Lazzati, Covino, & Ghisellini, 2002).
The optical follow-up observations of GRB 021211 made possible by HETE-2 show that the optical afterglow of this burst was intrinsically much fainter at late times than most afterglows observed previously. In particular, the optical afterglow of GRB 021211 faded from mag to mag within 20 minutes (Fox & Price, 2002), and was fainter than 23rd magnitude within one day (Klose et al., 2002; Lamb et al., 2002b; McLeod et al., 2002; Fox et al., 2003b; Pandey, et al., 2003). The afterglow of GRB 021211 was therefore more than three magnitudes fainter than the afterglow of GRB 990123 at similar epochs (Akerlof et al., 1999). It was 2 magnitudes fainter than the faint optical afterglow of GRB 020124 (Berger et al., 2002) at 100 minutes after the burst, and remained fainter at all subsequent epochs. It was also fainter at one day than the faint optical afterglows of GRB 980613 (Hjorth et al., 2002) and GRB 000630 (Fynbo et al., 2001).
Indeed, about 70% of the searches conducted to date would have failed to detect GRB 021211 at one day after the burst (see Berger et al., Figure 4; Lazzati, Covino & Ghisellini 2002, Figure 1; Fox et al. 2003b, Figure 2). In addition, according to the statistics compiled by Reichart and Yost (2003, Figure 1), 65% (15/23) of GRBs for which optical observations had been made with limiting magnitudes 20 R 23.5 at 18 hours after the burst were classified as “optically dark.” It is therefore quite likely that the optical afterglow of GRB 021211 would not have been detected, were it not for the real-time localization of the burst by the HETE-2 WXM, and the refined WXM and SXC ground localizations that were rapidly disseminated, and would therefore have been classified as an “optically dark” GRB.
Thus GRB 021211 shows that some fraction of burst afterglows are “optically dark” because their optical afterglows at times 1 hour after the burst are very faint, and previously have often escaped detection. These bursts are “optically dim” rather than truly “optically dark.” Their existence and properties may lead to an improved understanding of GRBs themselves, as well as burst afterglows. Their existence (as demonstrated by GRB 021211) also suggests that the current sample of burst optical afterglows is not a “fair sample,” but is skewed toward bright afterglows.
It is interesting to compare the optical afterglow of GRB 021211 and the optical afterglows of GRB 990123 (Briggs et al., 1999) and GRB 021004 (Shirasaki et al., 2002), the only other bursts for which successful real time or near-real time optical afterglow observations have been made (Akerlof et al., 1999; Fox et al., 2003a). The afterglows of both GRB 021211 and GRB 990123 show a rapid decline during the first 20 minutes after the burst, followed by a slower decline, approximately as ; the latter is similar to the behavior of the afterglows of many GRBs at early times. Indeed, the temporal behaviors of the two afterglows are almost carbon copies of each other, with the exception that the optical afterglow of GRB 021211 is more than 3 magnitudes fainter than that of GRB990123 at the same epoch (Akerlof et al., 1999; Fox et al., 2003b). In contrast, the optical afterglow of GRB 021004, another burst that was localized in near-real time by HETE-2 (Shirasaki et al., 2002) and the only other burst for which near-real time optical afterglow observations have been made (Fox et al., 2003a), exhibited a very different behavior at early times: the afterglow faded only gradually in the first 2.5 hours after the burst. These results show that the optical afterglows of GRBs exhibit a variety of behaviors at early times, and illustrate the fact that HETE-2 is making it possible to explore the previously unknown behavior of GRB afterglows in the “gap” in time from the end of the burst to 3–20 hours later that existed during the BeppoSAX era.
3.5 Implications for Using GRBs as a Probe of Cosmology
Confirmation that some GRBs have very bright optical afterglows at early times, even if the afterglows are “optically dim” at late times, has significant implications for using GRB afterglows as a probe of cosmology and the early universe. In particular, the bright early phase of the optical afterglows of GRB 021211 (which lasted 20 minutes) and GRB 990123 (which lasted 30 minutes), would have lasted 1, 2, and 3.5 hours had these burst occurred at redshifts = 5, 10, and 20, rather than at and , respectively. This means that the spectral intensity of the afterglows of GRBs at very high redshifts () available at a fixed time after the burst for NIR and infrared observations could be much greater within the first few hours than has previously been assumed (Lamb & Reichart, 2000; Ciardi & Loeb, 2000).
4 Conclusions
GRB 021211 demonstrates that real-time localization of GRBs is critical to acquiring observations which can help us understand both the transition between the burst itself and its X-ray, optical, and radio afterglows, and the distinct, early behavior of the burst afterglow, including the interpretation that the bright, rapidly fading component is due to emission from a reverse shock.
GRB 021211 also demonstrates that “optically dark” GRBs are due not only to extinction of the optical afterglow by dust in the host galaxy, and to absorption of the optical afterglow by neutral hydrogen in the host galaxy and the IGM, if there are bursts at very high redshifts, but also because the optical afterglows of some GRBs are much fainter than those observed to date and are therefore not detected. The optical afterglows of these bursts should properly be called “optically dim,” rather than “optically dark.” However, GRB 021211 shows that even such “optically dim” bursts can have very bright optical afterglows at times 20 minutes after the burst. This suggests that the UVOT onboard Swift may be able to detect and localize a number of “optically dark” GRBs. The confirmation that some GRBs have very bright optical afterglows at early times, and that even GRBs whose afterglows are “optically dim” at late times can have bright afterglows at early times, also has significant implications for using GRBs and their afterglows as a probe of cosmology and the early universe. It means that the spectral intensity of the afterglows of GRBs at very high redshifts () at a fixed time after the burst could be much greater within the first few hours than has previously been assumed.
Acknowledgments
We would like to thank the anonymous referee for comments and suggestions that materially improved the paper. We would also like to thank Scott Barthelmy for sine qua non GCN support. The HETE-2 mission is supported in the US by NASA contract NASW-4690; in Japan, in part by the Ministry of Education, Culture, Sports, Science, and Technology Grant-in-Aid 13440063; and in France, by CNES contract 793-01-8479. KH is grateful for HETE-2 support under Contract MIT-SC-R-293291, for Ulysses support under JPL Contract 958056, and for IPN support under NASA grant FDNAG5-11451. G. Pizzichini acknowledges support by the Italian Space Agency.
References
- Akerlof et al. (1999) Akerlof, C. et al. 1999, Nature, 398, 400
- Amati et al. (2002) Amati, L. et al. 2002, A&A, 390, 81
- Atteia et al. (2003) Atteia, J-L, et al. 2003, in Gamma-Ray Burst and Afterglow Astronomy 2001, AIP Conf. Proceedings 662, ed. G. R. Ricker & R. K. Vanderspek (New York: AIP), 17
- Band et al. (1993) Band, D. et al. 1993, ApJ, 413, 281
- Barraud et al. (2003) Barraud, C. et al. 2003, A&A, 400, 1021
- Berger et al. (2002) Berger, E., et al. 2002, ApJ, 581, 981
- Briggs et al. (1999) Briggs, M. S. et al. 1999, Astrophys. J., 524, 82
- Ciardi & Loeb (2000) Ciardi, B., & Loeb, A. 2000, ApJ, 540, 687
- Crew et al. (2002) Crew, G., et al. 2002, GCN Circ. 1734
- Crew et al. (2003) Crew, G., et al. 2003, in in Gamma-Ray Burst and Afterglow Astronomy 2001, AIP Conf. Proceedings 662, ed. G. R. Ricker & R. K. Vanderspek (New York: AIP), 66
- Doty et al. (2002) Doty, J. et al. 2002, GCN Circ. 1568
- Fenimore et al. (1995) Fenimore, E. E., in’t Zand, J. J. M., Noris, J. P., Bonnell, J. T., & Nemiroff, R. J. 1995, ApJ, 448, L101
- Fox & Price (2002) Fox, D. W. & P. A. Price 2002, GCN Circ. 1731
- Fox et al. (2003a) Fox, D. W., et al., 2003a, Nature, 422, 284
- Fox et al. (2003b) Fox, D. W., et al., 2003b, ApJ, 586, L5
- Fruchter et al. (2002) Fruchter, A. S. et al. 2002, GCN Circ. 1781
- Fynbo et al. (2001) Fynbo, J. U., et al. 2001, A&A 369, 373
- Gehrels (2003) Gehrels, N. 2003, Proceedings of the 3rd Rome Workshop on GRBs in the Afterglow Era, ASP Conference Proceedings (Chicago: PASP), in press
- Graziani et al. (2003) Graziani, C. et al. 2003, in Gamma-Ray Burst and Afterglow Astronomy 2001, AIP Conf. Proceedings 662, ed. G. R. Ricker & R. K. Vanderspek (New York: AIP), 114
- Hjorth et al. (2002) Hjorth, J., et al. 2002, ApJ, 576, 113
- Hurley (1992) Hurley, K. 1992, in AIP Conf. Proc. 265, Gamma-Ray Bursts, ed. W. Paciesas & G. Fishman (New York: AIP), 3
- Hurley (2002) Hurley, K. 2002, private communication
- Kawai et al. (2003) Kawai, N., et al. 2003, in Gamma-Ray Burst and Afterglow Astronomy 2001, AIP Conf. Proceedings 662, ed. G. R. Ricker & R. K. Vanderspek (New York: AIP), 25
- Klose et al. (2002) Klose, S. et al. 2002, GCN Circ. 1739
- Kouveliotou et al. (1993) Kouveliotou, C. et al. 1993, ApJ, 413, L101
- Kumar & Panaitescu (2003) Kumar, P., & Panaitescu, A. 2003, ApJ, submitted (astro-ph/0305446)
- Lamb et al. (1993) Lamb, D. Q., Graziani, C. & Smith, I. A. 1993, ApJ, 413, L11
- Lamb & Reichart (2000) Lamb, D. Q., & Reichart, D. E. 2000, ApJ, 536, 1
- Lamb et al. (2002a) Lamb, D. Q., et al. 2002a, GCN Circ. 1600
- Lamb et al. (2002b) Lamb, D. Q. et al. 2002b, GCN Circ. 1744
- Lazzati, Covino, & Ghisellini (2002) Lazzati, D., Covino, S., & Ghisellini, G. 2002, MNRAS, 330, 583
- Li et al. (2002) Li, W. et al. 2002, GCN Circ. 1737
- Li et al. (2003) Li, W., Filippenko, A. V., Chornock, R., & Jha, S., 2003, ApJ, 586, L9
- McLeod et al. (2002) McLeod, B. et al. 2002, GCN Circ. 1750
- Monnelly et al. (2003) Monnelly, G. et al. 2003, in Gamma-Ray Burst and Afterglow Astronomy 2001, AIP Conf. Proceedings 662, ed. G. R. Ricker & R. K. Vanderspek (New York: AIP), 49
- Pandey, et al. (2003) Pandey, S. B., et al. 2003, A&A, submitted (astro-ph/0304481)
- Park et al. (2002) Park, H. S., Williams, G., & Barthelmy, S. 2002, GCN Circ. 1736
- Preece et al. (2000) Preece, R. D. et al. 2000, ApJS126, 19
- Reichart& Yost (2003) Reichart, D. E., & Yost, S. A. 2003, ApJ, submitted (astro-ph/0107545)
- Reichart & Price (2002) Reichart, D. E., & Price, P. A. 2002, ApJ, 565, 174
- Ricker et al. (2003) Ricker, G.R. et al. 2003, in Gamma-Ray Burst and Afterglow Astronomy 2001, AIP Conf. Proceedings 662, ed. G. R. Ricker & R. K. Vanderspek (New York: AIP), 3
- Sari & Piran (1999a) Sari, R., & Piran, T. 1999a, ApJ, 517, L109
- Sari & Piran (1999b) Sari, R., & Piran, T. 1999b, ApJ, 520, 641
- Shirasaki et al. (2002) Shirasaki, Y., et al. 2002, GCN Circ. 1565
- Shirasaki et al. (2003) Shirasaki, Y. et al. 2003, in Gamma-Ray Burst and Afterglow Astronomy 2001, AIP Conf. Proceedings 662, ed. G. R. Ricker & R. K. Vanderspek (New York: AIP), 117
- Vanderspek et al. (2003) Vanderspek, R.K., et al. 2003, in Gamma-Ray Burst and Afterglow Astronomy 2001, AIP Conf. Proceedings 662, ed. G. R. Ricker & R. K. Vanderspek (New York: AIP) 101
- Villasenor et al. (2003a) Villasenor, J.N., et al. 2003, in Gamma-Ray Burst and Afterglow Astronomy 2001, AIP Conf. Proceedings 662, ed. G. R. Ricker & R. K. Vanderspek (New York: AIP), 33
- Villasenor et al. (2003b) Villasenor, J.N., et al. 2003, in Gamma-Ray Burst and Afterglow Astronomy 2001, AIP Conf. Proceedings 662, ed. G. R. Ricker & R. K. Vanderspek (New York: AIP), 107
- Vreeswijk et al. (2002) Vreeswijk, P. et al. 2002, GCN Circ. 1785
- Wozniak et al. (2002) Wozniak, P. et al 2002, GCN Circ. 1757
- Zhang, Kobayashi & Mészáros (2003) Zhang, B., Kobayashi, S., & Mészáros, P. 2003, ApJ, in press (astro-ph/0302525)
| Source | Radius | Offset | ||
|---|---|---|---|---|
| WXM Alert | 08 08 57.1 | 06 42 47 | 14′ | 1.1′ |
| WXM Update | 08 08 54.7 | 06 44 05 | 14′ | 1.4′ |
| SXC Flight | 08 09 07.0 | 06 43 48 | – | 1.6′ |
| WXM Ground | 08 09 04.8 | 06 40 41 | 5′ | 3.2′ |
| SXC Ground | 08 09 00.0 | 06 44 20 | 2′ | 0.7′ |
| Optical Transient | 08 08 59.858 | 06 43 37.52 | 0.1″ | – |
Note. — The units of right ascension are hours, minutes, and seconds; those of declination are degrees, arcminutes, and arcseconds. The position error radius is for 90% confidence and the offset is from the Fox & Price (2002) optical transient.
| Instrument | Energy | ||
|---|---|---|---|
| (keV) | (s) | (s) | |
| HETE-2 SXC | 2–10 | 3.9 0.9 | 9.6 5.4 |
| HETE-2 WXM | 2–25 | 2.8 0.2 | 8.0 0.2 |
| 2–10 | 3.1 0.1 | 8.5 0.5 | |
| 2–5 | 4.8 0.3 | 20.2 1.1 | |
| 5–10 | 2.3 0.2 | 5.4 0.5 | |
| 10–25 | 1.9 0.1 | 3.9 0.2 | |
| HETE-2 FREGATE | 6–15 | 2.01 0.08 | 4.92 0.50 |
| 15–30 | 1.53 0.07 | 4.33 0.33 | |
| 30–85 | 0.93 0.05 | 2.41 0.15 | |
| 85–400 | 0.86 0.07 | 2.30 0.52 |
Note. — Errors are 1-; the SXC energy range is approximate.
| Parameter | t = 0–2.3 s | t = 2.3–8.0 s | t = 0–8.0 s |
|---|---|---|---|
| Cutoff Power Law: | |||
| Photon index | |||
| Peak energy () | |||
| Cutoff energy ( keV) | |||
| Normalization (at 15 keV) | |||
| Band Function: | |||
| Index | |||
| Index | |||
| Peak energy ( keV) | |||
| Normalization (at 15 keV) |
Note. — Errors are for 90% confidence. The normalization units are ph cm-2 s-1 keV-1.
| Energy | Peak Photon Flux | Photon Fluence | Peak Energy Flux | Energy Fluence |
|---|---|---|---|---|
| (keV) | (ph cm-2 s-1) | (ph cm-2) | ( erg cm-2 s-1) | ( erg cm-2) |
| 2–10 | ||||
| 2–25 | ||||
| 2–30 | ||||
| 7–30 | ||||
| 30–400 | ||||
| 50–100 | ||||
| 100–300 | ||||
| 2–400 |
Note. — All of the quantities in this table are derived assuming a Band function for the spectrum. Errors are for 90% confidence.