11email: jurcsik@konkoly.hu
The metallicity range of variables in M3
The recently published spectroscopic metallicities of RR Lyrae stars in M3 (Sandstrom et al., 2001) though show a relatively wide range of the [Fe/H] values, the conclusion that no metallicity spread is real has been drawn, as no dependence on either minimum temperature or period was detected. Comparing these spectroscopic metallicities with [Fe/H] calculated from the Fourier parameters of the light curves of the variables a correlation between the [Fe/H] values appears. As a consequence of the independence of the spectroscopic and photometric metallicities, this correlation points to the reality of a metallicity spread. The absolute magnitudes of these stars follow a similar trend along both the spectroscopic and photometric metallicities as the general relation predicts, which strengthens that the detected metallicity range is real.
Key Words.:
globular clusters: individual: M3 – Stars: abundances – Stars: variables: RR Lyr – Stars: horizontal-branch – Stars: Population II1 Introduction
Nearly every globular cluster contains stars of homogeneous metallicity. The most prominent exception is Cen with its considerably large, 1 dex spread in the [Fe/H] content of giants and subgiants. Slight [Fe/H] inhomogeneity in M92 (King et al., 1998; Langer et al., 1998) has also been detected. Concerning the other elemental abundances, detailed chemical composition analysis of globular cluster stars have revealed that complicate patterns of abundance inhomogeneity exist in many clusters.
M3 is one of the reference clusters of the globular cluster metallicity scale. Spectroscopically, [Fe/H] has been already derived from high dispersion studies of about 10 giant stars (Bell & Dickens, 1980; Kraft et al., 1992; Cavallo & Nagar, 2000; Kraft & Ivans, 2002) which do not show any evidence of a [Fe/H] spread. The latest result gives an average [Fe/H] value of dex on a metallicity scale based on measurements of FeII lines in order to avoid the non-negligible bias of overionization effects in FeI lines (Kraft & Ivans, 2002). The first spectroscopic data on direct [Fe/H] measurements of the cluster RR Lyrae variables have been recently published by Sandstrom et al. (2001, hereafter SPS). Using moderate resolution spectra taken with the Hydra multifiber spectrograph they conclude that the RR Lyrae variables are also uniform in composition as no dependence on either minimum temperature or period can be found based on data of 29 RR Lyrae variables. Although the scatter in SPS’s [Fe/H] values ( and from FeI and FeII lines, respectively) can be explained by uncertainties of model parameters and equivalent widths, it does not exclude the possibility of some real star to star [Fe/H] abundance differences either.
In Jurcsik & Kovács (1996) it has been shown that the [Fe/H] of RRab stars calculated from the period (P) and the Fourier phase-difference of the light curve is as accurate as most of the spectroscopic results. With this formula the spectroscopic [Fe/H] of the 81 calibrating RRab stars could be reproduced with 0.14 dex standard deviation.
In a preliminary investigation it has been found that the metallicities of the RRab stars in M3 calculated according to this photometric method show larger spread than expected if the [Fe/H] of the variables is homogeneous (Bakos & Jurcsik, 2000).
The aim of the present Letter is to check the reality of any possible [Fe/H] inhomogeneity of the M3 variables comparing their spectroscopic and photometric metallicity values.
2 Spectroscopic and photometric [Fe/H]
The two metallicity determination methods – namely, a) spectroscopic; b) utilizing light curve parameters (photometric) –, are completely independent, therefore any correlation between these metallicities would indicate that the observed metallicity spread is real.
2.1 Spectroscopic metallicities
During the last few years strong arguments were raised against metallicity determinations using FeI lines (Lambert et al., 1996; Thévenin & Idiart, 1999; Kraft & Ivans, 2002) because of the non-negligible departures from LTE in metal-poor stellar atmospheres resulting overionization of iron. Based on these results for the comparison purposes we use exclusively the FeII metallicities of SPS, which have unexpectedly large, dex range.
The signal-to-noise ratio (S/N) of the spectroscopic observations varies between 28 and 76 whereas the number of spectra (NS) of individual stars are between 10 and 41. For V9 both the S/N and NS have one of the lowest values, 30 and 10, respectively. Therefore we have decided to omit this star from the spectroscopic sample. The seems to be unreliably large for this star based on the comparison of its light curve with a large sample of RRab light curves compiled in Jurcsik (1998). A field RR Lyrae star (UW Gru) has been found to show light changes very similar to M3/V9.
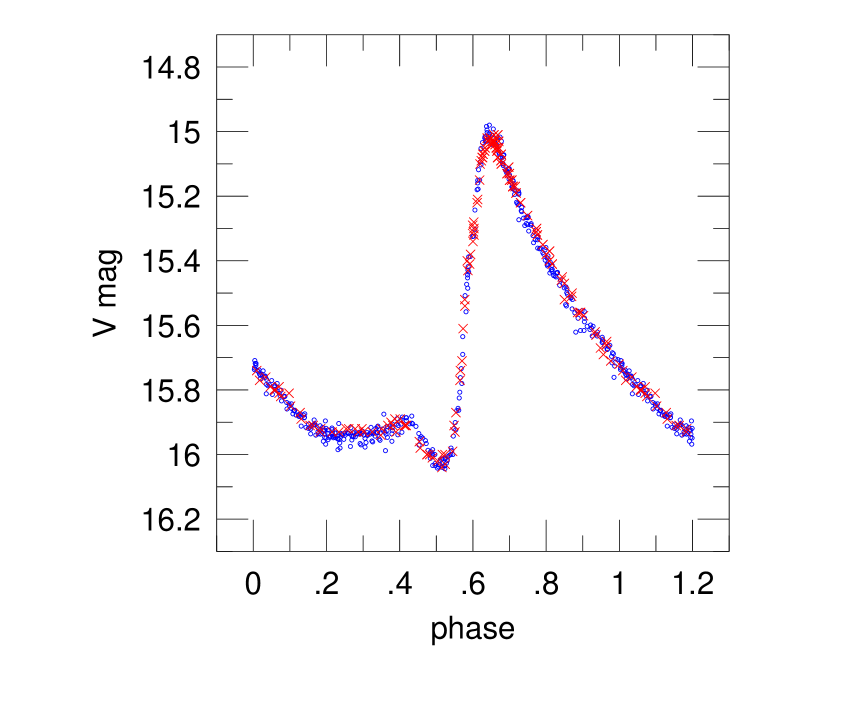
Fig. 1 shows the phased light curves of M3/V9 and UW Gru using the observations of Corwin & Carney (2001) and Benkő et al. (2003) for M3/V9, and Bernard (1982) for UW Gru. The light curves of these two stars can be hardly separated, within photometric uncertainties they can be regarded as identical. We suppose that such equality of the light curves with similar pulsation periods can only happen if there is no significant difference in any of the basic physical properties of the two stars. The periods of these variables are very similar and their mean colours are also the same within the range limited by the photometric uncertainties as given in Table 1. The metallicity of UW Gru was given as dex in (Layden, 1994) which was transformed to dex metallicity value on a common [Fe/H] scale used in Jurcsik & Kovács (1996). As a consequence of the absolute equality of the light curves of M3/V9 and UW Gru the spectroscopic value cannot be correct for M3/V9. It validates our decision to omit V9 from the spectroscopic sample.
2.2 Photometric metallicities
Reliable photometric [Fe/H] can be determined for 19 RRab stars among the spectroscopic sample of SPS (29 stars). The following stars are omitted:
-
•
stars showing strong Blazhko modulation that makes [Fe/H]phot incorrect (V20, V39, V52, V61, V63, V66, V78).
-
•
no or poor quality published light curves are available (V113, V115).
-
•
V202, which cannot be regarded as a normal RRab star based on its long period (077), light curve shape, and low amplitude ().
In order to increase the small sample size those Blazhko stars are also used in the comparison which exhibit only slight light curve modulations (V10, V59 and V62). The small amplitude modulations are supposed not to affect significantly the calculated photometric metallicities.
For most of the stars photometries are available from different sources. In these cases the data have been merged with necessary zero-point offsets ( mag) and a single [Fe/H]phot is calculated from the combined data set. In each case the magnitude correction has been determined relative to the Corwin & Carney (2001) data. All the data have been cleaned from outlying points. The large number of the photometric measurements (N) makes the separation of discrepant data unambiguous in most of the cases. The formal errors of the [Fe/H]phot values are between 0.03 and 0.07 dex.
2.3
The spectroscopic and photometric metallicities, the intensity averaged mean magnitudes according to Corwin & Carney (2001), and the used photometries of the variables are listed in Table 2.
| Var. | [Fe/H] | [Fe/H]phot | Rem.b | Ref. phot.c | |
| dex | mag | ||||
| 9 | 0.87 | 1.53 | 15.630 | * | 2, 3 |
| 10 | 1.55 | 1.48 | 15.615 | (Bl) | 2, 3, 4, 5 |
| 15 | 1.24 | 1.47 | 15.597 | 2, 3, 5 | |
| 18 | 1.06 | 1.30 | 15.673 | 2, 3, 5 | |
| 20 | 1.51 | 15.611 | Bl | 2, 3 | |
| 36 | 1.43 | 1.44 | 15.618 | 2, 3 | |
| 39 | 1.09 | 15.674 | Bl | 2, 3 | |
| 46 | 1.35 | 1.11 | 15.668 | 1, 2, 3, 4 | |
| 51 | 1.34 | 1.33 | 15.621 | 2, 3, 5 | |
| 52 | 1.22 | 15.705 | Bl | 2, 3, 5 | |
| 59 | 1.06 | 1.23 | 15.646 | (Bl) | 2, 3, 5 |
| 60 | 1.28 | 1.28 | 15.520 | 2, 3 | |
| 61 | 1.33 | 15.641 | Bl | 2, 3, 5 | |
| 62 | 1.28 | 1.14 | 15.620 | (Bl) | 2, 3, 5 |
| 63 | 0.83 | 15.661 | Bl | 2, 3, 5 | |
| 66 | 1.05 | 15.607 | Bl | 1, 2, 3, 4, 5 | |
| 77 | 0.97 | 1.12 | 15.725 | ** | 1, 2, 3, 4 |
| 78 | 0.93 | 15.554 | Bl | 1, 2, 3, 4 | |
| 81 | 1.41 | 1.43 | 15.656 | 2, 3 | |
| 82 | 1.59 | 1.57 | 15.601 | 3 | |
| 84 | 1.03 | 1.19 | 15.630 | 1, 2, 3, 4, 5 | |
| 90 | 1.05 | 1.36 | 15.639 | 2, 3, 5 | |
| 93 | 1.60 | 1.37 | 15.640 | 2, 3 | |
| 94 | 1.13 | 1.37 | 15.677 | 2, 3 | |
| 113 | 1.48 | ** | |||
| 114 | 0.92 | 1.27 | 15.686 | 3 | |
| 115 | 1.30 | ** | 3 | ||
| 116 | 1.42 | 1.26 | 15.685 | 2, 3 | |
| 202 | 1.19 | 15.524 | *** | 2, 3 | |
-
a
[Fe/H]spect = [Fe/H]FeII from SPS.
-
b
Bl: no [Fe/H]phot is calculated for Blazhko stars with large light curve modulation;
(Bl): Blazhko stars with slight light curve changes are included but photometric [Fe/H] is less certain;
* : spectroscopic [Fe/H] seems to be wrong, see the text for details;
** : photometric data have larger scatter;
*** : classification is uncertain;
: no or poor quality light curve is available.
- c

The final sample of stars with [Fe/H] reliably determined both spectroscopically and photometrically consists of a limited number of 18 variables. Fig. 2 shows these data, with the direct and inverse regression fits overplotted. The linear Pearson correlation coefficient between the two data sets is 0.54, with 0.021 probability value. The small number of data makes it difficult to estimate the statistical significance of this result. Therefore, Monte-Carlo simulation has been performed in order to decide whether the correlation between the metallicities is real, or it is only an artifact due to the large errors of the data.
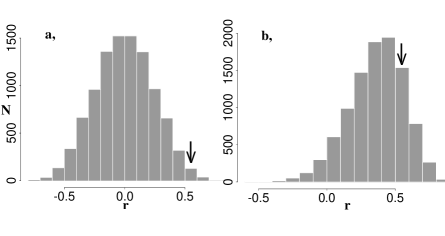
The Monte-Carlo simulation was realized as follows. Two artificial data sets were generated. First, the 0.22 and 0.13 dex standard deviations of the [Fe/H]spect and [Fe/H]phot data were supposed to arise merely from the scatters of the observations around a single metallicity value. Secondly, it was assumed that a 0.34 dex [Fe/H] range was real, and the standard deviations of the spectroscopic and photometric data were smaller, 0.18 and 0.11 dex, respectively (these values are the residual scatters of the regressions, see Fig. 2). In both cases 10 000 [Fe/H]spect and [Fe/H]phot data sets with 18 elements were generated. The histograms of the correlation coefficients () of the simulated data sets are shown in Fig. 3. While the observed correlation occurs marginally in case a), it has significant occurrence frequency in case b). We can therefore draw the conclusion that in our sample the correlation is indeed significant.
As the two metallicity determinations are completely independent, the fact that a correlation between these quantities is found points to the reality of the observed metallicity spread.
3 MV - [Fe/H] relation

The metallicity dependence of the absolute magnitudes of horizontal branch (HB) stars is well known, and is proven both from theoretical and observational points of view. Although the uniqueness, the slope and the zero point of this relation are still controversial, the reality of the detected metallicity spread can be justified by checking the connection between the measured absolute magnitudes and metallicities of the variables.
A strict connection between the luminosities and metallicities of HB stars is only valid for zero age HB (ZAHB) stars, as the luminosity of stars evolving off the ZAHB sequence increases, and this results a true internal scatter of any measured MV - [Fe/H] plot. The lower boundary of these plots have to follow the MV - [Fe/H] relation valid for ZAHB stars within the limits of the observational uncertainties.
It is stressed that the brightness of the stars has no influence on either of the [Fe/H] determinations, which rules out any a priori connection between the values. If the metallicity spread of the variables is real, than the faintest magnitudes at the different metallicities have to follow the global trend valid for ZAHB stars.
In Fig. 4 the absolute magnitudes of the RRab sample are plotted versus their spectroscopic and photometric metallicities. For the [Fe/H]phot values, the faintest stars at different metallicities follow the trend predicted by ZAHB models closely. Selecting ZAHB stars from the photometric sample by taking into account only the two faintest stars of each 0.1 dex [Fe/H] bins a correlation with 0.84 correlation coefficient and a 0.20 slope can be yield. This slope agrees extremely well with the model predictions which typically yield slopes within the 0.18-0.26 range.
The less convincing result for the spectroscopic metallicities is possibly due to the larger errors in the spectroscopic data.
This result provides further evidence that a metallicity spread of about dex of the M3 RRab stars has been in fact detected.
4 Conclusion
The statistically significant correlation between the spectroscopic and photometric metallicities of the RRab variables in M3, which have , and 0.4 dex ranges, respectively, leads to the conclusion that a true spread in the metallicities of the variables exists. This is in contrast with the strictly homogeneous iron content of the cluster red giants, though, it is also worth noting that in an early study CaI overabundance of about 0.6 dex of a cluster giant (vZ1397) was found (Cohen, 1978). This result has been neither confirmed nor rejected still today. Although some systematic difference between the metallicity scales of the red giants and the variables may exist, the comparison of the observed metallicities indicates that the variables show a metallicity range spanning to about dex more metal rich values.
Spectroscopic observations and chemical composition determinations of cluster variables, apart from some S measurements showing large scatter most probably due to observational errors, exist only of two clusters, Cen and M3. In Cen as the iron abundances of the red giants have larger than 1.0 dex range, the result that the RR Lyrae metallicities are not homogeneous either is not surprising. It is important to repeat, however, that no spectroscopic observations of any other globular cluster variables exist. The photometric metallicities as compiled in Kovács & Walker (2001) show unaccountable large scatter in many clusters where no metallicity spread of red giants is observed. This warns that a similar result, an observable metallicity spread of the variables might possibly occur in other clusters as well.
| N | N | |||||
|---|---|---|---|---|---|---|
| 0.23 | 3 | 0.01 | 2 | |||
| 0.18 | 8 | 0.14 | 5 | |||
| 0.22 | 20 | 0.13 | 14 | |||
| all | 0.22 | 28 | 0.14 | 19 |
Corwin & Carney (2001) have found that there are 12 RR Lyrae stars in the inner 81” region lying mag below the ZAHB. They excluded the possibility that these stars were too faint because of photometric inaccuracies, however, they could not give any plausible reason for their low luminosities. As shown in Fig. 4 metallicity effect may partly explain the faintness of these stars. The variables discussed in the present paper although do not show clear evidence of correlation between their metallicities and radial distances from the cluster center, the innermost stars have systematically larger metallicities than the outer variables as is shown in Table 3.
Radial differences of the HB type and of the frequency of blue straggler stars (BSS) have been also detected in M3, namely the horizontal branch of the inner region is bluer and its BSS population is more numerous (Catelan et al., 2001; Ferraro et al., 1997). Though these phenomena still lack explanation, all of them indicate that there is a dynamical segregation within the cluster. Fitting the luminosity function of M3, Rood et al. (1999) have also found that the lower mass stars (; stars below the turnoff point) do not have a uniform radial distribution as well. If the stellar composition, and central density of the stars nearer to the cluster’s center are in some degree different, this might explain our finding, supposing that all the spectroscopically measured cluster red giants with homogeneous metallicities belong to the outskirt of the cluster.
If the iron content is indeed not homogeneous in HB stars, its explanation could probably be found in the early star formation and chemical evolution history of the system. Recent investigations indicate that self-pollution could have been efficient during the first some hundred million years of the cluster lifetime, just before its first crossing of the galactic plane, which removed all the intracluster gas from the cluster. As a manifestation of self-pollution, both the then existing stars accreted processed material, and the composition of the intracluster gas which formed to stars later, was altered (Thoul et al., 2002; D’Antona et al., 2002). Models show that in M3, of the mass of a 1 star may originate from the mass loss of the first generation, large mass, evolved stars, and not from the uncontaminated protocluster gas according to the accretion scenario (Thoul et al., 2002). Shustov & Wiebe (2000) modeled supernova explosions in globular clusters, and concluded that self-pollution via SN ejetion could also happen in globular clusters, that might be a clue to explain any detected metallicity spread. They also argue that SN self-pollution results in smaller scatter of the observed iron abundances than in any of the lighter elements. This helps to interpret why [Fe/H] values seem to be homogeneous in most of the globular clusters.
The question why [Fe/H] dispersion only of RR Lyrae stars is detected, while red giants seem to be uniform in their iron content is difficult to answer on the bases of the presently available observational data. Because of the small sample size and the large uncertainties especially in the spectroscopic data of RR Lyrae stars, good quality detailed spectroscopic measurements of a much larger RR Lyrae sample is needed to confirm and to find the correct interpretation of the suggested metallicity dispersion of RR Lyrae stars in M3. Similar studies of other globular clusters are also encouraged.
Acknowledgements.
This research has made use of the SIMBAD database, operated at CDS Strasbourg, France. This work has been supported by OTKA grant T30954.References
- Bakos & Jurcsik (2000) Bakos, G., and Jurcsik, J. 2000, ASPCS Vol. 203, 255
- Benkő et al. (2003) Benkő, J. et al. 2003, in preparation
- Bell & Dickens (1980) Bell, R. A., and Dickens, R. J. 1980, ApJ, 242, 657
- Bernard (1982) Bernard, A. 1982, PASP, 94, 700
- Caloi et al. (1997) Caloi, V, D’Antona, F., and Mazzitelli, I. 1997, A&A, 320, 823
- Carretta et al. (1998) Carretta, E., Cacciari, C., Ferraro, F. R., Fusi Pecci, F., and Tessicini, G. 1998, MNRAS, 298, 1005
- Catelan et al. (2001) Catelan, M., Ferraro, E. R., and Rood, R. T. 2001, ApJ, 560, 970
- Cavallo & Nagar (2000) Cavallo, R. M., and Nagar, N. M. 2000, AJ, 120, 1364
- Cohen (1978) Cohen, J. 1978, ApJ, 223, 487
- Corwin & Carney (2001) Corwin, T. M., and Carney, B. W. 2001, AJ, 122, 3183
- D’Antona et al. (2002) D’Antona, F., Caloi, V., Montalbán, J., Ventura, P., and Gratton, R. 2002, A&A, 395, 69
- Ferraro et al. (1997) Ferraro, F. R., Paltrinieri, B., Fusi Pecci, F., Cacciari, C., Dorman, B., Rood, R. T., Buonanno, R., Corsi, C.E., Burgarella, D., and Laget, M. 1997, A&A, 324, 915
- Harris (1996) Harris, W. E. 1996, AJ, 112, 1487, http://physun.physics.mcmaster.ca/Globular.html
- Jurcsik (1998) Jurcsik, J. 1998, A&A, 333, 571
- Jurcsik & Kovács (1996) Jurcsik, J., and Kovács, G. 1996, A&A, 312, 111
- Kaluzny (1998) Kaluzny, J., Hilditch, R. W., Clement, C., and Rucinski, S. M. 1998, MNRAS, 296, 347
- King et al. (1998) King, J. R., Stephens, A., Boesgaard, A. M., and Deliyannis, C. 1998, AJ, 115, 666
- Kovács & Walker (2001) Kovács, G., and Walker, A. 2001, A&A, 374, 264
- Kraft et al. (1992) Kraft, R. P., Sneden, C., Langer, G. E., and Prosser, C. 1992, AJ, 104, 645
- Kraft & Ivans (2002) Kraft, R. P., and Ivans, I. I. 2003, PASP, 115,…
- Lambert et al. (1996) Lambert, D. L., Heath, J. E., Lemke, M., and Drake, J. 1996, ApJS, 103, 183
- Langer et al. (1998) Langer, G. E., Fischer, D., Sneden, C., and Bolte, M. 1998, AJ, 115, 685
- Layden (1994) Layden, A. 1994, AJ, 108, 1016
- Rood et al. (1999) Rood, R. T., Carretta, E., Paltrinieri, B., Ferraro, F.R., Fusi Pecci, F., Dorman, B., Chieffi, A., Straniero, O., and Buonanno, R. 1999, ApJ, 523, 752
- Sandstrom et al. (2001) Sandstrom, K., Pilachowski, C. A., and Saha, A. 2001, AJ, 122, 3212
- Shustov & Wiebe (2000) Shustov, B. M., and Wiebe, D. S. 2000, MNRAS, 319, 1047
- Thévenin & Idiart (1999) Thévenin, F., and Iidart, T. P. 1999, ApJ, 521, 753
- Thoul et al. (2002) Thoul, A. Jorissen, A., Goriely, S., Jehin, E., Magain, P., Noels, A., and Parmentier, G. 2002, A&A, 383, 491