email: elvis@cfa.harvard.edu, fiore@quasar.mporzio.astro.it
A High Resolution Intergalactic Explorer
for the Soft
X-ray/FUV
Abstract
We present a mission concept for high resolution X-ray spectroscopy with a resolving power, 6000, (c.f. 1000 for Chandra, XMM-Newton). This resolution is physics-driven, since it allows the thermal widths of coronal X-ray lines to be measured, and astrophysics-driven, since 50 km s-1 resolves internal galaxy motions, and galaxy motions within larger structures. Such a mission could be small and have a rapid response allowing us to ‘X-ray the Universe’ using the afterglows of Gamma-ray Bursts (GRBs) as strong background sources of X-rays, and so illuminate the ‘Cosmic Web’. The Cosmic Web is predicted to contain most of the normal matter (baryons) in the nearby Universe.
keywords:
Space Missions, X-ray, Ultraviolet, Spectroscopy1 INTRODUCTION
We present a mission concept for high resolution X-ray spectroscopy at E1 keV with a resolving power, 6000, (c.f. 1000 for Chandra, XMM-Newton). This resolution is physics-driven, since it allows the thermal widths of coronal X-ray lines to be measured, and astrophysics-driven, since 50 km s-1 resolves internal galaxy motions, and galaxy motions within larger structures. We can then do galaxy dynamics in X-rays.
As Chandra and XMM have made clear the region of the spectrum below 1 keV is where most of the X-ray atomic transitions lie, and is comparable with the optical and ultraviolet bands in this richness of features. However, this band lags behind optical-UV spectroscopy. High resolution spectroscopy of this soft X-ray band is the only part of ‘discovery space’ for which present or future X-ray missions are not pushing for order of magnitude improvements. Inoue (2001) showed how future missions compare to present and past ones in term of throughput, energy band, and angular resolution. We have now Chandra that beats ground-based optical telescopes in terms of angular resolution (though not HST), XMM-Newton and then Con-X and XEUS, will have large throughput. Con-X, and other smaller missions, will image above 10 keV for the first time. Calorimeters will give high resolution in the iron K band (the ASTRO-E calorimeter has a resolution of 6 eV, the Con-X calorimeter could reach 2-3 eV). What is really missing is high resolution (E/5000) at low energy.
Because low energy X-rays only require short focal lengths, such a mission could be compact and rapidly repointed. This would allow us to ‘X-ray the Universe’ using the afterglows of Gamma-ray Bursts (GRBs) as strong background sources of X-rays, and so illuminate the ‘Cosmic Web’. The Cosmic Web is predicted to contain most of the normal matter (baryons) in the nearby Universe. A recent flurry of papers has shown that this warm-hot intergalactic medium (WHIM) does exist, both locally (Nicastro et al. 2002a b, Sembach et al. 2002) and at moderate redshift (Zappacosta et al. 2002). The importance of this topic has led to the approval of SPIDR, a new MIDEX mission. SPIDR will map the Cosmic Web of warm intergalactic gas in the Far-UV OVI emission line at 1052Å, and so will provide strong morphological tests of cosmic structure formation.
We see a compelling need to go to the next level of the physics of this major, but elusive, component of our environment: how is the plasma moving? How is it ionized? Which type of supernova enriched it with heavy elements? What is the history of the formation of the Cosmic Web, and how does this tie in with the destruction of the ‘Lyman-alpha forest’ of cooler material? High resolution soft X-ray and far-UV spectra are the only means of studying the detailed physics of the warm gas of the Cosmic Web.
Gamma-ray Bursts are excellent, though fleeting, background beacons for these investigations: GRBs explode in galaxies spanning just the right redshift range, 1z2. Despite their location in the distant universe, the X-ray afterglows of GRBs shine as brightly as the brightest sources in our own local Milky Way for a short time. By rapidly slewing a high resolution spectrometer into position to record the soft X-ray and FUV spectrum of a GRB afterglow, we can gather 100 times more photons than missions that point at the only steady distant sources, high redshift quasars. This will let us study many absorption lines and resolve their profiles, so telling us about the physics of the gas in the Cosmic Web.
The GRB soft X-ray/FUV spectra will carry the signatures of all material along the line of sight to the GRB, separated out cleanly by redshift. This will include matter in the GRB host galaxies, telling us the composition of galaxies during the ‘Age of Star Formation’ (12, Madau et al. 1996) and so testing theories of the star formation history of the universe. The intimate environs of a gamma-ray burst will also imprint their signature on the spectra, testing models for these most powerful explosions in the Universe.
This mission is the complement of the MAP and Planck missions: they put constraints on one end of the process of cosmic structure formation; this mission on the other.
2 The Mission
This mission concept is the result of several discussions with a large group of scientists during two meetings at Johns Hopkins University 111Contributions by: Andy Szentgyorgyi, Fabrizio Nicastro, Rob Cameron (SAO), Giovanni Pareschi, Oberto Citterio (OABrera), W. Cash (U.Colorado), L. Stella (OAR), C. Norman, J. Rhoads, J. Krolik, S. Savaglio, K. Weaver, T. Yaqoob, T. Heckman, K. Sembach, D. Bowen, J. Kruk, M.B. Kaiser, S. McCandless (JHU), A. Fruchter (STScI), S. Mathur (OSU), J. Greiner, G. Hasinger (MPE). Many thanks to L. van Speybroeck (SAO), L. Angelini (GSFC), and P. Miotto (Draper Lab.) . The heart of the mission is a high resolution soft X-ray spectrometer, with 6 times the spectral resolution of Chandra. A slitless FUV spectrograph will add the OVI line to the X-ray OVII and OVII lines, allowing us to distinguish photoionization from collisional ionization. A GRB detector will trigger the spacecraft to slew the X-ray spectrometer onto the GRB afterglow within a few minutes. (10 minutes requirement, 1 minute goal.)
The soft X-ray spectrometer will consist of: an X-ray mirror (with a 5 arcsec HPD, image size), optimized for low energy performance (1 keV), feeding photons to diffraction gratings deployed in an out-of-plane reflection configuration. The gratings disperse the photons onto an array of CCD detectors, which are also optimized for low energies. The spectral resolution achieved will be =6000 (50 km s-1) over the energy range 0.1–1 keV, with a collecting area of 1000 cm-2 - 2000 cm-2. Replicated X-ray optics developed for Con-X will be the basis of this design. The short focal length (2.5-3 meters) of the X-ray telescope mimimizes the moment-of-inertia of the satellite, allowing faster slews.
To achieve the rapid response necessary to achieve these mission goals, the satellite will include a compact 2-stage GRB detection and localization system based on the highly successful Beppo-SAX design: a CsI dodecahedron to localize GRB to 1 degree, and a small X-ray coded aperture telescope with a 10-20 degree field of view that can localize bursts to an arcminute. This is sufficient to put the GRB afterglow into the (slitless) spectrometer apertures. The X-ray CCDs of the coded aperture telescope (e.g. an XMM EPIC-pn wafer) will record good quality X-ray spectra of the afterglows, a bonus for the mission science.
3 SCIENCE DRIVERS
3.1 The ‘Missing Baryons’ Problem
It is well known that at high redshifts (z2) most of the baryons in the Universe lie in ‘Lyman-alpha forest clouds’, at temperatures of K or less, and with densities only slightly above the average density of the Universe (overdensities of only 1-10). But, in the second half of cosmic time, (i.e. for the 7 Gyr at z1) the number of baryons in Lyman-alpha clouds decreases rapidly, while the number of baryons in galaxies and clusters of galaxies does not increase by the same factor. Therefore one of the major problems of the modern cosmology is: “Where do most baryons go at low redshift?”
The leading solution to the ‘missing baryons’ problem is the concept of a ‘Warm-Hot Intergalactic Medium’ (WHIM). This concept has been developed in the last few years by Cen & Ostriker (1999), and by other groups, (see Davé et al. 2000 and references therein): hydrodynamical simulations of the evolution of structures in the Universe showed, surprisingly, that 30-40% of the baryons at z1 are in a warm ( K) phase at overdensities between 10 and 200. Most (70%) of these baryons should be at only a weak overdensity 60, and so are not virialized and are unbound. The resulting X-ray ‘forest’ of absorption lines will show us the structure of the Universe developing over the last 7 Gyr (Hellsten et al. 1998). Since this structure depends on what physics causes the primordial fluctuations seen in the Cosmic Microwave Background (CMB) to grow into the galaxies and clusters of galaxies we see today, the X-ray forest will constrain that fundamental physics.
A Chandra spectrum was recently used to discover X-ray absorption at zero redshift due to the WHIM (Nicastro et al., 2002a), following years of frustrating upper limits (Aldcroft et al. 1994). The WHIM thus does exist, at least locally and along on a single line of sight, and with the predicted overdensity. The bare detection of collisional OVI, OVII and OVIII lines is a prime scientific result, strongly corroborating the results of a decade of forefront cosmological modeling. Most likely the IGM component found by Nicastro et al. is a cut through the ‘local filament’ associated with the Local Group of glaxies (which is dominated by the Milky Way and Andromeda spirals.)
Examined in this light FUSE detections of zero redshift absorption toward many AGN implies that we are embedded in a WHIM filament of the Cosmic Web. Nicastro et al. (2002b, see also Sembach et al. 2002) demonstrate that these OVI absorbers are at rest in the frame of our Local Group of galaxies, but not in any Milky Way frame of reference. This clinches the extragalactic location of this highly ionized gas. Moreover, the mass of gas implied is enough to bind the Local Group gravitationally, which begins to put interesting limits on the amount of ‘dark matter’ in our vicinity.

To understand the structure of the warm IGM making up the Cosmic Web will require many more directions to be probed to distances well beyond our parochial group of galaxies. Observing out to z=2 along many lines of sight will let us see the scales on which the Web has formed and will show us how the Web has grown and been filled with X-ray hot gas, gradually replacing the cooler ‘Lyman-alpha forest’ gas. As we show later, quasars are a poor choice of background source; GRBs are far better.
The breakthrough science of the Cosmic Web will come from measuring the widths of the oxygen lines. This will allow a series of new tests of cosmological models For example, hydrodynamical simulations suggest that the IGM matter is heated to K by shocks during the collapse of density perturbations. If this is the case one would expect that the turbulent velocities in the shocked gas of the same order of magnitude as its sound speed, i.e. of the order of 100-200 km/s. This is a several times the thermal velocity of the heavier oxygen atoms (at K, the temperature at which the baryon density peaks in hydrodynamical simulations, Davé et al. 2000). Detecting line widths of 100-200 km s-1 would point toward shocks as main source of large scale heating of the gas. This would contrast with competing sources such as supernova heating, and so determine the heating mechanism. GRB soft X-ray/FUV afterglow spectroscopy will allow these tests to be carried out.

3.2 Galaxies in the Age of Star Formation
Prompt observations of GRB afterglows offer a new and distinctive path for the study of the matter in the immediate surroundings of the GRB (r100 pc) and in the GRB host galaxy (Fiore et al. 2000). This is the second main science driver for this mission. Around is the age of star formation (Madau et al. 1998), and many GRBs are found at such redshifts.
As a result GRBs can be a powerful tool to determine the history of the metal enrichment in galaxies in the Universe (Fiore 2000, 2001, Savaglio, Fall & Fiore 2002), which can then be compared with enrichment predictions of theoretical models (e.g. Cen & Ostriker 1999), to pin down their several, now unconstrained, assumptions.
GRB host galaxies appear typical of normal star-forming field galaxies at the same large redshifts (Bloom et al. 2001, Djorgovski et al. 2001). Moreover GRBs occur well within the main body of their host galaxies, not in the outer haloes. Best of all, since GRB host galaxies are -ray and X-ray selected they will be virtually unbiased against dusty environments, a serious limitation of all present studies of high z galaxies.
Optical spectra demonstrate clearly that GRB observations can be used to probe the ISM of the GRB host galaxy. Using a GRB afterglow spectrum, Castro et al. (2001) discovered two absorption systems in the GRB host galaxy separated by just km s-1. But optical observations are unable to investigate the abundant hot material expected. Neither can normal ultraviolet, or infrared, telescopes detect this material. Only the far-UV and soft X-ray bands contain the necessary spectral signatures.
4 Spectroscopy Goals
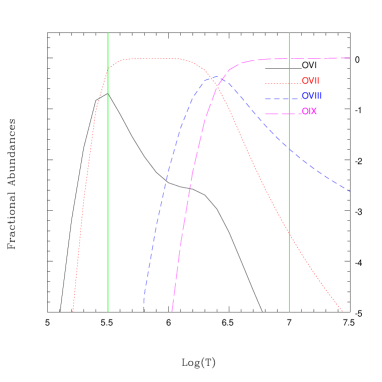
The soft X-ray band will measure OVII and OVIII, while the FUV band will measure OVI. The ratios of these lines will determine the temperature of the WHIM for each line of sight (figure 2). Crucially, the two line ratios come from 3 ions of the same atom. If the ratios disagree on the temperature, then we will know that we are not dealing with a simple collisional plasma (Nicastro et al. 2002a).
The soft X-ray spectra will also contain NeIX, while the FUV contains iron, magnesium, silicon, silicium, carbon and zinc and hydrogen Lyman- lines. With the oxygen ratios distinguishing unambiguously between photoionization and collisional ionization, these other lines will give us abundances and enrichment histories. This will tell us the history of supernovae, and of the recycling of matter from galaxies and quasars. Some elements condense onto dust grains more easily than others (Pettini et al. 1997, 1999), so the dust content of the universe will also be measured. Dust is a catalyst for further star formation, and so the WHIM dust content should link with the star formation history of the Universe. Dust dims light from more distant objects, and allowing for this (probably small) effect might change the cosmological parameters derived from SN1a light curves.
5 Why GRBs are the Best Path
The spectroscopic goals above are challenging. They require a large number of photons in each spectrum. We can use the example of the Chandra LETGS/HRC PKS 2155-305 spectrum of Nicastro et al. (2002a) to determine how many photons are needed to obtain sufficient signal-to-noise.
The Chandra LETGS/HRC PKS 2155-305 spectrum has between 600 and 1200 counts per resolution element. The most intense lines detected in PKS 2155-304 have an equivalent width, EW=10.4 mA. The resolution element with the line centroid contains = 511 counts, and the continuum around the line has instead = 692 counts/res.element. The difference = [ - ] = 181 counts/res.element. To detect such a line at we need at least such that . depends both on the EW of the line and on the resolution. For an instrument with a resolving power , is reduces so is bigger for a given EW, and a detection at a given is easier to obtain (figure 3).

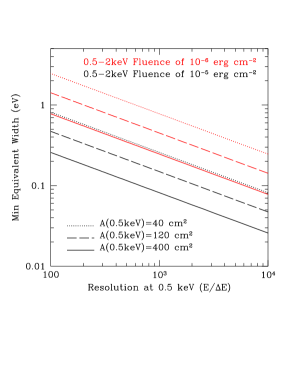
To resolve a line, the above computation has to be scaled for the line profile in the contiguous resolution elements, with 3-5 elements being minimal. For a gaussian with a FWHM of 100 km s-1, at 21.6Å and an instrument with a resolution of 6000 at the same wavelength, the line would be resolved into roughly 3-5 resolution elements. For a gaussian the 2 resolution elements either side of the one containing the centroid would each contain roughly 15% of the total number of counts. This is about 20% of the number of counts contained in the centroid-resolution element. So, .
BeppoSAX results showed that at least 7 out of 11 SAX GRB with fluence (i.e. integrated flux) 110 have bright X-ray and optical afterglows (Fiore 2001). Hence these bursts will provide the photons that will yield the high quality spectra needed to carry out the science. Because GRB X-ray afterglows can be so bright, prompt GRB observations (i.e. within one or a few minutes - a Swift-like response) provide a huge advantage compared to bright quasar observations, by providing large fluence of X-ray photons (Fiore et al. 2000). For example: a 40ks (1/2 day) observation of a GRB with the same peak X-ray flux as GRB990123 or GRB010222 (In’t Zand et al. 2001, Jha et al. 2001, Masetti et al. 2001) that begins 1 minute after the burst onset provides a fluence (10-5 erg cm-2, 0.5-2 keV band) equivalent to a one million second (about 2 weeks) long observation of a bright ( erg cm-2 s-1, or 0.5 mCrab) z=1 AGN. At z0.2 there are only a dozen AGNs in the sky as bright as this, while there are several such GRB each year.
Figure 4 gives the number of GRB per year (at high galactic latitude) which give a 0.5-2 keV fluence (in a 40 ks observation) of and erg cm-2, as a function of the delay time between the GRB and the start of the observations. The GRB keV logN-logF of figure 4 (using a slope of -1.3) can give the total X-ray fluence from bright bursts ( erg cm-2) per year. If 40% of the high Galactic latitude GRB are included (since about half will be occulted, or caught too close before occultation, by the Earth for a LEO satellite) with a delay of one minute, this gives a total fluence of about erg cm-2, equivalent to a 4 million seconds observation of a erg cm-2 s-1 AGN. A HEO satellite would record double this total fluence. If the delay time rises to 10 min, then the total fluence would be reduced by two thirds.

In the optical and UV bands observations of GRB afterglows are probably less efficient with respect to quasars for the study of the IGM, since quasars have a much bluer spectrum than GRB optical afterglows. There are about 100 quasars with UV flux erg cm-2 s-1Hz-1, accessible to FUSE, while to obtain spectra of good quality (S/N20 per resolution element) of a GRB afterglow needs an instrument with an effective area about 10 times that of FUSE. However these 100 quasars would need a much larger X-ray telescope to give the OVII and OVIII lines. Only GRBs give both easily.
There will be about 20 GRBs/year with . These bursts provide the driving science of the mission - velocity resolved absorption lines of the WHIM. They will determine the state of the X-ray forest lines. In addition to the primary GRBs there will be 80/year that are faint (. For these we will detect strong lines at redshifts inaccessible to SPIDR. This will give us a robust statistical view of the formation of the Cosmic Web with time. About once per year a bright () GRB will be caught, allowing resolved velocity structure to be seen even in faint lines, which will give much tighter constraints on nucleosynthesis in the Age of Star Formation.
The X-ray coded aperture GRB location instrument will collect a 5000 count CCD spectrum for a GRB of medium fluence. This is sufficient to detect an Fe-K line at the GRB redshift, freeing us of the need for optical ground-based follow-up (although this would still be valuable). Changes in Fe-K strength with time seem to be strong (Reeves et al. 2002), and can be studied with the mission.
The combined telescopes make up a powerful instrument package that will be able to study the IGM on a whole range of scales. Since we will follow about 120 GRBs per year, and each one will be detectable for no more than one day, the satellite will spend a sizeable fraction of the time, 240 days/year, observing the IGM on more local objects:
z0.2, Filaments between Nearby Clusters: Long observations of the 10-20 brightest AGN in the sky with z0.2. Each of these observations will take about 1 month, (for 50% efficiency in LEO), and so will fill a 2-year secondary science mission. Triggers from X-ray all sky monitors may allow us to catch some of these AGN in outburst, and so with fluxes 5-10 times normal. Most AGN have ‘warm absorbers’ similar to the IGM, but denser. They form a fast wind emanating from the AGN, and their large outflow velocities can be confused with intervening matter. Fortunately during this month of monitoring most AGN vary significantly, which will cause changes in any absorbing material close to the AGN, distinguishing them clearly from the IGM. These variations will determine the density of AGN winds, a valuable byproduct of the mission.
Damped Lyman- Absorbers (DLAs): DLAs may be protogalaxies (Prochaska & Wolfe 1999). Soft X-ray/FUV spectra will determine the abundances and enrichment processes of DLAs (Bechtold et al. 2001).
The Local Group Filament: Observations of X-ray sources in the Local Group (the Magellanic Clouds, M31, M81/M82, M33) and of the Milky Way halo via globular cluster X-ray binaries, will separate out the warm gas in our galaxy halo from gas in the IGM filament in which our galaxy and the Local Group of galaxies lie.
6 INSTRUMENTATION
6.1 Energy/Wavelength Coverage
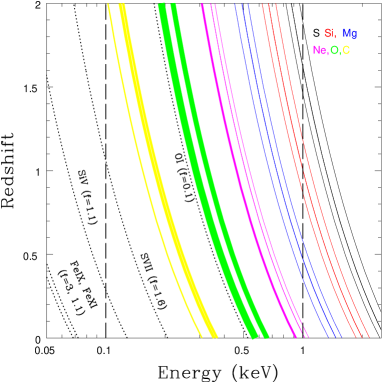
All the interesting X-ray spectral features are at E2 keV, even in the rest frame, and for z1 they all lie at E1 keV (figure 5). Hence the primary science goals of the mission require that the X-ray spectra should reach to as low an X-ray energy as possible (0.1 keV), but need not reach to higher energies than 1-2 keV.
The FUV allows the study of the OVI 1054Å and Ly1215Å lines. The OUV band (1500-4000Å) is needed if we are to study lines of several elements including: carbon, silicon, iron and zinc.
6.2 Spectral Resolution
The resolution of a spectrometer is normally measured in terms of resolving power, which is the wavelength divided by the FWHM of the instrumental line width: =.
A resolving power of 400 was just sufficient to detect the strongest absorption lines from the WHIM (Nicastro et al. 2002a), but is not enough to pin down cosmological models from their detailed properties. A clear example of the detail lost at is given in figure 6, which compares in velocity space the absorption lines detected by FUSE and Chandra LETGS-HRS for the BL Lacertae object PKS2155-301 (Nicastro et al. 2002a). At the FUSE resolution the OVI system is resolved in at least two components, one narrow and one broad. Although this complex system is detected with a very high significance in the soft X-ray spectrum the 10 times lower resolution does not resolve the components. A resolution of 6000 (=50 km s-1) is needed to resolve the thermal oxygen lines (for T K, see also Elvis 2001).
The FUV allows the study of the OVI 1054Å and Ly1215Å lines. Here a resolution of =10,000, comparable to FUSE, would allow the detection and the characterization of faint oxygen lines. A resolution of =3000 is barely enough for the detection of strong OVI lines, but would allow detection of Ly absorption lines.

6.3 Rapid GRB Trigger and Localization
To obtain spectra of GRB afterglows, first one must find them, quickly. Moreover there are only about 100 bright GRBs at high Galactic latitude per year, so few can be missed. Hence the initial GRB trigger detector needs the largest possible field of view: 2-4 steradians; yet to use the X-ray/FUV spectrometers requires a position accurate to at least an arcminute. These are hard requirements to reconcile in a single instrument. By concentrating solely on X-ray bright GRBs we can divide the problem into two parts: (1) triggering on a GRB detection, and (2) localizing the GRB accurately enough for the soft X-ray/FUV spectrometers. Moreover, since this is a soft X-ray spectroscopy mission the GRB localization instrument only needs to operate in the typical 0.5-10 keV band of CCD detectors. The high energy response of BAT on Swift is not needed. In this way the GRB detection and localization system can be far more compact and light weight than that of Swift. (Swift will pursue all GRBs.) Since Swift can slew 1 radian in a minute, our much smaller and lower moment-of-inertia satellite should have no problem slewing 2 radians in a similar time.
(1) Trigger: A GRB monitor (GRBM) similar to (but less sensitive and times smaller than) BATSE, and capable of providing positions with accuracies of 1-10 degrees. The CsI GRB alert monitor on Beppo-SAX provides a good model. The spacecraft autonomously decides whether each burst detected satisfies the trigger criteria for a re-pointing of the spacecraft, and then slews to the rough GRB position.
(2) Localization: An X-ray Wide Field Coded Mask (WFCM) with a CCD detector (e.g. an XMM EPIC-pn wafer) provides a fine position. A field of view 2-3 times the size of the GRBM positional error regions ( or degrees) is sufficient to safely cover the error box provided by the GRBM, which the spacecraft will have placed near the center of the WFCM field of view. This relatively small field of view (c.f. BAT on Swift) allows the use of pixels small enough to provide positions accurate to within 1 arcmin. The WFCM provides the improved GRB position to the spacecraft to perform a fine maneuver to put the high resolution spectrometers onto the target GRB. The WFCM needs sufficient signal to locate the burst in a few seconds, else valuable fluence is lost. The minimum area needed to obtain such a position in a few seconds is somewhat smaller than that of an EPIC-pn chip ( cm2). The computation of the GRB position will be greatly speeded up since there will be only a single source producing mask shadows on the detector.
6.4 X-ray Mirror Area
Our science goals show that we need to design an X-ray telescope providing an effective area of at least 1000 cm2 below 1 keV. The mirror needs a relatively sharp PSF (HPD5 arcsec) in order to produce high spectral resolution using gratings. There are reasons for optimism that 5 arcsec HPD can be obtained. Silicon carbide shells built by the Merate (Italy) group (Citterio, Pareschi and collaborators) have 11 arcsec HEW figure errors. These shells are 2mm thick, 60cm diameter, 3.5m focal length, and have a weight/effective area ratio of 0.06 kg cm-2. Mandrel quality is expected to improve (Pareschi et al. 2001), and the HEW should roughly scale linearly with the thickness down to about a HEW of 5 arcsec, where other effects start to be more important than the mirror deformations.
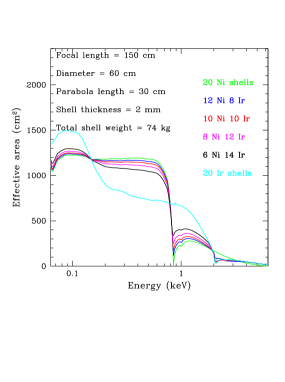
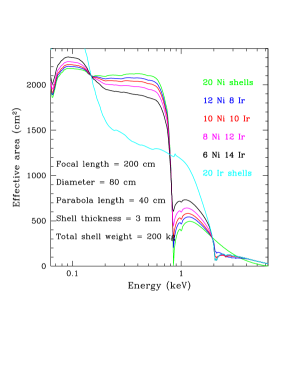
For a small mission weight is a major constraint. As a rough estimate the mirror will need a support structure of similar weight. The detector and its associated electronics will likely have a similar mass, and the total payload will likely be 50% of the total mass to orbit, the spacecraft taking the remaining fraction. The mirror should then account for about 10% of the total to-orbit mass. For a MIDEX the mass to orbit is about 1000 kg), this implies a mirror mass of 100 kg. We have explored the mirror parameter space with the mirror raytrace code kindly provided by Leon Van Speybroeck. This code was used extensively for Chandra design and development. We show here the results of three representative design options: thin vs. thick shells, short vs. long focal length, and iridium vs. nickel coating. They give a feel for the effective areas which the X-ray mirror can achieve within the parameter space. The effective area results for simulations of mirror designs assuming a ‘minimal’ mass telescope, and a ‘maximal’ mass telescope (figure 7). In both designs various combination of mirror coatings have been used, with Ni being used on the outer shells and Ir on the inner shells. Nickel provides better reflectivity below 0.8 keV, and iridium above 0.8 keV, so the mixed coating designs use iridium for the inner shells, and nickel for the outer shells.
6.5 X-ray Gratings
The high spectral resolution required by our science drivers is technically feasible. If the XMM-Newton RGS reflection grating facets were used behind the Chandra mirror the result would be (subject to better facet alignment, Elvis 2001). But is feasible in a small mission?
X-ray calorimeters have excellent quantum efficiency and are the natural spectrometer of choice at the 6.4 keV Fe-K complex. However they are not a good choice at 0.5 keV, since their resolution is fixed in eV, so degrades linearly with energy. The Con-X calorimater goal is to have =1 eV, or =500 at 0.5 keV. Gratings are a requirement for this mission.
A route to achieving with 5 arcsec HPD mirrors is offered by out-of-plane reflection gratings (ORGs, Cash 1991). ORGs are being considered to boost the resolution of the Con-X low energy spectrometers to =1000-2000. Spectral resolution improves linearly with angular resolution. So with a factor 3 better mirror, and an optimized alignment, becomes feasible. ORGs also have favorable efficiency, peaking at 10-15%. (c.f. 4% of the XMM RGS, and the 10% of the Chandra LETGS), so requiring a smaller mirror to feed them photons.
Filters are needed to eliminate stray optical light. To avoid losses at and above the 0.28 keV Carbon edge, we will use aluminum filters, which have an edge at 1.5 keV, above our primary range of interest. Similar filters have been successfully flown on other missions.
7 Figure of Merit: Comparison with other Missions
A figure of merit (FoM) for a system mirror+gratings can be given by the following formula:
| (1) |
This FoM measures the ability of various systems to detect faint absorption lines, since the minimum detectable line equivalent width, . Table 1 shows that the mission we propose represents a large gain over existing or planned missions, even for warm IGM detection. Higher resolution spectroscopy not only allows the line detection, but is essential to the study of the physics and the dynamics of the absorbing systems. No other mission can resolve the X-ray absorption lines, and so take the subject to the next level of physics and cosmology.
| Mission | Aeff(cm2) R(0.5 keV) | FoM |
|---|---|---|
| Current Missions | ||
| XMM 1 RGS | 70 300 0.1 | 2100 |
| Chandra LETGS | 100 500 0.1 | 5000 |
| Chandra MEG | 75 1200 0.1 | 9000 |
| Future Missions | ||
| ‘minimal’ mission | 1000 6000 0.1 | 600,000 |
| ‘maximal’ mission | 2000 6000 0.15 | 1,500,000 |
| Swift | 100 10 1 | 1,000 |
| Con-X 1 grating | 1250 500 0.1 | 62,500 |
| Con-X 4 gratings | 5000 500 0.1 | 250,000 |
Note: includes response time estimate of 4 hours for missions other than this, and 1 minute for this mission, assuming a power-law decay index of 1.3.
8 Conclusions
High resolution (6000) soft X-ray spectroscopy is feasible within the scope of a modest mission. This resolving power would open up new realms of physics to astronomy.
A rapid response mission to obtain high resolution soft X-ray and Far-UV spectra of gamma-ray burst afterglows is also possible. Such a mission would go well beyond current and planned missions in determining the formation and nature of the warm-hot intergalactic medium, the Cosmic Web.
9 references
Aldcroft T.L., Elvis M., McDowell J.C., and Fiore F., 1994, ApJ, 437, 584
Bechtold, J., Siemiginowska, A., Aldcroft, T., Elvis, M. & Dobrzycki, A. 2001, ApJ, 562, 133
Bloom, J.S., Kulkarni, S.R. & Djorgovski, S.G. 2001, AJ, in press, astro-ph/0010176
Cash, W. 1991, Applied Optics, 30-13, 1749
Castro, S., et al. 2001 ApJ, submitted, astro-ph/0110566
Cen, R., Ostriker, J.P. 1999a, ApJ, 514, 1
Davè, R. et al. 2001, ApJ, 552, 473
Djorgovski, S.G. et al. 2001, 562, 654
Elvis, M. 2001, proceedings of ‘New Century of X-ray Astronomy’, Yokohama, Japan, astro-ph/0106053
Fiore, F., Nicastro, F., Savaglio, S., Stella, L. & Vietri, M. 2000 ApJL, 544, L7
Fiore, F. 2001, proceedings of ‘New Century of X-ray Astronomy’, Yokohama, Japan, astro-ph/0107276
In’t Zand, J.J.M. et al. 2001, ApJ, 545, 266
Jha, S. et al. 2001, ApJL, 554, L155
Hellsten, U., Gnedin, N.Y., Miralda-Escudè, J. 1998, ApJ, 509, 56
Madau P., Pozzetti L. & Dickinson M., 1998, ApJ, 498, 106
Masetti, N. et al., 2001, A&A, 374, 382, astro-ph/0103296
Nicastro, F. et al. 2002a, ApJ, in press, astro-ph/0201058
Nicastro, F. et al. 2002b, Nature, submitted, astro-ph/0208012
Pareschi G. et al. 2001, NCXA Conf. 526.
Perna, R, & Loeb, A. 1998, ApJL, 503, L135
Pettini, M., Smith, L.J., King, D.L. & Hunstead, W. 1997, ApJ, 486, 665
Pettini, M., Ellison, S.L., Steidel, C.C. & Bowen, D.V. 1999, ApJ, 510, 576
Prochaska, J.X. & Wolfe, A.M. 1999, ApJS, 121, 369
Reeves J. et al. 2002, Nature, 416, 512
Savaglio, S., Fall, M., & Fiore, F. 2002, ApJ, submitted
Sembach K. et al. 2002, ApJS, submitted, astro-ph/0207562
Zappacosta L. et al. 2002, A&A, in press astro-ph/0208033