The First Measurement of Cassiopeia A’s Forward Shock Expansion Rate
Abstract
We have obtained a second epoch observation of the Cassiopeia A supernova remnant (SNR) with the Chandra X-ray Observatory to measure detailed X-ray proper motions for the first time. Both epoch observations are 50 ks exposures of the ACIS-S3 chip and they are separated by 2 years. Measurements of the thin X-ray continuum dominated filaments located around the edge of the remnant (that are identified with the forward shock) show expansion rates from 0.02% yr-1 to 0.33% yr-1. Many of these filaments are therefore significantly decelerated. Their median value of 0.21% yr-1 is equal to the median expansion of the bright ring (0.21% yr-1) as measured with Einstein and ROSAT. This presents a conundrum if the motion of the bright ring is indicative of the reverse shock speed. We have also re-evaluated the motion of the radio bright ring with emphasis on angle-averaged emissivity profiles. Our new measurement of the expansion of the angle-averaged radio bright ring is 0.07 0.03% yr-1, somewhat slower than the previous radio measurements of 0.11% yr-1 which were sensitive to the motions of small-scale features. We propose that the expansion of the small-scale bright ring features in the optical, X-ray, and radio do not represent the expansion of the reverse shock, but rather represent a brightness-weighted average of ejecta passing through and being decelerated by the reverse shock. The motion of the reverse shock, itself, is then represented by the motion of the angle-averaged emissivity profile of the radio bright ring.
1 Introduction
Cassiopeia A (Cas A) is the youngest SNR in the Galaxy and is located 3.4 kpc away (Reed et al., 1995). The exact age of Cas A is unknown, but recent measurements of freely expanding optical knots that lie in front of the forward shock give an age of 331 years in a.d. 2002 (Thorstensen, Fesen, & van den Bergh, 2001). Proper motion measurements made in the optical, radio, and X-rays show variations in expansion rate from 0.1 to 0.3% yr-1 ( 104 km s-1) (Thorstensen, Fesen, & van den Bergh 2001 and references therein). Radio proper motion measurements also show inward motions (Anderson & Rudnick, 1995).
The forward shock in Cas A has recently been identified in the X-rays as a thin, fragmented ring bordering the outer edge of the remnant and exhibiting continuum dominated spectra (Gotthelf et al., 2001). The bright ring, at 2/3 the radius of the forward shock, is strong in line emission and is often associated with the reverse shock. There is a paradoxical difference in expansion rates for the bright ring measured in the different wavebands of approximately 3:2:1 for the optical, X-ray, and radio respectively (Thorstensen, Fesen, & van den Bergh 2001 and references therein).
In this paper, we present the first measurement of the proper motions of the forward shock fragments in X-rays. We also present a re-evaluation of the motion of the radio bright ring in order to provide a coherent dynamical picture.
2 X-ray Observations, Analysis, and Results
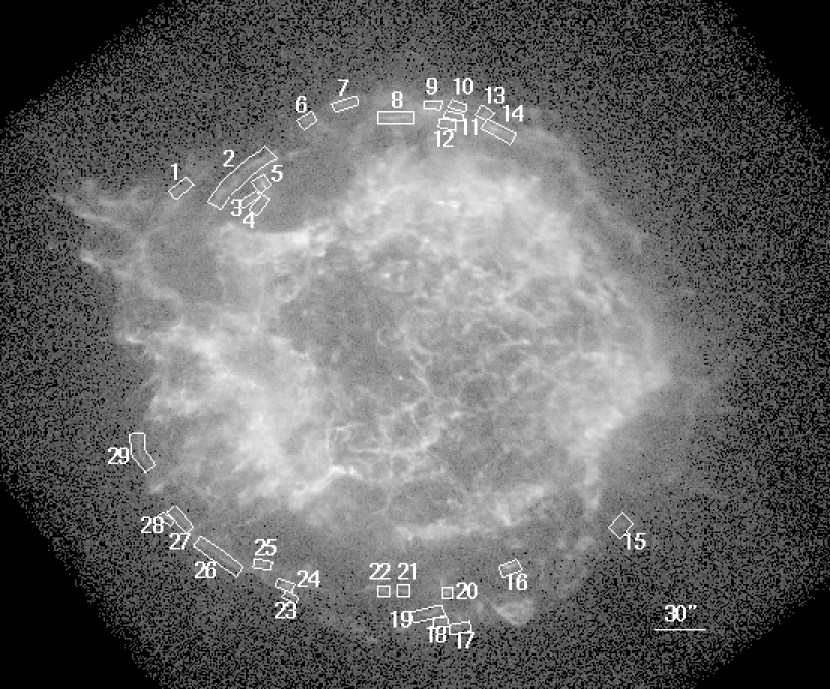
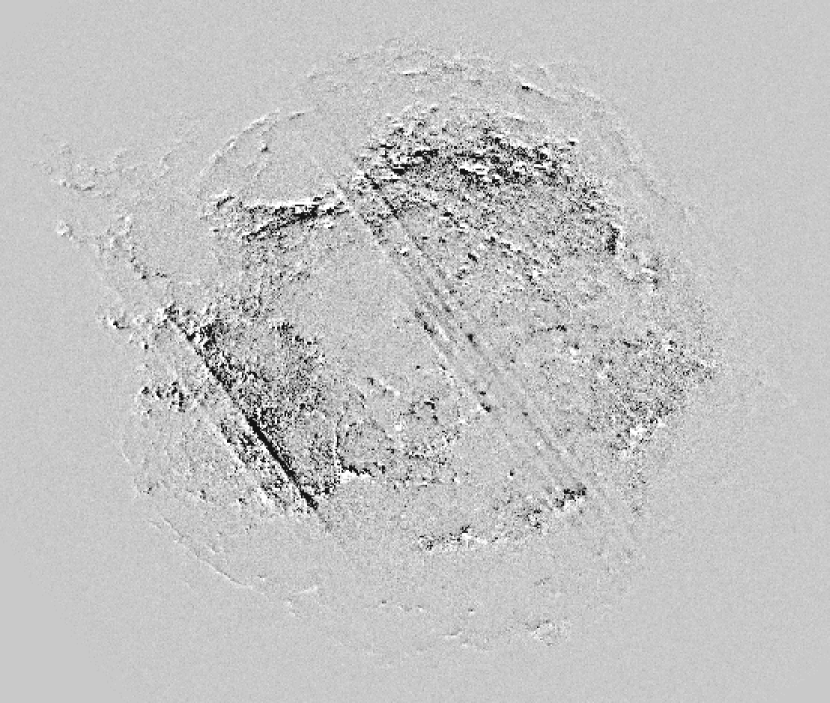
We observed Cas A for 50 ks with the ACIS-S3 chip onboard the Chandra X-ray Observatory on 2002 Feb 6. The observation parameters are listed in Table 1 and were chosen to match those of the first 50 ks exposure of the ACIS-S3 chip on 2000 Jan 30-31 (Hwang, Holt, & Petre, 2000; Gotthelf et al., 2001). We had to recalibrate the first epoch X-ray observation to make use of the newest calibration solutions (CALDB version 2.11)111http://asc.harvard.edu/ciao/threads/acisgainmap/ and to apply the new geometry solutions (geometry file telD1999-07-23geomN0004.fits)222http://asc.harvard.edu/ciao/threads/geom_par/. We used an energy range of 0.3-10 keV to make the images. No exposure correction has been applied to the images. Figure 1 is the second epoch Chandra X-ray image. The difference between the two epochs, after normalization and registration, is shown in Figure 2. The diagonal stripes on Figure 2 are due to the node boundaries and dead columns on the ACIS-S3 chip.
There are two important reasons for requiring the same observational parameters, in particular the pointing center and roll angle, for the two X-ray observations. First, the point spread function is asymmetric and a function of position on the chip. This effect would have been very difficult, if not impossible, to remove at the accuracy needed for our proper motion measurements. Second, the relative scale in the x and y directions on the chip is also uncertain, at a level of 0.07%. This could easily masquerade as a small but systematic asymmetric expansion.
A difference in plate scale between the two Chandra X-ray observations could also affect our proper motion measurements. In principle, the plate scale may change for two reasons – a change in the mirror focal length and a change in the physical chip size. There is no reason to expect a change in the physical size of the chip because the temperature was the same for both observations. If the focal length changes by a significant amount, it would first result in a deterioration of the point spread function, which is not observed (M. Markevitch private communication).
We registered the two images by aligning them on the point source. The second epoch image was first normalized to match the total counts on the first epoch image. The first epoch image was then shifted in RA and DEC with respect to the second epoch image to minimize of the difference between the two images for a 7 region around the point source. The 68% confidence limit of the distribution leads to an uncertainty of 0015 in the registration. This uncertainty translates to 0.005% yr-1 at the mean radius of the forward shock fragments (1492). Although the point source was chosen to align the images, it is in motion almost due south at a rate of 002 yr-1 (Thorstensen, Fesen, & van den Bergh, 2001) which results in a maximum error of 0.013% yr-1 at the mean radius of the forward shock fragments.
We identified the forward shock fragments as tangentially oriented filamentary features at or near the outside edge of the remnant with very little or no line emission. However, lack of line emission alone may not be an indicator of a forward shock filament as there are interior knots that exhibit little line emission as well (Hughes et al., 2000). Therefore, our sample may have some small contamination from non-forward shock filaments. In order to measure the radial motions of the forward shock fragments, we converted each X-ray epoch image to a polar coordinate image using a center 1012 east and 2633 north of the point source. This center was chosen instead of the expansion center to make the forward shock fragments as “straight” as possible in polar coordinates so that measurement errors due to complicated structures or transverse motions would be minimized. The first epoch image was shifted in radius with respect to the second epoch image and was computed from the difference between the two epoch images at each shift position for each small region outlined in Figure 1. In order to determine the errors, we made ten Monte Carlo simulations of the Poisson noise for each shock fragment and calculated the rms scatter of the minimum position. To calculate the expansion rate for each region, we used the distance from the optical expansion center at , (J2000) (Thorstensen, Fesen, & van den Bergh, 2001). We avoided those regions where the node boundary and bad column artifacts would interfere with the measurements. We also avoided radially oriented filaments because our measurement method is less sensitive to the motions of such filaments. As a result of these limitations, we have not evenly sampled all azimuth ranges.
Figure 3 is a plot of expansion rate vs. azimuth for the forward shock fragments identified in Figure 1 and listed in Table 2. The expansion rate of the X-ray forward shock fragments ranges from 0.02 to 0.33% yr-1 with a median expansion rate of 0.21% yr-1. This is equivalent to a median velocity of the forward shock fragments of 5029 km s-1 assuming a distance of 3.4 kpc to Cas A (Reed et al., 1995) and no projection effects. Based on an explosion date of a.d. 1671.3 (Thorstensen, Fesen, & van den Bergh, 2001), the median expansion parameter, m, is 0.69, where and =1 corresponds to free expansion. For reference, the free expansion rate is indicated in Figure 3. The sine wave at the bottom of Figure 3 indicates the expected corrections that should be subtracted from our measurements to correct for the point source motion as discussed above.
3 Radio Observations, Analysis, and Results
The radio data were taken at the Very Large Array333The VLA is operated by the National Radio Astronomy Observatory, which is a facility of the National Science Foundation, operated under cooperative agreement by Associated Universities, Inc.. The center date of the first epoch radio image is 1985.67 and the center date of the second epoch radio image is 1994.87. The radio data were taken in B, C, and D configuration at 6 cm. For details on the reduction of the radio data, see, for instance, Anderson et al. (1991).
We measured the motion of the bright ring using the angle-averaged brightness and emissivity radial profiles. Angle-averaging enhances the contributions of the large-scale and diffuse brightness features relative to the small-scale brightness features. In this manner, the measurements are sensitive to changes in the average position of the fine scale ensemble rather than to the average of the individual changes. We have chosen to use the radio images instead of the X-ray images to measure motions of the angle-averaged bright ring for two reasons. First, the longer time span between radio observations allows us to calculate the expansion rate more accurately. Second, unlike the X-ray bright ring, the southern portion of the radio bright ring is rather uniform over a large range in azimuth (115 to 250).
To calculate the emissivity profile, we deproject the observed line-of-sight integrated radio brightness as outlined in Gotthelf et al. (2001). The general method is to assume that the emissivity (at least for a limited range in azimuth, in this case) can be modeled as a set of thin, uniform shells. We perform an iterative decomposition of the brightness profile as a function of radius into 1 pixel (08) wide constant emissivity shells. The iteration proceeds until the residual brightness is lowered to 1% of its original peak value. We then sum all of the emissivity components at each radius to generate an average emissivity for the shell at that radius. For this analysis, we chose the azimuth range from 115 to 250, using a center of and (J2000) that best fits the radius of curvature of the radio bright ring. Over this azimuth range, the radio bright ring is rather uniform. Figure 4 shows the angle-averaged radial brightness profiles and the corresponding emissivity profiles. Also shown is the profile of the 1985 data with a 1% homologous expansion simulating the 0.11% yr-1 expansion rate measured for the bright ring (Koralesky et al., 1998) over 9.2 years.
We measured the motion of the brightness profiles by minimizing of the difference between the profiles at each epoch as a function of radial shift and amplitude scaling factor. For the emissivity profiles, we split the azimuth range into five segments and then minimized the variance of the differences between the profiles at each epoch as a function of radial shift and amplitude scaling factor for each segment. We only used the inside edge and peak of the emissivity profiles because the position of the sharp rise could be measured accurately.
The new measurements of the angle-averaged brightness and emissivity profiles of the radio bright ring show expansion rates of 0.02 0.03% yr-1 and 0.07 0.03% yr-1, respectively. We consider the emissivity profile measurements to be more reliable than the brightness profiles since they proved to be robust to changes in amplitude scale. Also, the more rapid fading of the bright ring, compared to the plateau, will bias the proper motion measurements of the brightness profile.
4 Expansion Measurement Comparisons
Table 3 is a summary of the most recent X-ray, optical, and radio expansion rate measurements. For completeness, expansion parameters, expansion timescales, and velocities (using a distance of 3.4 kpc) are also shown along with average Doppler velocities where appropriate.
Although ours is the first direct measurement of the forward shock expansion, inferred forward shock velocities have been reported. Vink et al. (1998) assumed (correctly) that the X-ray bright ring expansion rate is the same as the forward shock expansion rate and derived a velocity of 5200 km s-1. Willingale et al. (2002) use X-ray Doppler measurements to infer a forward shock velocity of 4000 km s-1 – 20% less than our measurement for the forward shock fragments.
There have been many expansion measurements of the bright ring, with most sensitive to small-scale features. The expansion rates for the different wavebands are in the approximate ratio of 3:2:1 for the optical, X-ray, and radio respectively (Thorstensen, Fesen, & van den Bergh 2001 and references therein) indicating various degrees of deceleration for the material emitting in those wavebands. Our new expansion measurement for the radio bright ring using the large-scale, diffuse emission is slower than the other measures of the bright ring. The radio bright ring small-scale expansion measurements with azimuthal variations are indicated in Figure 3 as well as the median value of the X-ray bright ring small-scale expansion measurements.
The bulk expansion of Cas A has been measured in the radio using the Bessel function nulls in the visibility plane (which is the Fourier transform of the sky brightness distribution). The reported expansions of 0.11% yr-1 (Anderson & Rudnick, 1995) and 0.22% yr-1 (Agüeros & Green, 1999) are higher than our new angle-averaged emissivity expansion rate (0.07% yr-1). The cause of this discrepancy is likely due to the more rapid fading of the bright ring compared to the plateau. The positions of the nulls are affected by the differential change in brightness causing a bias towards higher expansion rates. A direct comparison with our measurements is therefore not possible at this stage.
5 Discussion
For the purpose of this discussion, we will assume that the outer, thin X-ray continuum fragments represent the forward shock (Gotthelf et al., 2001). Then, in an effort to understand the dynamical picture presented by the expansion measurements of the X-ray and radio bright ring small-scale features and the angle-averaged radio bright ring emissivity profile, we use a dynamical simulation by Truelove & McKee (1999) that follows the forward and reverse shock evolution of nonradiative SNRs. Their simulations trace SNR evolution from the self-similar ejecta-dominated stage to the self-similar Sedov-Taylor stage with a period of non–self-similar behavior in between. They concentrate on spherically symmetric ejecta profiles described by power-law density profiles expanding into a uniform ambient medium.
For an initial first order comparison, we use their analytical solutions for evolution in a uniform ambient medium with a uniform ejecta profile (both described by a density power-law index ( for ejecta, for ambient medium) of 0) which is plotted in Figure 5. Hereafter, this simulation will be referred to as T&M(0,0). Although a higher ejecta density profile () is expected for core collapse SNe, the solutions at are very similar to the solutions during the Sedov-Taylor stage and thus do not change our conclusions. Although Truelove & McKee use dimensionless units, we have normalized the time axis in Figure 5 so that the time when (the current observed ratio (Gotthelf et al., 2001)) is the age of the remnant as determined by Thorstensen, Fesen, & van den Bergh (2001) using outlying optical knots. The radius, velocity, and expansion rate axes in Figure 5 are normalized to the median values of the forward shock fragments. Following this normalization, the predicted T&M(0,0) values for , , and reverse shock expansion rate are 1.66 pc, 1187 km s-1, and 0.074% yr-1, respectively. The T&M(0,0) predicted reverse shock expansion rate is indicated on Figure 3.
We can convert the T&M(0,0) simulation from dimensionless to physical units by assuming that the energy of the explosion is 1051 erg and the ambient density is 3.2 cm-3 (derived by Truelove & McKee from Borkowski et al. (1996)). The current age of 331 years, as defined by outlying optical knots (Thorstensen, Fesen, & van den Bergh, 2001), then results in an ejecta mass of 1.4 M☉, a forward shock radius of 2.34 pc, a forward shock velocity of 3595 km s-1, a reverse shock radius of 1.56 pc, a reverse shock velocity of 1270 km s-1, and a swept up mass of 5.9 M☉. The SNR is in the Sedov-Taylor stage and the reverse shock has penetrated into the inner, uniform core. The low ejecta mass is consistent with a massive star that has lost most of its mass through winds.
The similarity between our new angle-averaged radio bright ring expansion rate and the predicted reverse shock expansion rate of the T&M(0,0) simulation supports our identification of the reverse shock motion in Cas A. In this picture, the sharp rise of the radio emissivity profile indicates the location of the reverse shock. The reverse shock being at the location of the bright ring is not unprecedented. Hubble Space Telescope imaging of Cas A shows finger-like structures in the bright ring that are thought to be Rayleigh-Taylor instabilities created in the interface between the reverse shock and the clumped ejecta (Fesen et al., 2001). The motion of the emissivity profile would still represent the motion of the reverse shock even if there is some characteristic delay between the passage of the reverse shock and the onset of the radio emission. The previous measurements of the X-ray and radio bright ring failed to measure the reverse shock motion because they were dominated by the behavior of the small-scale knots and filaments (B. Koralesky private communication).
The similar expansion rates of the X-ray bright ring and X-ray forward shock fragments can be explained if the small-scale bright ring features represent ejecta in various stages of deceleration after passing through the reverse shock. Some ejecta may be moving faster and some ejecta may be moving slower than the forward shock. Note on Figure 5c that the fastest moving ejecta are in free expansion and thus always have a larger expansion rate than the forward shock fragments in Figure 3 regardless of their velocity. We also are in a regime where the fastest ejecta also have higher velocities than the forward shock (Figure 5b). Indeed, dense clumps of optical ejecta are observed outside of the forward shock (Fesen, 2001). Presumably, these clumps are so dense and present such a small cross-section that they are not appreciably decelerated whereas the forward shock does experience deceleration by interaction with the circumstellar medium (CSM) (Fesen, 2001).
The above explanation can be extended to the optical and radio small-scale bright rings by considering the physical properties of the emitting material. The optical fast moving knots are dense clumps of ejecta, and have experienced little deceleration by the reverse shock before they become radiative (Reed et al., 1995). The separation of the optical, X-ray, and radio emitting material by dynamical state has also been suggested by Anderson et al. (1994) and Hwang et al. (2001). The radio emission arises from synchrotron radiation which requires amplification of magnetic fields to be strong enough for the emission to be seen. This amplification results from the turbulence associated with ejecta deceleration. If significant deceleration is needed for amplification, the small-scale features in the radio would be decelerated the most. Willingale et al. (2002) use a similar argument for dense “bullets” of ejecta material that have penetrated the forward shock and have formed bow shocks in the ambient CSM. The optical emission from these bullets arises from shocks. The X-ray emission comes from material that has ablated off of the bullets, been heated by the bow shock, and drifted into the wake of the bullet. The radio emission then results when the bullets decelerate and electrons accelerated by the bow shock radiate in magnetic fields amplified by shearing between the bullets and the CSM.
Although we find that the T&M(0,0) simulation is helpful for understanding the average behavior of Cas A, there are important areas where the simulation and the observations disagree. One is the free expansion rate. Figure 5c shows that the T&M(0,0) free expansion rate is 0.41% yr-1 – 36% higher than the observed free expansion rate of 0.3% yr-1 (Thorstensen, Fesen, & van den Bergh, 2001). Another example of the limitations of the T&M(0,0) simulation is in describing the differences among the expansion rates of the forward shock fragments. In principle, the evolutionary state of any part of the SNR is determined from the local ratio of swept up mass to ejecta mass. Those regions of higher CSM density should produce more deceleration than those regions of lower CSM density, so the radius and velocity of the individual forward shock fragments should be at different stages on the evolutionary path. We plot in Figure 6 the radius and velocity measurements of the forward shock fragments, labelled by 45 azimuth sectors, along with the velocity evolution of the T&M(0,0) simulation. The individual forward shock fragments do not follow the T&M(0,0) evolutionary trend.
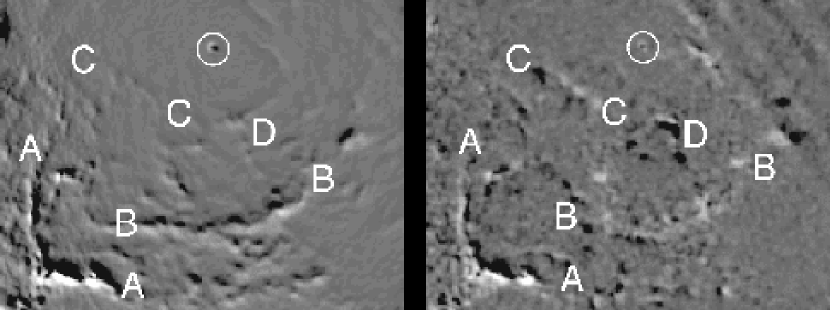
We also consider a homologous expansion model for the forward shock variations. This model has zero velocity at zero radius and the slope is determined by the median forward shock fragment velocity at the median radius. Homologous expansion also fails to describe variations in the forward shock fragments as shown in Figure 6. Homologous expansion, or any other monotonic relationship between velocity and radius, also cannot be used to describe the motions of the interior X-ray knots and filaments. The complicated interior motions are shown in Figure 7 where we compare a 0.2% homologous expansion (left) with the actual expansion (right). For reference, the point source is in the center of the circle and bright indicates the direction of motion. Both filament C and knot D are moving inwards while filament A is moving outwards. Filament B is complicated, but parts of it are also moving inward. The motions shown here and in Figure 2 cannot be accounted for with a different choice of registration between the two X-ray epochs.
We have also briefly considered two models with more realistic CSM density profiles. The first model is that of Borkowski et al. (1996) in which the bright ring represents part of the red supergiant wind compressed by the blue supergiant wind from the progenitor. In this model, the bulk of the X-ray emission in the bright ring comes from the swept up CSM shell. This model predicts that the velocity of the bright ring is slightly faster than the forward shock, which is not observed. Also, the predicted forward shock radius is only 1.07 times the radius of the bright ring compared to the actual value of 1.5 (Gotthelf et al., 2001). This model is also limited in that it does not address the differences in proper motion between the X-ray, radio, and optical features. The second model is an extension of the models of Truelove & McKee (1999) to an =9 ejecta density profile with an =2 CSM density profile (M. Laming private communication). This model predicts the correct ratio between the free expansion and forward shock expansion rates. However, the predicted reverse shock expansion rate is twice that of our measured value. Both of these models predict that the bright ring is closer to the forward shock than is currently measured and both predict that the reverse shock is interior to the bright ring. Future hydrodynamic models with realistic CSM and ejecta density profiles should include predictions for the dynamics of all of the emitting plasmas.
There are numerous indications of an asymmetric SNe and/or asymmetric expansion. Fesen (2001) found high-velocity, sulfur-rich optical ejecta distributed along the “jet” axis to the northeast and southwest of the remnant beyond the forward shock radius. Willingale et al. (2003) find that most of the X-ray emitting material is concentrated within a double cone that is oriented at from north and 50 out of the plane of the sky with the northern material further away from the observer than the southern material. Rothschild & Lingenfelter (2003) require an asymmetric explosion to explain the observed 44Ti flux. One would expect explosion or expansion asymmetries to be evident in proper motion measurements of the bright ring and forward shock. Indeed, there are significant variations in the X-ray and radio expansion rates of the bright ring (50%) as a function of azimuth (Koralesky et al., 1998; Vink et al., 1998), however they do not show the clear bipolarity seen by Fesen (2001) and Willingale et al. (2003). There are also significant variations in the expansion rates of the forward shock fragments as shown in Figure 3; however we do not have adequate azimuthal sampling to say at this time if the expansion rates along the “jet” axis are significantly different from the rest of the SNR.
6 Conclusions & Future Work
We have measured radial proper motions for the X-ray forward shock fragments in Cas A. We have also re-analyzed measurements of the radio bright ring using angle-averaged emissivity profiles to isolate and measure the motion of the reverse shock. Our conclusions are as follows:
-
1.
The thin, continuum dominated X-ray filaments associated with the forward shock show expansion rates from 0.02% yr-1 to 0.33% yr-1. Most of the X-ray forward shock fragments have been significantly decelerated from the free expansion rate of 0.3% yr-1 (Thorstensen, Fesen, & van den Bergh, 2001).
-
2.
The median expansion rate of the forward shock fragments is 0.21% yr-1 which is the same as the expansion rate measured for the small-scale X-ray features in the bright ring, twice the expansion rate of the small-scale radio features of the bright ring (Koralesky et al., 1998; Vink et al., 1998), and 2/3 the expansion rate of the small-scale optical features of the bright ring (Thorstensen, Fesen, & van den Bergh, 2001).
-
3.
The reverse shock expansion rate, measured using angle-averaged radio emissivity profiles of the bright ring, is 0.07% yr-1 – slower than the expansion rate of the small-scale radio features of the bright ring.
-
4.
There is general agreement between the global relations of the forward and reverse shocks (median velocity ratios and median radius ratios) and the hydrodynamical simulations of Truelove & McKee (1999) who model expansion of uniform ejecta into a uniform ambient medium (T&M(0,0)).
-
5.
The interpretation of the small-scale bright ring features in the optical, X-ray, and radio as ejecta in various stages of deceleration after passage through the reverse shock naturally establishes a velocity gradient between the three wavebands from the densest, fastest optical knots to the most decelerated radio features.
-
6.
The T&M(0,0) simulation does not adequately describe the observed relationship between free expansion rate and the forward shock median expansion rate. Nor does the simulation describe the observed relation between the radius and velocity of forward shock fragments at different azimuths.
-
7.
The motions of the X-ray material at the forward shock, in the bright ring, and in the interior of the remnant are complex – the interior involving inward as well as outward motions – and cannot be modeled with a homologous expansion.
-
8.
Because there was considerable mass loss from Cas A’s progenitor, models that include more realistic CSM density profiles such as that of Borkowski et al. (1996) are important for understanding the dynamics of the SNR.
References
- Agüeros & Green (1999) Agüeros, M. A. & Green, D. A. 1999, MNRAS, 305, 957
- Anderson et al. (1994) Anderson, M., Jones, T. W., Rudnick, L., Tregillis, I. L., & Kang, H. 1994, ApJ, 421, L31
- Anderson & Rudnick (1995) Anderson, M. & Rudnick, L. 1995, ApJ, 441, 307
- Anderson et al. (1991) Anderson, M., Rudnick, L., Leppik, P., Perley, R., & Braun, R. 1991, ApJ, 373, 146
- Borkowski et al. (1996) Borkowski, K. J., Szymkowiak, A. E., Blondin, J. M., & Sarazin, C. L. 1996, ApJ, 466, 866
- Fesen (2001) Fesen, R. A. 2001, ApJS, 133, 161
- Fesen et al. (2001) Fesen, R. A., Morse, J. A., Chevalier, R. A., Borkowski, K. J., Gerardy, C. L., Lawrence, S. S., & van den Bergh, S. 2001, AJ, 122, 2644
- Gotthelf et al. (2001) Gotthelf, E., Koralesky, B., Rudnick, L., Jones, T., Hwang, U., & Petre, R. 2001, ApJ, 552, L39
- Hughes et al. (2000) Hughes, J. P., Rakowski, C. E., Burrows, D. N., & Slane, P. O. 2000, ApJ, 528, L109
- Hwang, Holt, & Petre (2000) Hwang, U., Holt, S., & Petre, R. 2000, ApJ, 537, L119
- Hwang et al. (2001) Hwang, U., Szymkowiak, A. E., Petre, R., & Holt, S. S. 2001, ApJ, 560, L175
- Koralesky et al. (1998) Koralesky, B., Rudnick, L., Gotthelf, E., & Keohane, J. 1998, ApJ, 505, L27
- Reed et al. (1995) Reed, J. E., Hester, J. J., Fabian, A. C., & Winkler, P. F. 1995, ApJ, 440, 706
- Rothschild & Lingenfelter (2003) Rothschild, R. E. & Lingenfelter, R. E. 2003, ApJ, 582, 257
- Thorstensen, Fesen, & van den Bergh (2001) Thorstensen, J., Fesen, R., & van den Bergh, S. 2001, AJ, 122, 297
- Truelove & McKee (1999) Truelove, J. & McKee, C. 1999, ApJS, 120, 299
- Vink et al. (1998) Vink, J., Bloemen, H., Kaastra, J. S., & Bleeker, J. A. M. 1998, A&A, 339, 201
- Willingale et al. (2003) Willingale, R., Bleeker, J. A. M., van der Heyden, K. J., & Kaastra, J. S. 2003, A&A, 398, 1021
- Willingale et al. (2002) Willingale, R., Bleeker, J. A. M., van der Heyden, K. J., Kaastra, J. S., & Vink, J. 2002, A&A, 381, 1039
| Parameter | 2000 Value | 2002 Value |
|---|---|---|
| Total Observation Time (ks) | 52.4 | 51.4 |
| Target RA (deg) | 350.861250 | 350.861250 |
| Target Dec (deg) | 58.817500 | 58.817500 |
| Pointing RA (deg) | 350.917812 | 350.917312 |
| Pointing Dec (deg) | 58.792819 | 58.793648 |
| Pointing Roll (deg) | 323.387104 | 323.391738 |
| Chip Temperature (K) | 153.123627 | 153.284805 |
| Data Mode | Graded | Graded |
| Read Mode | Timed | Timed |
| Region | Azimuth | Radius | Expansion Rate | Expansion Rate Error | RadiusaaAssuming distance of 3.4 kpc | VelocityaaAssuming distance of 3.4 kpc | Velocity ErroraaAssuming distance of 3.4 kpc |
|---|---|---|---|---|---|---|---|
| (degrees) | (arcsec) | (% yr-1) | (% yr-1) | (pc) | (km s-1) | (km s-1) | |
| 1 | 51.8 | 167.83 | 0.196 | 0.024 | 2.77 | 5296 | 647 |
| 2 | 38.8 | 147.59 | 0.274 | 0.010 | 2.43 | 6520 | 245 |
| 3 | 42.0 | 132.75 | 0.204 | 0.036 | 2.19 | 4361 | 763 |
| 4 | 41.1 | 126.42 | 0.270 | 0.025 | 2.08 | 5497 | 505 |
| 5 | 37.0 | 134.91 | 0.261 | 0.025 | 2.22 | 5668 | 537 |
| 6 | 20.8 | 156.34 | 0.259 | 0.037 | 2.58 | 6519 | 930 |
| 7 | 12.2 | 158.80 | 0.194 | 0.018 | 2.62 | 4956 | 465 |
| 8 | 1.8 | 147.42 | 0.209 | 0.011 | 2.43 | 4961 | 250 |
| 9 | 353.0 | 156.65 | 0.099 | 0.022 | 2.58 | 2498 | 561 |
| 10 | 347.3 | 157.17 | 0.186 | 0.039 | 2.59 | 4723 | 996 |
| 11 | 347.0 | 153.00 | 0.159 | 0.056 | 2.52 | 3929 | 1376 |
| 12 | 348.1 | 145.80 | 0.167 | 0.050 | 2.40 | 3934 | 1179 |
| 13 | 341.2 | 157.45 | 0.249 | 0.041 | 2.60 | 6308 | 1030 |
| 14 | 338.4 | 151.01 | 0.185 | 0.010 | 2.49 | 4511 | 232 |
| 15 | 234.3 | 160.77 | 0.321 | 0.053 | 2.65 | 8324 | 1377 |
| 16 | 208.2 | 134.96 | 0.021 | 0.016 | 2.22 | 452 | 353 |
| 17 | 192.3 | 157.12 | 0.107 | 0.022 | 2.59 | 2722 | 542 |
| 18 | 188.9 | 152.39 | 0.197 | 0.060 | 2.51 | 4841 | 1461 |
| 19 | 186.7 | 147.30 | 0.215 | 0.016 | 2.43 | 5106 | 382 |
| 20 | 191.4 | 136.53 | 0.114 | 0.020 | 2.25 | 2504 | 435 |
| 21 | 180.4 | 132.84 | 0.197 | 0.045 | 2.19 | 4225 | 970 |
| 22 | 175.7 | 132.22 | 0.270 | 0.035 | 2.18 | 5764 | 741 |
| 23 | 154.2 | 150.29 | 0.111 | 0.042 | 2.48 | 2691 | 1005 |
| 24 | 152.5 | 145.90 | 0.275 | 0.041 | 2.40 | 6459 | 964 |
| 25 | 144.7 | 142.93 | 0.218 | 0.030 | 2.36 | 5029 | 686 |
| 26 | 136.9 | 154.85 | 0.246 | 0.019 | 2.55 | 6137 | 462 |
| 27 | 125.0 | 157.73 | 0.252 | 0.021 | 2.60 | 6404 | 529 |
| 28 | 122.8 | 165.01 | 0.227 | 0.027 | 2.72 | 6028 | 729 |
| 29 | 108.5 | 162.07 | 0.237 | 0.016 | 2.67 | 6190 | 412 |
| mean | 149.18 | 0.204 | 2.46 | 4916 | |||
| median | 151.01 | 0.209 | 2.49 | 5029 | |||
| rms | 11.03 | 0.066 | 0.18 | 1623 | |||
| error in mean | 2.05 | 0.012 | 0.03 | 301 |
| Expansion | Expansion | Expansion | |||
|---|---|---|---|---|---|
| MeasurementaaAll measurements by proper motion unless noted | Rate | Velocity | Parameter | Timescale | Reference |
| (% yr-1) | (km s-1) | (years) | |||
| Forward Shock | 0.21 | 5029 | 0.69 | 476 | this work |
| Bright Ring: | |||||
| Optical small scale (Doppler) | 5290 | Reed et al. (1995) | |||
| Optical small scale | 0.30 | 4842 | 0.99 | 338 | Thorstensen, Fesen, & van den Bergh (2001) |
| X-ray small scale (Doppler) | 2500 | Hwang et al. (2001); Willingale et al. (2002) | |||
| X-ray small scale | 0.21 | 3500 | 0.66 | 476 | Koralesky et al. (1998); Vink et al. (1998) |
| Radio small scale | 0.11 | 1750 | 0.35 | 909 | Koralesky et al. (1998) |
| Radio large scale | 0.07 | 1155 | 0.22 | 1429 | this work |