Absorption-Line Systems and Galaxies in Front of the Second Brightest Quasar, PHL 1811111Based on observations from (1) the NASA-CNES-CSA Far Ultraviolet Spectroscopic Explorer (FUSE) mission operated by Johns Hopkins University, supported by NASA contract NAS5-32985, (2) the NASA/ESA Hubble Space Telescope obtained at the Space Telescope Science Institute, which is operated by the Association of Universities for Research in Astronomy, Inc., under NASA contract NAS 5-26555, and (3) the Apache Point Observatory 3.5 m telescope, which is owned and operated by the Astrophysical Research Consortium.
Abstract
The extraordinarily bright quasar PHL 1811 at a redshift provides an attractive opportunity to use ultraviolet absorption-line spectroscopy to study the properties of gas systems in the local universe. A short (11.3 ksec), exploratory spectrum of this object was obtained by the Far Ultraviolet Spectroscopic Explorer (FUSE) with S/N = 20 per resolution element over the most relevant portions of the coverage from 907 to 1185 Å. This spectrum reveals 7 extragalactic absorption systems, one of which is a Lyman limit system at with . Three of the remaining systems have values that differ by less than 0.008 from that of the Lyman limit system. The abundance of O with respect to Fe in the Lyman limit system is not much different from the solar abundance ratio. The opacity of the Lyman limit system below 990 Å and the numerous features arising from Galactic H2 block a moderate fraction of important extragalactic features in the FUSE wavelength band. Nevertheless, supplementary spectra at low resolution plus a moderate resolution near-UV spectrum over a limited wavelength range recorded by the Space Telescope Imaging Spectrograph (STIS) on the Hubble Space Telescope helped to substantiate our identifications of systems in the FUSE spectrum. The low-resolution STIS spectrum also revealed 4 absorption features shortward of the quasar’s Ly emission, which we interpret to arise from additional systems showing only the Ly feature. Spectroscopy of 7 galaxies with within approximately 2′ of PHL 1811 indicated that 2 of them are near the redshift of the quasar and 4 have redshifts within of the extragalactic absorption systems. The Lyman limit system is likely associated with an galaxy at lying 23″ (kpc) from the sightline, with absorption arising in the halo of the galaxy or in an unusually large galactic disk. It is also possible that the absorbing material may be tidal debris arising from the galaxy’s interactions with a neighbor lying kpc from the sightline, or more extensive intragroup or intracluster gas. Finally, in addition to prominent features at very low velocities arising from the disk of our Galaxy, the strong resonance transitions of C II and Mg II show evidence for material at ; the column densities of these two species suggest that if the material has a solar composition.
1 Introduction
In an optical follow-up on the survey of Faint Images of the Radio Sky at Twenty Centimeters (FIRST), Leighly et al. (2001) recognized that PHL 1811 is a quasar with an apparent magnitude at and of 13.9 and a redshift . They stated that “These properties make it the second-brightest quasar (in apparent magnitude) known with after 3C 273.” This extraordinary finding presented an attractive prospect for research on the nature of gas systems at low redshifts, if indeed interesting systems were in front of the quasar and the quasar’s ultraviolet brightness were sufficient to yield a spectrum of good quality in a reasonable observing time. Investigations of this type are important since absorption systems in front of low- quasars offer the prospect of identifying and characterizing specific galaxies that are likely to be associated with the material. A quick reference for some fundamental attributes of PHL 1811 is given in Table 1. Additional background information and a history of the discovery of this object are given by Leighly et al. (2001).
| Property | Value |
|---|---|
| Alternate Name | FIRST J215501092224 |
| Equatorial Coordinates (J2000.0) , | 21 55 01.48, 09 22 24.7 |
| Galactic Coordinates , | 47.47, |
| Velocity ConversionbbUsing the standard IAU definition of the conversion from a heliocentric velocity to a local standard of rest velocity (Kerr & Lynden-Bell 1986). For the definition given by Mihalas & Binney (1981), replace by . | |
| Foreground Galactic H I (from 21-cm emission)cc (Hartmann & Burton 1997). | centered at |
| Foreground reddening from our Galaxy E() | 0.046 |
| Optical Classification | Narrow-line Seyfert 1 Galaxy |
| Power-law exponent for Optical Continuum Flux | |
| Radio flux (20 cm) | 1.4 mJy |
| Apparent MagnitudesddMagnitudes from the POSS I plates and USNO-A2.0 catalog (Monet et al. 1996). | |
| Flux ÅeeThis paper – see Figs. 1ac and 5. | Å-1 |
| Flux keV | |
| Emission-line Redshift | 0.192 |
| () |
In order to examine the potential of PHL 1811 for studying intervening absorption systems, we obtained a brief, exploratory exposure using the Far Ultraviolet Spectroscopic Explorer (FUSE) (Moos et al. 2000) to record a spectrum from 907 to 1185 Å. However, there is a virtually complete attenuation of the spectrum at wavelengths below the Lyman limit of an absorption system at , discussed in §5.1. This spectrum, presented in §2.1, shows that the quasar’s flux level is sufficient to yield a good spectrum at wavelengths covered by FUSE and the Hubble Space Telescope (HST). We also made use of the following HST observations at longer wavelengths to help in substantiating systems identified in the FUSE spectrum: (1) exposures using the G140L and G230L configurations on the Space Telescope Imaging Spectrograph (STIS) to give low resolution coverages of the wavelength ranges 11501700 and 16003150 Å (§2.2.1), respectively, and (2) an exposure using the G230MB mode on STIS that covered a small wavelength interval (27602910 Å) at moderate resolution (§2.2.2). Next, a more complete understanding of the line of sight to PHL 1811 can arise from a series of observations taken from the ground, where we identify specific foreground galaxies that might be responsible for the absorption systems that appear in the quasar’s ultraviolet spectrum. To find these candidate galaxies, we recorded an image covering a arc-min field surrounding the quasar (§3.1), identified non-stellar objects, and recorded their spectra (§3.2) to obtain the galaxy redshifts (§4.3).
Despite the relatively short exposure time, the FUSE spectrum exhibits many interesting absorption features. A large number of lines arise from atoms and H2 in the disk of our Galaxy. These features often block those originating from redshifted systems, which made the identifications of the latter less certain. Nevertheless, we succeeded in identifying 7 absorption systems (§4.1), and we measured equivalent widths of their unobscured features (§4.2) along with those that arise from the Galaxy. The properties of these low- systems are discussed in §5, including one that has sufficient neutral hydrogen to create a completely opaque Lyman limit (and high Lyman series) absorption below about 988 Å (§5.1). In addition to the systems identified from the FUSE spectrum, we also recognized four additional systems showing only Ly in the low-resolution STIS spectrum.
Ultimately, our overall understanding of the foreground to PHL 1811 relies on the combination of the absorption-line system identifications with the measurements of galaxy redshifts, and this in turn permits us to express some conclusions on the relationships between the absorbing gases and the outer portions (or neighboring regions) of the galaxies (§6). Finally, we offer some brief comments about the Galactic absorption features, including the normal, low-velocity interstellar gas (§7.1) and a detection of a new high-velocity gas system in the halo of our Galaxy (§7.2).
2 Ultraviolet Observations
2.1 FUSE
FUSE observed PHL 1811 with the light of the quasar centered in the Lif1 LWRS (30″ 30″) aperture for 11.3 ksec on 22 June 2001, as a part of a guaranteed observing program for the FUSE Science Team. The wavelength resolving power of FUSE is , which corresponds to 12 detector pixels. The spectra were reduced using Version 1.8.7 of the standard CALFUSE reduction pipeline (Sahnow et al. 2000). The wavelength coverages of different combinations of spectrographs and detectors, known as channels, are listed in Table 2. Data from the LiF1B channel from 1125 to 1152Å were rejected because they were degraded to an unacceptable level by a partial blockage by a wire mesh in front of the detector (Sahnow et al. 2000). Virtually all of the flux in the wavelength coverage of the SiC1B channel was blanked out by absorption from a Lyman limit system (LLS) in front of the quasar (§5.1). Hence this channel was not used.
| Channel | Coverage | |
|---|---|---|
| Name | (Å) | (Å-1) |
| SiC1A | 10031090 | 2.25 |
| SiC1B | 907993 | aaThis channel was not used; see text. |
| SiC2A | 9181005 | 1.75 |
| SiC2B | 10171103 | 3.0 |
| LiF1A | 9871083 | 1.2 |
| LiF1BbbThe spectrum from this channel was interrupted by a segment of poor quality from 1125 to 1152Å. | 10951125 | 1.25 |
| 11521185 | 1.7 | |
| LiF2A | 10871180 | 1.25 |
| LiF2B | 9871075 | 1.55 |
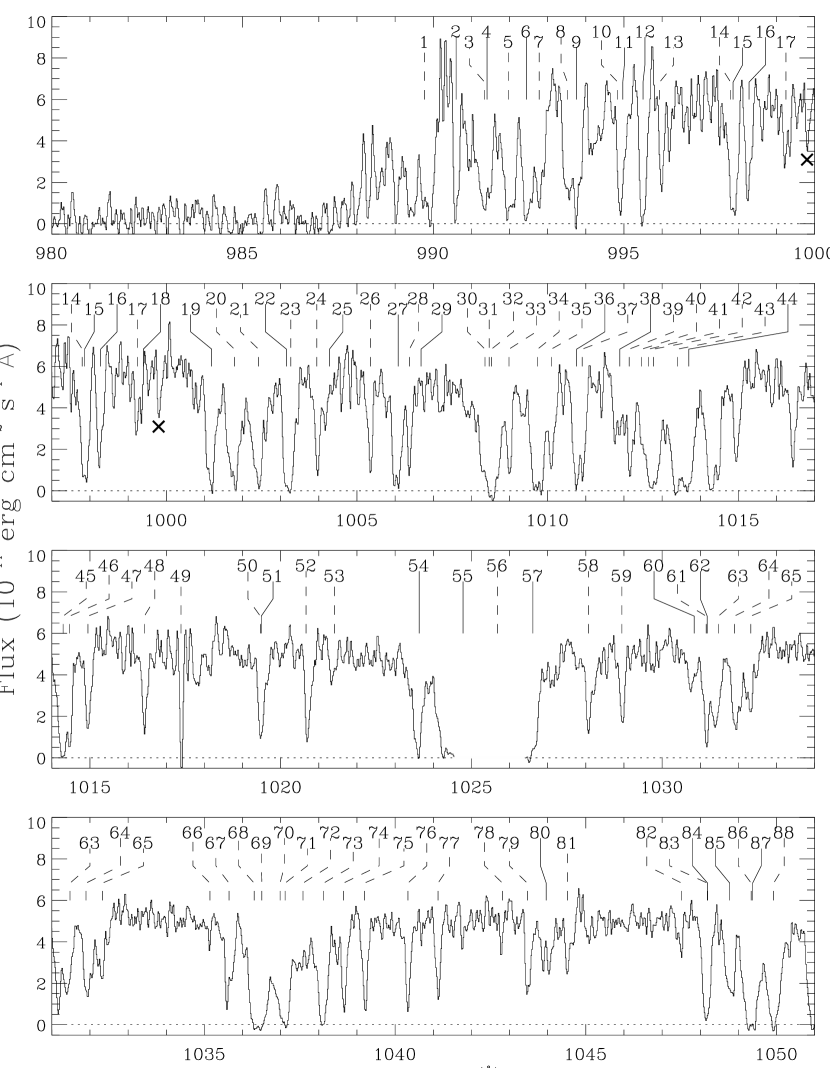
Investigators who present FUSE data often display separately the spectra recorded by the different channels. The reasons for doing so are twofold: first, separate plots of the individual outputs allow one to identify spurious features arising from localized, extraordinarily large deviations in the detector sensitivity (that are not properly corrected in the data reduction) and, second, the channels have slightly different resolutions and wavelength zero points. While we recognized the advantages for separate depictions of the spectra, we were nevertheless driven to display a composite spectrum of PHL 1811 from all of the channels in order to show information with an acceptable signal-to-noise ratio. Otherwise, many of the weakest absorption features would have been extremely difficult to identify. Significant spectral features that could be seen in one channel but were conspicuously absent in others were recognized as probably spurious and rejected. Only three such features can be easily seen in the composite spectrum, and they are marked with ’s in Figure 1. They appear at 999.8, 1140.8 and 1152.1 Å.


The spectra were combined in two ways for two different applications. One composite spectrum was created to give the best looking plot for displaying and identifying the features, while another was derived slightly differently to preserve the integrity of the estimated errors for measuring the equivalent widths of lines. In both cases, small shifts (up to 5 pixels Å) to compensate for differences in the wavelength zero points were implemented before the spectra were combined. For the spectrum that appears in Fig. 1, the most exact (noninteger) shifts were implemented to give the best possible resolution. Also, for display purposes, a convolution with a Gaussian of width 2.5 pixels (FWHM) was implemented. The spectrum created for equivalent width measurements had no such convolution performed, and the shifts between spectra were restricted to integer values to avoid the need for mid-pixel interpolations, which would alter the noise in unpredictable ways. In all instances, channel spectra were combined with weights proportional to their respective inverse variances. Estimates of these variances were based on the total event counts as a function of position, but only after they were smoothed with a 45-pixel wide kernel (Å) so that we could avoid biasing the outcomes by small-scale intensity shifts arising from either noise or real absorption features. Near the ends of individual spectra, the weight factors gradually tapered (over 50 pixels) to zero to avoid abrupt changes in the composite spectrum at the end of any channel’s coverage. One may derive an approximate value for the expected error in each pixel (of the combined spectrum) from the expression , where representative values of the flux errors are listed in Table 2 (to obtain the noise per resolution element, divide by ). Differences in the channel coverages result in moderate changes in this error of the composite fluxes from one wavelength to the next. For instance, the interval from 1083 to 1087Å has a poor signal-to-noise ratio, compared to the rest of the spectrum, because it is covered only by the SiC1A and SiC2B channels that have lower sensitivities than the LiF channels at long wavelengths.
Currently, without any special adjustments the heliocentric wavelength scale for the LiF1A FUSE spectrum, our most reliable channel for wavelengths, can have errors that correspond to offsets in radial velocity as large as , and these errors change slightly with wavelength. In order to refine the wavelengths, we applied an overall shift such that the Galactic absorption features, marked by dashed lines333The markers uniformly point to wavelengths corresponding to . in Fig. 1, agreed with our best expectation for their heliocentric velocity , based on the centroid of the H I 21-cm emission observed in the LeidenDwingeloo Survey very near the direction of PHL 1811 (Hartmann & Burton 1997) – see Table 1. After revising the wavelength scale, we find that Galactic features that have mÅ and no plausible interference from other lines (shown with endnote in Table 3) have an average equal to with an rms dispersion of – see the third column of Table 3. The correspondence in velocity between the absorption features in PHL 1811 and the 21-cm emission may not be exact, since the 21-cm telescope beam samples many directions somewhat offset from the line of sight to the quasar.
2.2 STIS
2.2.1 G140L and G230L Spectra
To help in confirming the reality of our identifications of systems in the FUSE spectrum and find systems that appear only at Ly, we made use of low-resolution spectra recorded by the Space Telescope Imaging Spectrograph (STIS) for a program intended for a study of the properties of PHL 1811 (program nr. 9181). The spectra were recorded on 12 December 2001, using the G140L () and G230L () gratings and the 02 entrance slit. To reduce the effects of any fixed pattern noise for this bright target, four subexposures were obtained with the target stepped along the slit. We applied the standard pipeline processing (CALSTIS Version 2.11) and then summed and resampled the spectra to yield exposures of 6640 and 1667 s for the G140L and G230L modes, respectively. The combined spectra with our proposed identifications (§4.1) are presented in Figures 5 and 6. For the G140L spectrum, we achieved (per resolution element), while for the G230L .


Systematic errors in the wavelength scale for STIS low resolution spectra range from 0.5 to 1.0 pixels (Leitherer 2001), which corresponds to Å and Å for the G140L and G230L modes, respectively.
2.2.2 G230MB Spectrum
We obtained a moderate resolution () STIS G230MB spectrum of PHL 1811 in the vicinity of the Mg II 2800 Å doublet from observations taken on 22 October 2001 as part of an Hubble Space Telescope (HST) snapshot (SNAP) observing program designed to search for weak Mg II absorption from High Velocity Clouds near the Milky Way toward AGNs that are bright in the ultraviolet (Program 9128). For this program, PHL 1811 was observed for a total of 1200 s, with two sub-exposures taken for cosmic ray rejection (CR-SPLIT=2), using the 52″02 slit and G230MB grating centered at 2836 Å (covering 2758–2914 Å). The object was placed in the E1 pseudo-aperture for improved charge transfer efficiency, and the CCD gain was set to 1 e-/ADU. STIS spectra recorded with the CCD benefit from a customized extraction more than the STIS spectra discussed in §2.2.1, which were obtained with the MAMA detectors. For instance, to preserve the LSF sampling and improve cosmic ray rejection, we refrained from binning the signals along either axis. We used the standard pipeline CALSTIS reduction to correct the bias (using the overscan and bias image), subtract the flat field and dark current, and combine the sub-exposures for cosmic ray rejection. We extracted a spectrum from the wavelength-calibrated, geometrically-corrected, two-dimensional image using tasks in the IRAF444IRAF is distributed by the National Optical Astronomy Observatories, which are operated by the Association of Universities for Research in Astronomy, Inc., under cooperative agreement with the National Science Foundation. twodspec/apextract package. A reference spectrum created by the coaddition of 15 separate targets from the same SNAP program was used to define the center of the aperture as a function of wavelength, and the final spectrum was then extracted using variance weighting. As expected, the resulting one-dimensional spectrum (Fig. 7) shows fewer artifacts and a somewhat improved quality ( per resolution element) when compared to the pipeline extraction, but all of the identified features were detectable in both extractions.

3 Ground-Based Observations
3.1 Image of the Field Surrounding PHL 1811
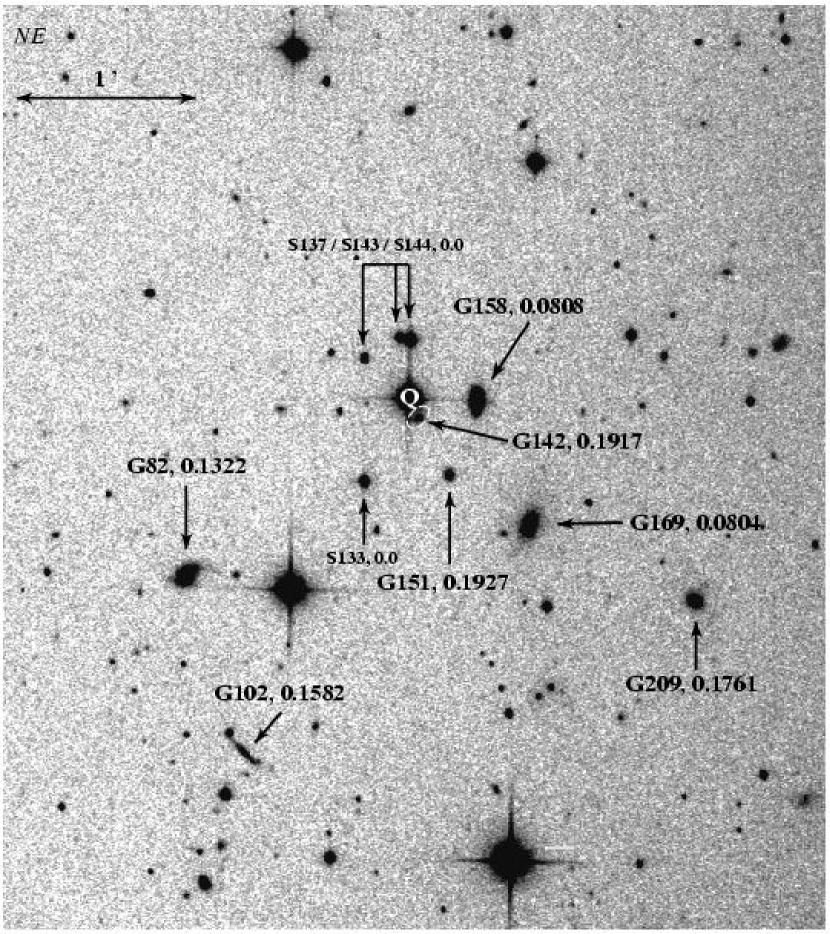
Eight 120 s -band images of the field of PHL 1811 covering a field of view were taken at the MDM 1.3-m McGraw-Hill Telescope on 29 June 2001. The seeing was . A portion of the combined -band image is presented in Figure 8. Standard stars in the field of PG 1633+099 (Landolt 1992) were used to calibrate the magnitude of PHL 1811. Light cirrus was present at dawn, suggesting that conditions may have not been photometric, but our value of for the QSO is consistent with the value of measured from POSS-I E plates and listed in the USNO-A2.0 catalog (Monet et al. 1996). To determine accurate coordinates of all the objects in the field, we identified stars which could be seen both in the CCD image and in the “First-generation” SERC-J STScI Digitized Sky Survey555Based on photographic data obtained using the UK Schmidt Telescope. The UK Schmidt Telescope was operated by the Royal Observatory, Edinburgh, with funding from the UK Science and Engineering Research Council, until 1988 June, and thereafter by the Anglo-Australian Observatory. The Digitized Sky Survey was produced at the Space Telescope Science Institute under a US Government grant NAG W-2166. image. Since precise coordinates of stars can be measured from the latter data, we were able to construct a plate-solution for the CCD image, giving positions of all objects accurate to arcsec. To catalog objects detected in the image, and to derive their magnitudes, we used the software package sextractor (Bertin & Arnouts 1996). Approximately 300 objects were identified down to a magnitude limit of .
3.2 Galaxy Spectra
In order to identify probable sources of the absorption systems detected in the FUSE and STIS data (particularly the LLS at ) we proceeded to obtain redshifts of objects in the field of PHL 1811. Spectra of eleven candidates were recorded using the Apache Point Observatory (APO) 3.5 m Telescope666The APO 3.5 m Telescope is owned and operated by the Astrophysical Research Consortium.. To check for compact galaxies near the sight line, spectra were obtained for several objects classified as stars, as well as for the obvious bright galaxies. Data were taken on 17, 18, and 20 November 2001 using the Double Imaging Spectrograph (DIS) and low resolution gratings. Spectra were obtained in long-slit mode, with total exposure times ranging from 1200 to 3500 seconds per object, and processed in the conventional manner. The data were wavelength calibrated using helium-neon-argon arc-lamp exposures, which were taken throughout the night. The spectra covered a wavelength range of 39005500 Å in the blue and 550010,000 Å in the red. The final resolution of the spectra was Å and 14.0 Å FWHM for the blue and red channels of the spectrograph, respectively.
4 Measurements
4.1 Identifications of Absorbing Systems
The FUSE spectrum was used as the primary source of information for recognizing absorption systems, since it covered a large number of features with a satisfactory wavelength resolving power. The three much lower resolution STIS spectra helped to confirm most of the absorption systems and provide some additional information. Prior to our attempts to pick out features from extragalactic systems, we identified obvious features arising from our Galaxy. In the FUSE spectrum, features from Galactic H2 are especially plentiful. On many occasions the foreground picket fence created by these features interfered with important extragalactic lines that could have corroborated tentative identifications of lines seen at other locations.
The easiest redshifted system to recognize is one that shows Lyman limit absorption that begins at about 988 Å and completely blocks light from the quasar at shorter wavelengths. As one might expect, of all the extragalactic systems we identified, this one shows the most features in the FUSE spectrum. Six other, much weaker absorption systems in front of PHL 1811 were also identified, three of which have redshifts that differ by less than from that of the Lyman limit system (LLS) at .
The Galactic lines appearing in the FUSE spectrum are listed in Table 3, along with their measured radial velocities and equivalent widths. Features belonging to the extragalactic systems are listed in Table 4. The redshifts listed in the first column of Table 4 are designated on the basis of where the most prominent lines are seen on the FUSE wavelength scale. They are uncertain by about because the FUSE wavelengths can have residual errors even after they are calibrated by the positions of the Galactic features, as described in §2.1. The observed wavelengths listed in the second column of Table 4 are simply computed from the laboratory wavelengths using these redshifts (except for line nr. 151 – see endnote of the table); they do not represent actual measurements of the positions of individual features. The last columns of Tables 3 and 4 show the identification numbers that are used in Fig. 1 to mark the respective lines.
| Transition | Species | error | ||
|---|---|---|---|---|
| Rest (Å) | Ident. | (km s-1) | (mÅ) | nr.aaLine identification numbers appearing in Fig. 1. The markers are shifted by relative to the wavelengths given in the first column. |
| 989.80/87 | N III/Si II | 1 | ||
| 991.38 | H2 L 90 R(0) | 3 | ||
| 992.01 | H2 L 90 R(1) | 5 | ||
| 992.81 | H2 L 90 P(1) | 7 | ||
| 993.55 | H2 L 90 R(2) | 8 | ||
| 994.87 | H2 L 90 P(2) | 10 | ||
| 995.97 | H2 L 90 R(3) | 6.4 | 102 | 13 |
| 997.83 | H2 L 90 P(3) | 14 | ||
| 999.28 | H2 L 90 R(4) | 17 | ||
| 1001.82 | H2 L 80 R(0) | 282bbSlight blending with a nearby feature may lead to additional error in . | 20 | |
| 1002.45 | H2 L 80 R(1) | 303 | 21 | |
| 1003.30 | H2 L 80 P(1) | 23 | ||
| 1003.98 | H2 L 80 R(2) | 117bbSlight blending with a nearby feature may lead to additional error in . | 24 | |
| 1005.39 | H2 L 80 P(2) | 111 | 26 | |
| 1006.41 | H2 L 80 R(3) | 108 | 28 | |
| 1008.39 | H2 L 80 P(3) | 30 | ||
| 1008.50/55 | H2 W 00 R(1)/R(0) | 31 | ||
| 1008.56 | H2 W 00 R(0) | 32 | ||
| 1009.02 | H2 W 00 R(2) | 115 | 33 | |
| 1009.77 | H2 W 00 Q(1) | 34 | ||
| 1010.13 | H2 W 00 R(3) | 35 | ||
| 1010.94 | H2 W 00 Q(2) | 37 | ||
| 1012.17 | H2 W 00 P(2) | 39 | ||
| 1012.50 | S III | 40 | ||
| 1012.68 | H2 W 00 Q(3) | 41 | ||
| 1012.81 | H2 L 70 R(0) | 42 | ||
| 1013.44 | H2 L 70 R(1) | 43 | ||
| 1014.33 | H2 L 70 P(1) | 45 | ||
| 1014.50 | H2 W 00 P(3) | 46 | ||
| 1014.98 | H2 L 70 R(2) | 101 | 47 | |
| 1016.46 | H2 L 70 P(2) | 115 | 48 | |
| 1017.42 | H2 L 70 R(3) | 133 | 49 | |
| 1019.50 | H2 L 70 P(3) | 50 | ||
| 1020.70 | Si II | 2.3 | 149 | 52 |
| 1021.45 | HD L 70 R(0) | 41 | 53 | |
| 1025.72 | H I (Ly) | 56 | ||
| 1028.11 | H2 L 60 P(2) | 122 | 58 | |
| 1028.98 | H2 L 60 R(3) | 95 | 59 | |
| 1031.19 | H2 L 60 P(3) | 61 | ||
| 1031.51 | Cl I | 63 | ||
| 1031.93 | O VI | 337b, cb, cfootnotemark: | 64 | |
| 1032.36 | H2 L 60 R(4) | 65 | ||
| 1035.18 | H2 L 60 P(4) | 23 | 66 | |
| 1036.34 | C IIddHigh-velocity component – see §7.2. | 137 | 67 | |
| 1036.34 | C II | 68 | ||
| 1036.54 | H2 L 50 R(0) | 69 | ||
| 1037.02 | C II* | 70 | ||
| 1037.15 | H2 L 50 R(1) | 71 | ||
| 1037.62 | O VI | 72 | ||
| 1038.16 | H2 L 50 P(1) | 255 | 73 | |
| 1038.68 | H2 L 50 R(2) | 126 | 74 | |
| 1039.23 | O I | 132eePossible contamination from geocoronal emission may partly fill in this line. For this reason, the real value of could be larger. | 75 | |
| 1040.37 | H2 L 50 P(2) | 120 | 76 | |
| 1041.16 | H2 L 50 R(3) | 104 | 77 | |
| 1042.85 | HD L 50 R(0) | 14 | 78 | |
| 1043.50 | H2 L 50 P(3) | 105 | 79 | |
| 1044.55 | H2 L 50 R(4) | 81 | 81 | |
| 1047.55 | H2 L 50 P(4) | 31 | 82 | |
| 1048.22 | Ar I | 226 | 83 | |
| 1049.37 | H2 L 40 R(0) | 86 | ||
| 1049.96 | H2 L 40 R(1) | 88 | ||
| 1051.03 | H2 L 40 P(1) | 89 | ||
| 1051.50 | H2 L 40 R(2) | 91 | ||
| 1053.28 | H2 L 40 P(2) | 115 | 93 | |
| 1053.98 | H2 L 40 R(3) | 99 | 94 | |
| 1055.26 | Fe II | 27 | 95 | |
| 1056.47 | H2 L 40 P(3) | 88 | 97 | |
| 1060.58 | H2 L 40 P(4) | 31 | 98 | |
| 1061.70 | H2 L 40 R(5) | 26 | 100 | |
| 1062.15 | Fe II | 1 | 101 | |
| 1062.66 | S IV | 103 | ||
| 1062.88 | H2 L 30 R(0) | 104 | ||
| 1063.18 | Fe II | 105 | ||
| 1063.46 | H2 L 30 R(1) | 106 | ||
| 1063.97 | Fe II | 18 | 107 | |
| 1064.61 | H2 L 30 P(1) | 237 | 108 | |
| 1064.99 | H2 L 30 R(2) | 146 | 109 | |
| 1066.66 | Ar I | 92 | 111 | |
| 1066.90 | H2 L 30 P(2) | 105 | 113 | |
| 1067.47 | H2 L 30 R(3) | 93 | 114 | |
| 1070.14 | H2 L 30 P(3) | 117 | ||
| 1070.90 | H2 L 30 R(4) | 44 | 118 | |
| 1077.14 | H2 L 20 R(0) | 408 | 119 | |
| 1077.70 | H2 L 20 R(1) | 306 | 120 | |
| 1078.92 | H2 L 20 P(1) | 229 | 122 | |
| 1079.23 | H2 L 20 R(2) | 100 | 123 | |
| 1081.27 | H2 L 20 P(2) | 132 | 124 | |
| 1081.71 | H2 L 20 R(3) | 111 | 125 | |
| 1083.99 | N II | 170 | 126 | |
| 1084.56/58 | H2 L 20 P(3)/N II* | 127 | ||
| 1092.19 | H2 L 10 R(0) | 282 | 128 | |
| 1092.73 | H2 L 10 R(1) | 217 | 129 | |
| 1094.05 | H2 L 10 P(1) | 173bbSlight blending with a nearby feature may lead to additional error in . | 130 | |
| 1094.24 | H2 L 10 R(2) | 97bbSlight blending with a nearby feature may lead to additional error in . | 131 | |
| 1096.44 | H2 L 10 P(2) | 114 | 132 | |
| 1096.72 | H2 L 10 R(3) | 133 | ||
| 1096.88 | Fe II | 134 | ||
| 1099.79 | H2 L 10 P(3) | 63 | 135 | |
| 1100.16 | H2 L 10 R(4) | 35 | 136 | |
| 1108.13 | H2 L 00 R(0) | 143 | ||
| 1108.63 | H2 L 00 R(1) | 144 | ||
| 1110.06/12 | H2 L 00 P(1)/R(2) | 184 | 147 | |
| 1112.49/58 | H2 L 00 P(2)/R(3) | 150 | ||
| 1115.90 | H2 L 00 P(3) | ffThe feature seen at the position of this line is unlikely to arise from H2 in the Galaxy. The measured equivalent width of mÅ for line nr. 151 attributed to extragalactic O VI in Table 4 is comparable to, or slightly greater than, the value of mÅ measured for the Lyman 10 P(3) line at 1099.79 Å(line nr. 135), a transition whose strength is greater by a factor of 3.3 (Abgrall & Roueff 1989). | 152 | |
| 1121.97 | Fe II | 56 | 156 | |
| 1122.52 | Fe III | 64bbSlight blending with a nearby feature may lead to additional error in . | 157 | |
| 1125.45 | Fe II | 54 | 160 | |
| 1129.19 | C I | 35 | 161 | |
| 1133.67 | Fe II | 32 | 162 | |
| 1134.17 | N I | 102eePossible contamination from geocoronal emission may partly fill in this line. For this reason, the real value of could be larger. | 163 | |
| 1134.41 | N I | 144eePossible contamination from geocoronal emission may partly fill in this line. For this reason, the real value of could be larger. | 164 | |
| 1134.98 | N I | 160eePossible contamination from geocoronal emission may partly fill in this line. For this reason, the real value of could be larger. | 165 | |
| 1139.79 | C I | 50 | 166 | |
| 1142.37 | Fe II | 50 | 167 | |
| 1143.23 | Fe II | 56 | 168 | |
| 1144.94 | Fe II | 134 | 170 | |
| 1152.82 | P II | 85 | 173 | |
| 1157.91 | C I | 29 | 174 |
| Observed | Transition | Species | error | ||
|---|---|---|---|---|---|
| (Å) | (Å) | Ident. | (mÅ) | nr.aaLine identification numbers appearing in Fig. 1. | |
| 0.07344 | 1006.67 | 937.80 | H I (Ly) | 29 | |
| 1019.49 | 949.74 | H I (Ly) | 51 | ||
| 1044.18 | 972.54 | H I (Ly) | 127 | 80 | |
| 1048.77 | 977.02 | C III | 190 | 85 | |
| 1061.39 | 988.77 | O I | 99 | ||
| 1062.49 | 989.80/87 | N III/Si II | 102 | ||
| 1101.05 | 1025.72 | H I (Ly) | 271 | 137 | |
| 1107.71 | 1031.93 | O VI | 23 | 142 | |
| 1112.45 | 1036.34 | C II | 149 | ||
| 1163.60 | 1083.99 | N II | 0 | 177 | |
| 0.07779 | 994.96 | 923.15 | H I (Ly) | 11 | |
| 998.28 | 926.23 | H I (Ly) | 16 | ||
| 1003.15 | 930.75 | H I (Ly) | 22 | ||
| 1010.75 | 937.80 | H I (Ly) | 36 | ||
| 1023.62 | 949.74 | H I (Ly) | 283 | 54 | |
| 1048.19 | 972.54 | H I (Ly) | 84 | ||
| 1053.02 | 977.02 | C III | 104 | 92 | |
| 1065.69 | 988.77 | O I | 110 | ||
| 1066.80 | 989.80/87 | N III/Si II | 112 | ||
| 1105.51 | 1025.72 | H I (Ly) | 260 | 140 | |
| 1112.20 | 1031.93 | O VI | 51bbSlight blending with a nearby feature may lead to additional error in . | 148 | |
| 1116.96 | 1036.34 | C II | 28 | 153 | |
| 0.07900 | 999.40 | 926.23 | H I (Ly) | 18 | |
| 1004.28 | 930.75 | H I (Ly) | 25 | ||
| 1011.89 | 937.80 | H I (Ly) | 38 | ||
| 1024.77 | 949.74 | H I (Ly) | 55 | ||
| 1049.37 | 972.54 | H I (Ly) | 87 | ||
| 1106.75 | 1025.72 | H I (Ly) | 286 | 141 | |
| 0.08093 | 990.60 | 916.43 | H I (Ly) | 148 | 2 |
| 991.41 | 917.18 | H I (Ly) | 4 | ||
| 992.43 | 918.13 | H I (Ly) | 6 | ||
| 993.75 | 919.35 | H I (Ly) | 9 | ||
| 995.49 | 920.96 | H I (Ly) | 186 | 12 | |
| 997.86 | 923.15 | H I (Ly) | 15 | ||
| 1001.19 | 926.23 | H I (Ly) | 258 | 19 | |
| 1006.08 | 930.75 | H I (Ly) | 245 | 27 | |
| 1013.70 | 937.80 | H I (Ly) | 44 | ||
| 1026.60 | 949.74 | H I (Ly) | 57 | ||
| 1030.83 | 953.65 | N I | 40ccExistence of O VI is not certain, since a feature is not seen at 1037.62 Å. However C II* and H2 features near the weaker O VI line make this apparent absence inconclusive. | 60 | |
| 1031.17 | 953.97 | N I | 62 | ||
| 1051.25 | 972.54 | H I (Ly) | 90 | ||
| 1056.09 | 977.02 | C III | 253 | 96 | |
| 1068.79 | 988.77 | O I | 56 | 115 | |
| 1069.90 | 989.80/87 | N III/Si II | 116 | ||
| 1108.73 | 1025.72 | H I (Ly) | 145 | ||
| 1115.85ddThe O VI feature appears to be offset by relative to the other lines in this system. It is implausible that the shifted feature arises solely from H2 in the Galaxy – see endnote that applies to line nr. 152 in Table 3. | 1031.93 | O VI | 78 | 151 | |
| 1120.21 | 1036.34 | C II | 97 | 155 | |
| 1149.22 | 1063.18 | FeII | 171 | ||
| 1171.72 | 1083.99 | N II | 85eeAssumes that no O VI is present in the system at . | 180 | |
| 0.13225 | 1161.37 | 1025.72 | H I (Ly) | 177 | 175 |
| 0.13541 | 1078.34 | 949.74 | H I (Ly) | 77 | 121 |
| 1104.23 | 972.54 | H I (Ly) | 68 | 139 | |
| 1109.32 | 977.02 | C III | 57ffPossible contamination from a feature arising from Galactic C I, but it should be weaker than the other Galactic C I features (nrs. 161, 166 and 174) in Table 3. | 146 | |
| 1122.66 | 988.77 | O I | 158 | ||
| 1123.83 | 989.80/87 | N III/Si II | 159 | ||
| 1164.61 | 1025.72 | H I (Ly) | 147 | 178 | |
| 1171.66 | 1031.93 | O VI | 179 | ||
| 1176.67 | 1036.34 | C II | 181 | ||
| 1178.12 | 1037.62 | O VI | 18 | 182 | |
| 0.17651 | 1103.33 | 937.80 | H I (Ly) | 51 | 138 |
| 1117.38 | 949.74 | H I (Ly) | 58 | 154 | |
| 1144.20 | 972.54 | H I (Ly) | 142 | 169 | |
| 1149.47 | 977.02 | C III | 172 | ||
| 1163.30 | 988.77 | O I | 176 |
Finally, after accounting for absorption features in the STIS spectrum that could arise from the systems identified in the FUSE spectrum, we found 4 features shortward of the quasar’s Ly emission peak that remained without identifications. We provisionally recognize these as Ly absorptions from additional systems at redshifts 0.01187, 0.01771, 0.05119, and 0.19045 that do not reveal themselves in the FUSE spectrum. Their weaker Ly counterparts are all hidden by other lines of known origin. The combined random and systematic errors for the redshifts of these systems are about .
4.2 Equivalent Width Measurements
We measured the equivalent widths of Galactic and extragalactic lines that were not obviously blended with other features. At locations where there was a reasonable expectation that a line might be present but none was seen, we evaluated a formal measurement of the equivalent width that yielded a value (sometimes negative) that was comparable to or less than the error. These nondetections are useful for obtaining upper limits for the column densities of certain species. We used continuum levels defined by least squares fits of Legendre polynomials to intensities on either side of each line, following the methods described by Sembach & Savage (1992). The outcomes of the measurements for the rest frame of each system, , are given in Columns 3 and 5 of Tables 3 and 4, respectively. The listed errors reflect uncertainties arising from two effects: one is the possible deviation of the result that could arise from the uncertainty of the defined continuum level,777We followed the practice of Jenkins (2002) of doubling the formal result for the continuum uncertainty, see §4.3 of his paper. and the other is the uncertainty produced by random noise for intensities within the wavelength interval of the line. These effects should be independent of each other, hence their magnitudes are added in quadrature to arrive at a final error estimate.
Actual deviations in the intensities away from the adopted continuum levels exceeded the noise amplitudes defined by the FUSE data reduction pipeline by factors ranging from 1.2 to 1.4. We expect these increased errors arise from small, unrecognized absorption features or uncalibrated detector fixed-pattern noise. For our estimates of the contributions by random noise to the equivalent width errors, we used these larger excursions instead of error values supplied by the data reduction pipeline.
| Heliocentric | ||
|---|---|---|
| (Å)aaSystems identified only by the appearance of Ly features in the G140L STIS spectrum have their random wavelength uncertainties listed. Possible systematic errors (common to all lines) of up to 0.5 Å should be added in quadrature to these errors. We have not specified errors for systems with lines detected in the FUSE spectrum because the FUSE measurements are considerably more accurate (see §2.1). | (Å) | |
| 0.01187 | 1230.1 | 0.24 |
| 0.01771 | 1237.2 | 0.21 |
| 0.05119 | 1277.9 | 0.60 |
| 0.07344 | 1305.0 | bbThis measured value is actually an upper limit because there is interference from Galactic O I and Si II . |
| 0.07779, 0.07900, | ||
| 0.08093 | 1311.7 | 1.73 |
| 0.13225, 0.13541 | 1378.4 | 0.80ccWhile we report an equivalent width for this line, it may actually arise from Galactic O VI at . |
| 0.17651 | 1430.3 | 0.38 |
| 0.19045 | 1447.2 | 0.09 |
| Observed | Transition | Species | error | ||
|---|---|---|---|---|---|
| (Å) | (Å)aaVacuum wavelengths | Ident. | (mÅ) | nr.bbLine identification numbers appearing in Fig. 7 | |
| 0.0 | 2794.49 | 2796.35 | Mg II | 307 | 1ccLines are partly blended. Approximate contributions of and 0.13541 components are 0.49 and Å, respectively. |
| 2796.35 | 2796.35 | Mg II | 904ddSome contribution to this line’s may come from the Fe II line in the system at . | 2 | |
| 2801.66 | 2803.53 | Mg II | 250 | 3ccGalactic component at a radial velocity . | |
| 2803.53 | 2803.53 | Mg II | 785 | 4 | |
| 2852.96 | 2852.96 | Mg I | 234 | 6 | |
| 0.08093 | 2810.60 | 2600.17 | Fe II | 172 | 5 |
| 3022.66 | 2796.35 | Mg II | 145 | eeSee upper panel of Fig. 6. | |
| 3030.42 | 2803.53 | Mg II | 162 | eeSee upper panel of Fig. 6. | |
| 3083.85 | 2852.96 | Mg I | 137 | eeSee upper panel of Fig. 6. |
Measurements of the equivalent widths (and errors) of extragalactic Ly features in the G140L STIS spectrum are listed in Table 5. In addition, equivalent widths of useful lines appearing in the near-UV STIS spectra shown in Figs. 6 and 7 are presented in Table 6. As with Tables 3 and 4, the last column of this table lists a numbered sequence for the features that appear in the spectrum (Fig. 7).
4.3 Galaxy Redshifts
Now having recognized the information about absorption systems available from the UV spectra, we move on to find possible links with galaxies observed from the ground, as described in §3. Unfortunately, no radial velocity standards could be taken during the APO observations of the galaxy spectra, so we used the spectrum of the standard star HD 182572 which had been taken at a different telescope. Although a radial velocity standard should ideally be obtained using the same instrument as the data whose redshifts are to be determined, the IRAF routine fxcor is able to resample spectra taken at different dispersions and compute a Fourier cross-correlation between the template spectrum and the object whose redshift is to be determined.
| Galaxy or Star | bbSeparation between galaxy and PHL 1811 on the plane of the sky, in arcseconds. | ccApproximate error in redshift measurement from the cross-correlation analysis procedure fxcor. | ddImpact parameter between galaxy and PHL 1811 sightline, in kpc, where , is the Hubble constant, and . | ( | Nearest | ggError is dominated by the effect of (col. 6). | |||
|---|---|---|---|---|---|---|---|---|---|
| IDaa“G” = galaxy; “S” = star. | RA and DEC (J2000) | (′′) | ee-band magnitude from the CCD frame shown in Fig. 8. | (km s-1) | ( kpc) | )ffAbsolute magnitude of galaxy, with no -correction. | () | ||
| (1) | (2) | (3) | (4) | (5) | (6) | (7) | (8) | (9) | (10) |
| G142 | 21:55:01.32 9:22:30.9 | 7.2 | 19.0 | 0.1917 | 210 | 22 | 20.8 | ||
| S144 | 21:55:01.53 9:22:04.5 | 19.8 | 16.6 | 0.0 | |||||
| S137 | 21:55:02.57 9:22:11.0 | 20.4 | 18.5 | 0.0 | |||||
| S143 | 21:55:01.78 9:22:03.6 | 21.1 | 18.0 | 0.0 | |||||
| G158 | 21:54:59.98 9:22:24.8 | 22.9 | 17.0 | 0.0808 | 100 | 34 | 20.8 | 0.08093 | |
| S133 | 21:55:02.53 9:22:52.7 | 31.9 | 17.2 | 0.0 | |||||
| G151 | 21:55:00.58 9:22:50.0 | 29.3 | 19.4 | 0.1927 | 185 | 90 | 20.4 | ||
| G169 | 21:54:58.73 9:23:06.2 | 58.9 | 16.7 | 0.0804 | 60 | 88 | 21.1 | 0.08093 | |
| G82 | 21:55:06.56 9:23:25.5 | 96.2 | 17.4 | 0.1322 | 250 | 220 | 21.5 | 0.13541 | |
| G209 | 21:54:54.94 9:23:31.2 | 118.3 | 17.9 | 0.1761 | 100 | 340 | 21.7 | 0.17651 | |
| G102 | 21:55:05.12 9:24:25.6 | 132.3 | 20.0 | 0.1582hhAll redshifts are measured from the cross-correlation of galaxy absorption features with a radial velocity standard, except G102, which has derived from an [O II] emission line and hence there is no formal error from the cross-correlation analysis. | hhAll redshifts are measured from the cross-correlation of galaxy absorption features with a radial velocity standard, except G102, which has derived from an [O II] emission line and hence there is no formal error from the cross-correlation analysis. | 350 | 19.5 |
The results are given in Table 7. The numerical assignments given in column 1 are arbitrary and merely reflect the position of the object in the catalog of objects generated by sextractor (§3.1). We list the position and magnitude of the observed object as derived from the sextractor catalog in columns 2 and 4, along with the separation of the object from the sightline to PHL 1811 on the plane of the sky in arcsecs (column 3) and in kpc888, where is the Hubble constant, and is assumed throughout this paper. (column 7) based on the derived redshift (column 5). Measurement of a galaxy’s position and hence its distance from the sightline toward the quasar is derived from recalculating the barycenter of the CCD pixels comprising the galaxy, and can be measured to an accuracy better than 0.5 pixels (or 02). At a redshift of 0.0809, this uncertainty corresponds to . A simple conversion of the observed magnitude to an absolute magnitude is given in column 8, with no -correction. Redshift errors from fxcor are based on the fitted peak height and the antisymmetric noise as described by Tonry & Davis (1979), and are listed as in column 6 of Table 7. The value of depends on the of the galaxy spectrum and on which absorption features are in common with the template spectrum. Since the galaxy spectra obtained at APO are of different quality from each other, and show different absorption features, the values of vary for each galaxy.
All of the galaxies observed showed the usual 4000 Å break along with Ca II H & K lines. G82 also showed an [O II] emission line, while G142 had [O II], H, and [N II] emission lines present, but no H and only a very weak [O III] line (the line being swamped by a sky emission line). G151 also showed [O II], H, [N II] and weak [S II], while G102’s redshift was measured from a strong [O II] line; although the 4000 Å break and a weak [O III] line were visible, the signal-to-noise of the spectrum was too poor to provide a reliable redshift from cross-correlation with the template star.
Comparison of the galaxies for which we were able to obtain redshifts with all the galaxies cataloged suggests that we are likely complete in redshift information for non-stellar objects down to a magnitude of at a radius of approximately 130”. This corresponds to an absolute magnitude of () and a radius of kpc at the redshift of the LLS.
5 Properties of the Extragalactic Absorbing Systems
5.1 Lyman Limit System at
The absence of H2 features or a very strong, damped Ly absorption for the gas system at (compare with the feature from our Galaxy in Fig. 5) suggests that the line of sight is probably not penetrating an arm within the inner disk of a galaxy. In fact, this system is probably associated with a the outer portions of a galaxy, to be discussed later in §6.1, that has a virtually identical redshift at a projected distance of 23″ from PHL 1811. Some O VI seems to be present, as evidenced by an absorption close to the redshifted transition at 1031.93 Å (line nr. 151 in Fig. 1 and Table 4), but at a velocity shift of about relative to the other gas. We are unable to confirm this identification by sensing the weaker 1037.62 Å line, which should appear at 1121.59 Å with an equivalent width of about 39 mÅ (or less, if there is some contamination of the 1032 Å line from the Galactic H2 Lyman 00 P(3) line; see endnote of Table 3). This longer wavelength member of the doublet might be too weak to detect above the noise, and it is partly blocked by Galactic Fe II at 1121.97 Å (line nr. 156 – this transition is about twice as strong as the another Fe II transition at 1125.45 Å, seen as line nr. 160, so the former should be stronger than the latter by an amount that depends on the line saturation).
The amount of H I present in the system is not well constrained. The fact that less than about 15% of the flux from PHL 1811 is transmitted below 988 Å defines a lower limit . We are reluctant to make this limit more stringent because of uncertainties in the FUSE scattered light determinations. The lack of any damping wings in excess of 10% absorption at 0.6 Å from the center of Ly (line nr. 145) indicates that , a hundred times higher than our lower limit. Intermediate members of the Lyman series are not useful in further constraining the range, since they are on the flat portion of the curve of growth. HST observations of the Ly transition at moderate resolution might reveal damping wings and thus give a direct determination of .
A problem of high priority in astrophysics, but one that is usually very difficult to carry out, is the measurement of the ratio of D I to H I in extragalactic and Galactic gas systems. The findings have important implications for our assessment of the total baryon density in the universe (Boesgaard & Steigman 1985; Walker et al. 1991), but this goal has been elusive because various determinations seem to disagree with each other (and weaknesses in some have been pointed out: Lemoine et al. 1999; Moos et al. 2001; O’Meara et al. 2001; Pettini & Bowen 2001). We now ask, “Can we measure D/H in the system at in front of PHL 1811?” Obviously we are unable to do so at the moment because we do not know the value of to within a full 2 orders of magnitude. Nevertheless, it is useful to examine whether or not this problem is tractable in the future, perhaps after HST observations of Ly define with reasonable accuracy and much longer observations have been carried out with FUSE.
Features from foreground Galactic H2 make the sensing and measurement of Lyman series D I features in the system very difficult. The strongest such line that is completely free of interfering H2 absorptions is Ly at Å (line nr. 27). If is equal to our upper limit of , the deuterium feature at Ly would have a strength of only 24 mÅ if . Here, the D feature would be measurable only under the extremely optimistic circumstances that is large and the S/N is much better than what we have here. There are many absorption features on top of other high members of the Lyman series, such as Ly, Ly, Ly, Ly and Ly (line nrs. 15, 19, 44, 57, and 90) but the relatively weak Lyman 00 R(0) and R(1) lines (nrs. 143 and 144) on top of Ly could be modeled by studying the appearance of the 10 counterparts (nrs. 128 and 129) which are about 3.4 times as strong. In order to do this, one would need to determine the degree of saturation of the stronger pair of lines. However, even if we assume the saturation is very large (i.e., that the 00 lines are as strong as the 10 ones), we find that the absorption precisely on top of the expected position of the deuterium feature should not be very strong (but it is strong on either side of this location). The measured flux at this position in the FUSE data currently available is less than about 10% of the local continuum, so D I absorption at Ly might be rather strong. However, in view of the fact that we are unable to identify a real “feature” at this location, we are reluctant to attribute this absorption to deuterium.
The O I 988.77, 988.65, 988.58 blend (line nr. 115 in Fig. 1 and Table 4)appears to be not strongly saturated, since it is weaker than lines produced by either C II (nr. 155) or N II (nr. 180, but see endnote of Table 4). If we assume these lines are near the linear portion of the curve of growth and adopt the combined -value 0.0554 (Morton 2000), we arrive at , with an error in the linear value that scales in proportion to the listed uncertainty in equivalent width. Unfortunately, we cannot do the same for the N I feature, which appears at 1030.83 Å, because there is a good chance that this feature is actually Galactic O VI at (Sembach et al. 2002). Other N I lines well removed from Galactic O VI are weaker and should be below our detection limit.
An absorption feature from Fe II is clearly detected in the STIS G230MB spectrum (line nr. 5 in Fig. 7 and Table 6). We find that for an -value of 0.224 (Morton 1991), with the actual number representing virtually no saturation of the line.999Unfortunately, we are unable to verify that this line is unsaturated by examining the weaker transition, because the expected position of this line at 2795.86 Å is buried under the left-hand side of the Galactic Mg II transition at 2796.35 Å. The value of for this line is not much different from that of O I feature discussed above, hence it is reasonable to compare O I to Fe II even if the lines are mildly saturated. We find that , a value that is not very far from the solar value of dex (Allende Prieto, Lambert, & Asplund 2001; Holweger 2002), indicating that the depletion by dust-grain formation is considerably less than the typical value of dex found for warm gas in the disk of our Galaxy (Jenkins, Savage, & Spitzer 1986) or even -0.6 to -1.0 dex for lines of sight toward stars in the lower portion of the halo of our Galaxy (Savage & Sembach 1996; Sembach & Savage 1996). Of course, another alternative might be that depletion compensates for a fundamental overabundance of Fe with respect to O.
5.2 Other Systems
The most conspicuous features in the remaining systems that we identified are the Lyman series lines and the often very strong C III line. Two of the systems, ones at and 0.13225, can be seen only at Ly (line nrs. 141 and 175, respectively, in Fig. 1 and Table 4) in the FUSE spectrum. Attempts to find other strong lines, either to substantiate or discredit these identifications, failed because they were blocked by foreground Galactic features. If these features are not Ly at the specified redshifts, then they must be deemed to be truly unidentified (they cannot be higher Lyman series lines at a higher redshift, otherwise the stronger and slightly weaker lines would also be visible). A reassurance about the reality of the system at arises from a distinct feature at the expected wavelength 1376.4Å of Ly in the STIS G140L spectrum (Fig. 5 and Table 5) and an almost exact match in the redshift of a galaxy (G82) reported in §4.3. We have not identified a galaxy near the redshift of the system at , and the expected position of its Ly feature is sandwiched between those of two other systems.
There seems to be no evidence in the form of Lyman series or C III absorption that there is a distinct associated absorber system very near the redshift of PHL 1811. However, a very weak Ly absorption is evident in the STIS G140L spectrum at .
Accumulating evidence indicates that O VI absorbers harbor an important fraction of the baryons at low redshifts (Tripp, Savage, & Jenkins 2000; Tripp et al. 2001; Savage et al. 2002a). However, the current sample of low- O VI systems is still rather small, and additional observations are needed to reduce statistical uncertainties. The PHL 1811 FUSE spectrum has sufficient resolution and S/N ratios to reveal isolated lines with mÅ at the 3 level or better and is therefore useful for detecting potential O VI systems. Consequently, we searched the FUSE spectrum for systems that might be conspicuous only by absorption from the O VI doublet. No pairs of features with the correct spacing and intensity ratio for the O VI doublet were unambiguously apparent. Even if we assume the 1038 Å line is too weak to be seen (or is hidden by another line), we were unable to find single, unidentified lines with mÅ in spectral regions where the probable equivalent width errors are less than 30 mÅ. However, the PHL 1811 spectrum is severely blanketed by H2 and other Galactic absorption lines as well as extragalactic lines (see Tables 3 and 4), and this substantially reduces the “clear” redshift path available for detection of O VI. We estimate that in our FUSE spectrum the unblocked redshift path for identifying the 1032 Å O VI line is . Using the sight lines considered by Savage et al. (2002a), we derive a density for the number of O VI lines per unit redshift with mÅ. Therefore, we expect to find no more than about one O VI line in the PHL 1811 spectrum. Although we were unable to unambiguously identify both lines of the doublet at any redshift, the best identification of a significant line in Table 4 is O VI near the redshift of the LLS (line nr. 151).101010The line corresponding with line nr. 151 is difficult to measure due to blending with Galactic Fe II absorption. Another candidate line, nr. 148 associated with the system at , represents a marginal detection below our conservative mÅ threshold. It therefore appears that our PHL 1811 findings are generally consistent with the results of previous studies of O VI systems.
6 Relationships between Galaxies and Absorption Systems
6.1 Galaxy G158 at
The galaxy we designate as G158 is at a redshift of and lies only 34 kpc from the line of sight of PHL 1811. We have been able to measure an -band magnitude of , or . The galaxy therefore has a luminosity of [assuming from Lin et al. (1996)] and its major axis is aligned perpendicular to the sightline (see Fig. 8). It is obviously tempting to directly associate this absorber with the LLS at , and below we discuss how the absorbing gas may be related to the galaxy. The association is particularly intriguing, given that the absorption is likely to arise in a multiphase medium, since it shows, e.g., C II, N II Mg II, and O I, as well as C III and, possibly, O VI (Table 4).
We begin by looking at the Mg II lines of the LLS, since much is already known about the absorbing galaxies identified with Mg II systems at . Mg II is detected in the G230L STIS spectrum of PHL 1811 at a redshift of 0.08093 with rest equivalent widths of mÅ and mÅ (see Table 6). Mg I is also marginally detected, with mÅ. After the initial detections of Mg II absorbing galaxies (Bergeron 1986; Cristiani 1987), more extensive surveys have led to the conclusion that all galaxies should have Mg II absorbing cross-sections of radii
| (1) |
for systems with rest-frame equivalent width limits Å. The values of and depend on the color in which the galaxies are observed, but the differences are small, with kpc, , for galaxies with -band luminosities and kpc, , for galaxies measured in the -band (Steidel 1995). We do not have -band magnitudes for our galaxies, but we can assume that the halo size-luminosity relationship for galaxies in the -band is close to that in the -band. We would then predict that the Mg II absorbing radius would be kpc. In fact, the equivalent widths of the Mg II lines at towards PHL 1811 are less than the Å limit for the high- Mg II absorbing galaxies. For weaker lines, the fiducial radius of an absorbing galaxy may increase from 50 kpc to more than 85 kpc, depending on the properties of the population of absorbers giving rise to the weak lines (Churchill et al. 1999). Clearly then, the higher redshift data indicate that we should indeed detect Mg II at the observed radius of kpc for G158.
Although the size of the intermediate redshift Mg II absorbers has been examined in detail, the exact origin of the absorption is still under investigation, and numerous explanations have been suggested to account for the data. For example, Steidel et al. (2002) have recently contributed to the notion that extended, diffuse galactic disks might explain the Mg II systems (Wagoner 1967; Bowen 1991; Lanzetta & Bowen 1992; Charlton & Churchill 1996, 1998; Churchill & Vogt 2001). They find evidence that the thick co-rotating disks of identified Mg II absorbing galaxies whose major axes are closely pointing towards a QSO sightline can explain the kinematical substructure of the absorption complexes.
Towards PHL 1811, we can examine whether the disk of G158 might also be responsible for the LLS absorption, using a prescription such as that given by Rubin et al. (1987). The axial ratio of G158 is which gives an inclination of , while the angle between the major axis of the galaxy and the sightline is 89∘. On the one hand, the sightline to PHL 1811 passes very close to the extension of the galaxy’s minor axis, and we would expect the velocity of the absorption to be close to the systemic velocity. Indeed, we find this to be the case, at least to the precision with which we are able to measure the redshift of G158. We also expect to see little or no kinematic substructure in the metal lines, again because the sightline intercepts material with a radial velocity component along the sightline of zero . In keeping with this model, Figure 1 shows that the lines comprising the LLS show little complexity, at least on scales larger than the km s-1 resolution of the data.
On the other hand, given the inclination of G158 to the sightline, if a galaxy disk were responsible for the absorption, then it would have to have a projected radius of kpc in order to intercept the sightline. This may be too large for even a gas-rich galaxy: such a galaxy should have an H I radius at a limiting column density of (H I) of kpc (Bowen, Blades, & Pettini 1995). We know from the presence of the Lyman limit absorption and the lack of damping wings in the profile of the Ly line that the H I column density is in the range (H I). Neutral hydrogen in galaxy disks is expected to be sharply truncated, extending perhaps only 10% further between (H I) and 17.0 (Maloney 1993). Hence for G158, these models suggest that a drop in (H I) with radius of 2 dex may not leave a high enough H I column density at a projected radius of kpc (compared to the observed value). Still, extended H I disks with and radii many times the optical extent of galaxies have been known for some time [see, e.g. Fig 1 of Hibbard et al. (2001)111111Also http://www.nrao.edu/astrores/HIrogues/Rogues.html] and an extended gaseous disk may be a plausible explanation for the observed absorption.
There are several other possibilities to explain the origin of the absorbing material. Gas may arise in a dwarf satellite which lies directly along the sightline but which cannot be resolved in our image. Or perhaps gas produced from previous episodes of star formation and deposited by galactic outflows may be situated in the same dark matter structures that the galaxy inhabits. Also, there could be dynamic stripping via interactions with other galaxies. It is of interest to note that there exists a second galaxy at almost an identical redshift to G158 and the absorption system, namely G169, which lies 87 kpc from the PHL 1811 sightline. It is possible therefore that the line of sight passes through a group of galaxies, and that the absorbing material could be intragroup gas, or perhaps more directly, tidal debris which exists from a previous encounter between G158 and G169. Indeed, there is some evidence in Figure 8 for some extended emission to the south-east of G169 which might indicate a disturbed stellar population. A deeper image of the field is clearly needed to investigate this further. The redshifts of G158 and G169 as given in Table 7 differ by 110 km s-1, but there is an error of and 100 km s-1 on the estimate of each of the redshifts. Since the signal-to-noise of both galaxy spectra are high, we can also cross-correlate the spectra with each other, to better estimate the velocity difference between the two galaxies. Again using the IRAF routine fxcor, we derive a difference in radial velocity of km s-1. This value is consistent with examples of two galaxies undergoing interactions in the local universe.
The metal lines of the system are not particularly complex, as might be expected from tidal debris distributed over several hundred km s-1 [e.g., Bowen et al. (1994)]. Nevertheless, the sightline to PHL 1811 need not pass through the bulk of the detritus, but could skirt the outlying regions of a tidal tail. Also, other absorption systems lie nearby in velocity, and these could in principle arise from tidal debris. Relative to the absorber, the , 0.07779 and 0.07344 systems have velocity differences of , and km s-1. Theoretical models of tidal tails in interacting pairs suggest that tails are most readily formed when the dark matter potential of the galaxies is not too deep, so that the escape velocity of the gas is at most a few times the circular rotation speed of the galaxy (Dubinski, Mihos, & Hernquist 1999). Given that most galaxies have rotation curves extending out to 300 km s-1, tidal debris with a velocity difference of km s-1 is not out of the question, particularly when there exist examples in the local universe where the total extent of H I detected at 21 cm [i.e. (H I)] spans such a velocity range [e.g., NGC 4676 (Hibbard & van Gorkom 1996), or the Magellanic Stream (Wakker 2001)]. However, there are few unambiguous examples of tidal tails with velocity gradients of km s-1, so the presence of the other two absorption systems is much harder to understand in terms of tidal interactions. Of course, the velocity extent of H I debris with column densities below that detectable from 21 cm emission measurements is not known, and could be much larger for low (H I) clouds.
Yet, the apparent congregation of three absorption systems within 900 km s-1 of the LLS, if not simply coincidental, may also suggest that these systems, as well as the LLS itself, arise in structures associated with intragroup, or perhaps, intracluster gas. As noted above, our exploratory redshift survey has covered a cross-section with a radius of only 179 kpc, and there may be more group galaxies than the two identified outside this region. Galaxies within compact groups can have velocity dispersions of up to 1000 km s-1 [e.g., HCG 23 (Williams & van Gorkom 1995)], or can even be embedded in single H I clouds with velocity gradients of 400 km s-1 at H I column densities of cm-2 [e.g., HCG 26 (Williams & van Gorkom 1995)]. Hence the velocity differences seen between the LLS and the two lower redshift absorbers could be explained in terms of intragroup gas from a compact group. Still, the galaxies comprising the group around PHL 1811 could be less compact and form a looser group or cluster. More extensive redshift information is needed to test this hypothesis.
Recently, Bowen et al. (2002) proposed that the strength of a low redshift Ly line complex is governed principally by the density of galaxies along a sightline. Ly lines are seen in the G140L spectrum from the LLS, but at a resolution of , individual components at , 0.07900 and 0.07779 are blended together. Nevertheless, the total rest-frame equivalent width of the three systems is 1.73 Å, which Bowen et al. predict should mark the presence of a dense group of galaxies. We note that a Ly line is possibly detected from the lowest redshift system at ; however, most of the observed line is more likely to be strong Milky Way O I and Si II , which is expected at about the same wavelength.
6.2 Other galaxies in the field of PHL 1811
6.2.1 Galaxies with Redshifts at (QSO)
G142 is at a redshift of 0.1917 and lies only 22 kpc from the QSO sightline. We detect no features in the FUSE spectrum at this redshift, but a weak Ly line is visible in the STIS G140L spectrum at 1447.2 Å, or . Although in principle we might expect to see a rich absorption system from a galaxy so close to the sightline of PHL 1811, the redshift of the system is close to that of the QSO emission redshift. Hence, the galaxy could actually be behind the QSO, or be affected by the intense ionizing flux from PHL 1811 itself. If correctly identified as Ly, the weakness of the line could be because the interstellar gas in the disk and/or halo of G142 is more highly ionized than in more typical intervening absorbing galaxies, or the line could simply arise in material associated with the QSO itself and have nothing to do with G142.
G142 is not alone in being at the same redshift as PHL 1811. G151 is at a redshift of , and lies only 90 kpc to the line of sight. This is likely to be a member of the group which PHL 1811 inhabits.
6.2.2 Galaxies with Redshifts (QSO)
We have identified three other galaxies close to the line of sight of PHL 1811 which have redshifts lower than the QSO emission redshift. G82 is a galaxy at a redshift of , lying 220 kpc from the QSO sightline. Although the exact relationship between galaxies and Ly lines at remains controversial, detailed studies by Chen et al. (2001) (and references therein) claim that galaxies of all types are surrounded by Ly absorbing halos of radii 260 kpc or less for Ly equivalent widths Å. Hence weak Ly absorption is expected from G82 if this conclusion holds true. The G140L spectrum in fact shows two partially blended Ly lines at and 0.13541 ( km s-1) with rest-frame equivalent widths of and 0.31Å, respectively. The detection of the first of these systems at the same redshift as G82 is therefore roughly consistent with the results obtained at higher redshift. We note however, that numerical simulations which model how galaxies and gas collapse together to form Large Scale Structure (LSS) show that the scatter is large in the relationship between the predicted Ly equivalent width and the impact parameter of the nearest bright galaxy (Davé et al. 1999). G82 may therefore be simply a galaxy in a common dark matter envelope shared by the Ly-absorbing cloud.
G209 is a galaxy which lies 340kpc from the QSO sightline. Again, given this large distance we do not expect to see strong ( Å) Ly absorption at the redshift of G209. In fact, a Ly line is detected at with Å, close to the redshift of G209 of . On the one hand, if galaxies and absorption systems are directly related, the “real” absorber must lie closer to the line of sight and be currently unidentified. On the other hand, G209 and the Ly absorption may only be related by sharing the same LSS.
Finally, G102 () is a 0.3 edge-on galaxy which should also fail to show Ly absorption, since it lies 350kpc from the sightline to PHL 1811. A line can be seen close to the expected redshift at 1408 Å, but we actually identify it to be a blend of O I and Si II at the redshift of the LLS.
7 Galactic Features
7.1 Low Velocity Material
The imprint of many lines from the Lyman and Werner bands of H2 from the to 4 rotational levels dominate the spectrum of PHL 1811 below about 1110 Å (see Table 3). The column density of H2 is difficult to estimate since lines out of and 1 are strongly saturated, as indicated by the flatness of a curve of growth for lines spanning a factor of 4 in strength. To express a lower limit for , we note that if the weakest line out of were not badly saturated, we would obtain a column density of about . This number is probably well below the actual column density however.
The only atomic hydrogen feature from the Galaxy in the FUSE spectrum that is visible is Ly (line nr. 56 in Fig. 1 and Table 3). This feature is very broad and nearly box-shaped, without any indications of damping wings. For this reason, it is difficult to determine – a situation similar to our problem with the LLS at .
There is a strong feature (line nr. 64) at the position of the O VI transition at 1031.93 Å, also reported by Wakker et al. (2002) from the same FUSE exposure, but no obvious half-strength counterpart is seen at 1037.62 Å, aside from a depression of flux between two other features. Our identifications of extragalactic gas systems toward PHL 1811 lead to no alternative candidates for the absorption at the location of the O VI feature at low velocity. Savage et al. (2002b) report that .
7.2 High Velocity Material
A high velocity cloud at is apparent in the strongest atomic lines we can view, C II (line nr. 67 in Fig. 1 and Table 3) and Mg II (nrs. 1 and 3 in Fig. 7 and Table 6). The low-velocity H I Ly line is too broad to distinguish this feature, and the higher Lyman lines are obscured by the Lyman limit absorption by the system. Strong lines of less abundant species are not evident at this velocity.121212A line at the correct relative location to the strong Fe II line is not from the high velocity cloud. It is the Ly feature (line nr. 169 in Table 4) of the system at .
The high velocity cloud may be associated with the widely scattered group of clouds called complex GCN [reviewed by Wakker (2001)] with velocities ranging from to about in the same general region of the sky. Mkn 509, 175 away from PHL 1811, shows absorption features at and (Sembach et al. 1995, 1999) that are attributed to this complex.
The Mg II lines have transition probabilities that differ from each other by a factor of 2. Since our measured ratio of their equivalent widths is 1.22 in the high-velocity gas, they must be strongly saturated. Thus, we can assume that the weaker line has (corresponding to a true doublet ratio ), which leads to and . For an upper limit, one may assume that is very small and the stronger line is on the damping portion of the curve of growth. With its measured equivalent width plus a 1- error, we find that If we apply the upper limit for from the Mg II lines to interpret the C II line recorded by FUSE, we find that the line’s central optical depth is large: , which leads to a lower limit . Using the same argument that we applied for the strong Mg II line, we obtain . If we assume the gas has solar abundance ratios for Mg and C of 7.54 and 8.39 (on logarithmic scale where H=12.00) determined by Holweger (2002) and Allende Prieto, Lambert & Asplund (2002), respectively, we estimate that the neutral hydrogen column density and 18.2 for the lower limits of (Mg II) and (C II). These column densities are at about the detection threshold of the Leiden-Dwingeloo 21-cm survey of Hartmann & Burton (1997). No high-velocity feature is seen in the direction nearest PHL 1811 (, ), but it is possible that a small wisp of gas in front of the quasar could be diluted by the large telescope beam.
O VI profiles at high negative velocities have been identified by Wakker et al. (2002). One component of this complex has in the velocity interval , while the other shows at velocities (Sembach et al. 2002). Unfortunately, as we pointed out in §5.1 these features coincide with the two strongest N I features in the LLS (). At present, there is no way to resolve this ambiguity in the identification of the lines. However, it seems more plausible to assert that the lines arise from Galactic O VI at large negative velocities, since the nitrogen identification would require an overabundance [N/O] to apply to the LLS.
8 Summary and Conclusions
Our primary intent in performing a short, exploratory observation of PHL 1811 with FUSE was to learn if the object was bright enough to warrant further spectroscopic investigations. We found that the far-UV flux of this object in the FUSE wavelength band, Å-1, compares favorably with extrapolations from longer wavelengths. In addition to showing that high S/N spectra of PHL 1811 can be attained in reasonable observing times for either FUSE or HST, the spectrum exhibits a diverse set of intervening systems. We have here a case that promises benefits in understanding low- gas systems that may measure up to the findings that have recently been derived from the brightest known quasar in the sky, 3C273 (Sembach et al. 2001; Tripp et al. 2002). A mildly disappointing but not unexpected result is that Galactic H2 features in the FUSE spectrum result in the loss of many extragalactic lines. Even so, a total of 36 of them were free from blending at the resolution of FUSE, and we could measure their equivalent widths (but in some cases the values were less than their errors). Moreover, high resolution observations at longer wavelengths with HST should overcome the problem of blockage from H2 features.
Over a redshift path , we have identified 7 absorption systems at redshifts , 0.07779, 0.07900, 0.08093, 0.13225, 0.13541 and 0.17651, plus another 4 possible systems that show only Ly in our low resolution STIS spectrum. The 7 systems that we feel are securely identified, or groups thereof, show Ly features with rest-frame equivalent widths in excess of about 300 mÅ. The normal expectation for finding such systems is about half the yield that we obtained, since the product of our and general result for (Bahcall et al. 1993; Penton, Shull, & Stocke 2000) equals only 3.5. Likewise, we were very fortunate to find a Lyman limit system (the LLS at ). For a random line of sight we would have had only a 6% chance of intercepting one, if we extrapolate the average number density of such systems measured by Stengler-Larrea et al. (1995) to , , and then multiply it by our .
While the H I column density of the LLS is very uncertain, we were able to carry out rudimentary measurements of the amounts of O I and Fe II present, subject to the assumption that the absorption features are not strongly saturated. We interpret our finding that [Fe/O] to suggest that either there is little depletion of refractory elements by the formation of dust grains, or that if such depletion exists, it is approximately counterbalanced by an excess abundance of Fe compared that expected from solar abundances. Unfortunately, a coincidence in the expected positions of the strongest N I features with those of high-velocity Galactic O VI blocks our attempt to derive secure conclusions on the nitrogen abundance. However, we expect to be able to measure N abundances and compare them to O as soon as we obtain an HST observation of PHL 1811 using the STIS E140M grating.131313Observations of PHL 1811 using the STIS E140M grating are currently scheduled for Cycle 11 (Program ID=9418). This observation will cover the 1200 Å multiplet of N I and the 1302 Å line of O I. These lines have -values similar to the ones reported here for the FUSE spectrum, and the 3 lines of N I would offer guidance on the amount of saturation through a standard curve-of-growth analysis.
From our imaging of the field around PHL 1811 coupled with spectroscopic measurements of galaxy redshifts, we conclude that the LLS at in front of PHL 1811 is likely to be associated with an galaxy (G158) which lies 34kpc off the sightline. A second galaxy (G169) at a similar redshift lies 88kpc away, and may be interacting with the nearer galaxy. Absorption may arise in the disk of G158, although the disk would need to be much larger than would be typical for a galaxy of its luminosity. Absorption could arise in the halo of G158, but the existence of two other absorption systems within only 900 km s-1 of the LLS suggest that the galaxy and the system itself may be part of a larger structure, and that the absorption systems could be signatures of intragroup, or intracluster, gas.
References
- (1)
- (2) Abgrall, H., & Roueff, E. 1989, A&AS, 79, 313
- (3)
- (4) Allende Prieto, C., Lambert, D. L., & Asplund, M. 2001, ApJ, 556, L63
- (5)
- (6) — 2002, ApJ, 573, L137
- (7)
- (8) Bahcall, J. N., Bergeron, J., Boksenberg, A., Hartig, G. F., Jannuzi, B. T., Kirhakos, S., Sargent, W. L. W., Savage, B. D., Schneider, D. P., Turnshek, D. A., Weymann, R. J., & Wolfe, A. M. 1993, ApJS, 87, 1
- (9)
- (10) Bergeron, J. 1986, A&A, 155, L8
- (11)
- (12) Boesgaard, A. M., & Steigman, G. 1985, ARA&A, 23, 319
- (13)
- (14) Bowen, D. V. 1991, MNRAS, 251, 649
- (15)
- (16) Bowen, D. V., Blades, J. C., & Pettini, M. 1995, ApJ, 448, 634
- (17)
- (18) Bowen, D. V., Pettini, M., & Blades, J. C. 2002, ApJ, 580, 169
- (19)
- (20) Bowen, D. V., Roth, K. C., Blades, J. C., & Meyer, D. M. 1994, ApJ, 420, L71
- (21)
- (22) Charlton, J. C., & Churchill, C. W. 1996, ApJ, 465, 631
- (23)
- (24) — 1998, ApJ, 499, 181
- (25)
- (26) Chen, H.-W., Lanzetta, K. M., Webb, J. K., & Barcons, X. 2001, ApJ, 559, 654
- (27)
- (28) Churchill, C. W., & Vogt, S. S. 2001, AJ, 122, 679
- (29)
- (30) Churchill, C. W., Rigby, J. R., Charlton, J. C., & Vogt, S. S. 1999, ApJS, 120, 51
- (31)
- (32) Cristiani, S. 1987, A&A, 175, L1
- (33)
- (34) Davé, R., Hernquist, L., Katz, N., & Weinberg, D. H. 1999, ApJ, 511, 521
- (35)
- (36) Dubinski, J., Mihos, J. C., & Hernquist, L. 1999, ApJ, 526, 607
- (37)
- (38) Hartmann, D., & Burton, W. B. 1997, Atlas of Galactic Neutral Hydrogen, (Cambridge: Cambridge Univ. Press)
- (39)
- (40) Hibbard, J. E., & van Gorkom, J. H. 1996, AJ, 111, 655
- (41)
- (42) Hibbard, J. E., van Gorkom, J. H., Rupen, M. P., & Schimonovich, D. S. 2001, in Gas and Galaxy Evolution, ed. J. E. Hibbard, J. H. van Gorkom & J. H. Rupen (San Francisco: Ast. Soc. Pacific), p. 657
- (43)
- (44) Holweger, H. 2002, in Joint SOHO/ACE Workshop: Solar and Galactic Composition, ed. R. F. Wimmer-Schweingruber (New York: AIP), p. 23
- (45)
- (46) Jenkins, E. B. 2002, ApJ, 580, 938
- (47)
- (48) Jenkins, E. B., Savage, B. D., & Spitzer, L. 1986, ApJ, 301, 355
- (49)
- (50) Kerr, F. J., & Lynden-Bell, D. 1986, MNRAS, 221, 1023
- (51)
- (52) Landolt, A. U. 1992, AJ, 104, 372
- (53)
- (54) Lanzetta, K. M., & Bowen, D. V. 1992, ApJ, 391, 48
- (55)
- (56) Leighly, K. M., Halpern, J. P., Helfand, D. J., Becker, R. H., & Impey, C. D. 2001, AJ, 121, 2889
- (57)
- (58) Leitherer, C. 2001, Space Telescope Imaging Spectrograph Instrument Handbook for Cycle 11, 5.1 ed., (Baltimore: Space Telescope Science Institute), p. 455.
- (59)
- (60) Lemoine, M., Audouze, J., Ben Jaffel, L., Feldman, P., Ferlet, R., Hébrard, G., Jenkins, E. B., Mallouris, C., Moos, W., Sembach, K., Sonneborn, G., Vidal-Madjar, A., & York, D. G. 1999, New Astronomy, 4, 231
- (61)
- (62) Lin, H., Kirshner, R. P., Shectman, S. A., Landy, S. D., Oemler, A., Tucker, D. L., & Schechter, P. L. 1996, ApJ, 464, 60
- (63)
- (64) Maloney, P. 1993, ApJ, 414, 41
- (65)
- (66) Mihalas, D., & Binney, J. 1981, Galactic Astronomy Structure and Kinematics, 2nd ed., (New York: Freeman)
- (67)
- (68) Monet, D. et al. 1996, USNO-SA2.0, (Washington: US Naval Obs.)
- (69)
- (70) Moos, H. W. et al. 2000, ApJ, 538, L1
- (71)
- (72) Moos, H. W. et al. 2001, ApJS, 140, 3
- (73)
- (74) Morton, D. C. 1991, ApJS, 77, 119
- (75)
- (76) Morton, D. C. 2000, updated version of Morton (1991) privately circulated to the FUSE investigation team.
- (77)
- (78) O’Meara, J. M., Tytler, D., Kirkman, D., Suzuki, N., Prochaska, J. X., Lubin, D., & Wolfe, A. M. 2001, ApJ, 552, 718
- (79)
- (80) Penton, S. V., Shull, J. M., & Stocke, J. T. 2000, ApJ, 544, 150
- (81)
- (82) Pettini, M., & Bowen, D. V. 2001, ApJ, 560, 41
- (83)
- (84) Rubin, V. C., Thonnard, N., & Ford, W. K. 1987, AJ, 87, 477
- (85)
- (86) Sahnow, D. J. et al. 2000, ApJ, 538, L7
- (87)
- (88) Savage, B. D., & Sembach, K. R. 1996, ApJ, 470, 893
- (89)
- (90) Savage, B. D., Sembach, K. R., Tripp, T. M., & Richter, P. 2002a, ApJ, 564, 631
- (91)
- (92) Savage, B. D., Sembach, K. R., Wakker, B. P., Richter, P., Meade, M., Jenkins, E. B., Shull, J. M., Moos, H. W., & Sonneborn, G. 2002b, astro-ph/0208140
- (93)
- (94) Sembach, K. R., & Savage, B. D. 1992, ApJS, 83, 147
- (95)
- (96) — 1996, ApJ, 457, 211
- (97)
- (98) Sembach, K. R., Savage, B. D., Lu, L. M., & Murphy, E. M. 1995, ApJ, 451, 616
- (99)
- (100) Sembach, K. R., Savage, B. D., Lu, L., & Murphy, E. M. 1999, ApJ, 515, 108
- (101)
- (102) Sembach, K. R., Howk, J. C., Savage, B. D., Shull, J. M., & Oegerle, W. R. 2001, ApJ, 561, 573
- (103)
- (104) Sembach, K. R., Wakker, B. P., Savage, B. D., Richter, P., Meade, M., Shull, J. M., Jenkins, E. B., Sonneborn, G., & Moos, H. W. 2002, astro-ph/0207562
- (105)
- (106) Steidel, C. C. 1995, in QSO Absorption Lines, ed. G. Meylan (Berlin: Springer), p. 139
- (107)
- (108) Steidel, C. C., Kollmeier, J. A., Shapley, A. E., Churchill, C. W., Dickinson, M., & Pettini, M. 2002, ApJ, 570, 526
- (109)
- (110) Stengler-Larrea, E. A., Boksenberg, A., Steidel, C. C., Sargent, W. L. W., Bahcall, J. N., Bergeron, J., Hartig, G. F., Jannuzi, B. T., Kirhakos, S., Savage, B. D., Schneider, D. P., Turnshek, D. A., & Weymann, R. J. 1995, ApJ, 444, 64
- (111)
- (112) Tonry, J., & Davis, M. 1979, AJ, 84, 1511
- (113)
- (114) Tripp, T. M., Savage, B. D., & Jenkins, E. B. 2000, ApJ, 534, L1
- (115)
- (116) Tripp, T. M., Giroux, M. L., Stocke, J. T., Tumlinson, J., & Oegerle, W. R. 2001, ApJ, 563, 724
- (117)
- (118) Tripp, T. M., Jenkins, E. B., Williger, G. M., Heap, S. R., Bowers, C. W., Danks, A. C., Davé, R., Green, R. F., Gull, T. R., Joseph, C. L., Kaiser, M. E., Lindler, D., Weymann, R. J., & Woodgate, B. E. 2002, ApJ, 575, 697
- (119)
- (120) Wagoner, R. V. 1967, ApJ, 149, 465
- (121)
- (122) Wakker, B. P. 2001, ApJS, 136, 463
- (123)
- (124) Wakker, B. P. et al. 2002, astro-ph/0208009
- (125)
- (126) Walker, T. P., Steigman, G., Kang, H.-S., Schramm, K. M., & Olive, K. A. 1991, ApJ, 376, 51
- (127)
- (128) Williams, B. A., & van Gorkom, J. H. 1995, in Groups of Galaxies, ed. O.-G. Richter & K. Borne (San Francisco: Ast. Soc. Pacific), p. 77
- (129)