Nearly 5000 Distant Early-Type Galaxies in COMBO-17:
a Red Sequence and its Evolution since
Abstract
We present the rest-frame colors and luminosities of galaxies in the redshift range , drawn from 0.78 square degrees of the COMBO-17 survey. We find that the rest-frame color distribution of these galaxies is bimodal at all redshifts out to . This bimodality permits a model-independent definition of red, early-type galaxies and blue, late-type galaxies at any given redshift. The colors of the blue peak become redder towards the present day, and the number density of blue luminous galaxies has dropped strongly since . Focusing on the red galaxies, we find that they populate a color-magnitude relation. Such red sequences have been identified in galaxy cluster environments, but our data show that such a sequence exists over this redshift range even when averaging over all environments. The mean color of the red galaxy sequence evolves with redshift in a way that is consistent with the aging of an ancient stellar population. The rest-frame -band luminosity density in red galaxies evolves only mildly with redshift in a -dominated cold dark matter universe. Accounting for the change in stellar mass-to-light ratio implied by the redshift evolution in red galaxy colors, the COMBO-17 data indicate an increase in stellar mass on the red sequence by a factor of two since . The largest source of uncertainty is large-scale structure, implying that considerably larger surveys are necessary to further refine this result. We explore mechanisms that may drive this evolution in the red galaxy population, finding that both galaxy merging and truncation of star formation in some fraction of the blue, star-forming population are required to fully explain the properties of these galaxies.
1 Introduction
The evolution of early-type galaxies since early in the Universe’s history is a highly active area of research. The current world model for the evolution of the Universe is the Cold Dark Matter paradigm; the incarnation which appears consistent with most observations adopts , , and km s-1 Mpc-1, where (the CDM paradigm; e.g., Freedman et al., 2001; Efstathiou et al., 2002; Pryke et al., 2002; Spergel et al., 2003). In this model, early-type galaxies form hierarchically through mergers of pre-existing galaxies (e.g., White & Frenk, 1991; Barnes, 1992; Cole et al., 2000). A generic prediction of this type of model is an increase in the stellar mass density of the early-type galaxy population since , as large galaxies are assembled primarily at relatively late times (e.g., Aragon-Salamanca, Baugh, & Kauffmann, 1998; Kauffmann & Charlot, 1998). Therefore, an important test of the hierarchical formation scenario is to quantify the evolution of early-type galaxies since . In this paper, we discuss the color distributions of a sample of galaxies from the COMBO-17 survey (‘Classifying Objects by Medium-Band Observations in 17 Filters’; Wolf et al., 2003), focusing on an objective definition of early-type galaxies at all redshifts. We then use this objectively-defined sample of early-type galaxies with to examine the evidence for a substantial build-up of stellar mass in red galaxies since .
In the local Universe, early-type galaxies have historically been defined in terms of morphology. Loosely speaking, galaxies with dominant smooth spheroidal components, and at most a modest and smooth disk, will be classified as an ‘early-type’ galaxy. These galaxies tend to be red in optical color both locally (e.g., Schweizer & Seitzer, 1992) and out to (e.g., Kodama, Bower, & Bell, 1999). This definition of early-type galaxies is being challenged by the recent demonstration that galaxies are distributed in color space in a bimodal distribution (see, e.g., Strateva et al., 2001; Hogg et al., 2002; Blanton et al., 2003a). One peak is red, and consists mostly of non-star-forming galaxies earlier than Sa in morphological type. The other peak is blue and consists primarily of star-forming galaxies later than Sb in morphological type (Strateva et al., 2001). Because of this bimodality in color and therefore star formation history (SFH), it is defensible, and perhaps more natural, to define early types in terms of colors (i.e., spectral energy distribution or SFH). These different definitions seem largely consistent (e.g., Schweizer & Seitzer, 1992; Strateva et al., 2001; Bell et al., 2003, 2004). In this paper, we split the galaxy population into red and blue subsets based on their rest-frame optical colors, exploring the evolution of these populations with cosmic time.
In the local Universe, the blue-peak galaxies (later types) show a scattered but systematic variation of color with magnitude, in the sense that luminous galaxies tend to be somewhat less blue (e.g., Tully et al., 1998; Hogg et al., 2002). These color changes, when examined in detail, are due to changes in the mean ages, metallicities, and dust contents of galaxies with galaxy magnitude, such that brighter galaxies tend to be older, dustier, and more metal-rich (see, e.g., Tully et al., 1998; Bell & de Jong, 2000). In contrast, red-peak galaxies (earlier types) have a tighter and well-defined relationship between color and magnitude, such that bright galaxies are typically redder (e.g., Sandage & Visvanathan, 1978; Bower, Lucey, & Ellis, 1992; Schweizer & Seitzer, 1992; Terlevich, Caldwell, & Bower, 2001). This color-magnitude relation (CMR) is well-established in overdense and cluster environments, where early-type galaxies are much more common (Dressler, 1980; Dressler et al., 1997). Nevertheless, the CMR also exists among present-day field early-type galaxies (e.g., Sandage & Visvanathan, 1978; Schweizer & Seitzer, 1992; Hogg et al., 2003). The scatter, slope and evolution of the CMR in clusters of galaxies are all consistent with the interpretation of the CMR as primarily a metallicity sequence of old galaxies, where more massive galaxies are more metal-rich (e.g., Bower, Lucey, & Ellis, 1992; Kodama & Arimoto, 1997; Vazdekis et al., 2001; Bernardi et al., 2003). A modest age spread is possible (Trager et al., 2000).
The evolution of the properties of individual early-type galaxies with redshift has been studied in clusters of galaxies, where the assembly of sizeable galaxy samples has been feasible. It appears as if individual early-type galaxies were formed relatively quickly at high redshift and simply aged to the present day through so-called passive evolution (e.g., Kodama & Arimoto, 1997; Kelson et al., 2001; van Dokkum et al., 2003). This has been used to justify ‘monolithic collapse’ models of early-type galaxy formation, where these galaxies form quickly early in the history of the Universe, and simply age to the present day (e.g., Eggen, Lynden-Bell, & Sandage, 1962; Larson, 1975; Kodama & Arimoto, 1997; Nulsen & Fabian, 1997). Yet, monolithic collapse, at best, is mildly unphysical; the hierarchical build-up of galaxies through mergers and interactions must happen at some level (e.g. White & Frenk, 1991).
An elegant interpretation of the apparent contradiction between seemingly passive evolution and the hierarchical build-up of early-type galaxies has been put forward by van Dokkum & Franx (2001, progenitor bias). They note that studies of the properties of early-type galaxies in isolation (rightfully) fail to study the star-forming precursors of galaxies that are later destined to become early types. Thus, individual early-type galaxies appear old at all redshifts regardless of whether they were formed in a burst at redshift infinity or whether their formation happens through violent mergers which consume all of the gas in the interacting galaxies, leaving a spheroidal remnant (e.g., Toomre & Toomre, 1972; Barnes & Hernquist, 1996). This is a common theme in many contemporary studies of early-type galaxies; the distinction between when the stars in early-type galaxies were formed, and when the galaxies were assembled into recognizable entities. Studies of galaxies selected by strong gravitational lensing largely avoid this bias by selecting by mass (e.g., Kochanek et al., 2000; Rusin et al., 2003; van de Ven, van Dokkum, & Franx, 2003); yet, these studies also find rather ancient-looking stellar populations.
Thus, a more important constraint on the evolution of early-type galaxies — and therefore, a stronger test of galaxy formation models — is the evolution of their number density and luminosity function (whether the early-type galaxy population is defined by morphology or color). Here, the situation is somewhat less clear. Many studies find that the evolution of the early-type population is close to passive up to , with perhaps a slight decrease in number density above (e.g., Lilly et al., 1995; Schade et al., 1999; Lin et al., 1999; Cimatti et al., 2002; Firth et al., 2002; Im et al., 2002; Chen et al., 2003; Pozzetti et al., 2003). Other studies find relatively rapid evolution. For example, Kauffmann et al. (1996) find number evolution of a factor of three by , although Totani & Yoshii (1998) argue that spectroscopic incompleteness causes this apparent evolution, and state that Kauffmann et al’s results are consistent with passive evolution. Wolf et al. (2003) find a rapid increase in the luminosity density of galaxies with the colors of present-day early-type galaxies from until the present day; yet, passive evolution and reddening of the galaxy population is likely responsible for much of this.
Nevertheless, a problem shared by most surveys of early-type galaxies at has been susceptibility to large scale structure. Surveys to date have typically had samples of only early-type galaxies (e.g., Kauffmann & Charlot, 1998; Schade et al., 1999; Lin et al., 1999; Firth et al., 2002; Chen et al., 2003; Pozzetti et al., 2003). Furthermore, these samples are usually from relatively small areas on the sky (the largest are CNOC2 and the LCIRS with 1400 square arcminutes each; Lin et al., 1999; Chen et al., 2003). Worse still, early-type galaxies are strongly clustered (e.g., Dressler, 1980; Dressler et al., 1997; Moustakas & Somerville, 2002; Daddi et al., 2002), which means that the measured number evolution is particularly sensitive to large-scale structure. Thus, to accurately measure the evolution of the stellar mass in early-type galaxies, it is necessary to use large samples drawn from large areas on the sky.111The cosmic variance error decreases by a factor of two for more than an order of magnitude increase in comoving volume probed (if the area is contiguous), or for a factor of four increase in the number of independent pointings (Somerville et al., 2004). Therefore, to derive an accurate cosmic average a survey with many independent pointings is ideal. Typically, surveys cover a few independent pointings for practicality; ours is no exception.
In this paper, we bring the largest present-day sample of galaxies with to bear on this important problem. The COMBO-17 survey has to date imaged and fully analyzed three 0.25 square degree fields in 5 broad-band and 12 narrow-band filters (data for a fourth field has been taken but is not yet analyzed). The 5 broad and 12 narrow-bands allow the construction of photometric redshifts and rest-frame colors with extraordinary precision (one can think of the data as a ultra-low resolution spectrum rather as a photometric dataset), yielding galaxy redshifts accurate to a few percent for a total sample of galaxies in 0.78 square degrees (2800 square arcminutes) with . We use this sample to discuss the colors of galaxies with , focusing particularly on the reddest galaxies at all redshifts. We put forward an objective definition of early-type galaxies, and use this definition to explore the evolution of the red galaxy population from redshift unity to the present day.
This paper is set out as follows. The COMBO-17 survey and the main sources of error are briefly discussed in §2. In §3, we explore the colors of the entire COMBO-17 galaxy population with . Then, in §4, we focus on the reddest galaxies at all redshifts, exploring their CMR in more detail. Defining early-type galaxies as galaxies on the CMR, we then go on in §5 to explore the evolution of the luminosity function of red galaxies. We discuss the results in §6, and present the conclusions in §7. Throughout, we assume , , and km s-1 Mpc-1. In order to estimate the passive evolution of stellar populations as a function of lookback time, we adopt to be consistent with the Hubble Space Telescope Key Project distance scale (Freedman et al., 2001) and the recent results from the Wilkinson Microwave Anisotropy Probe (Spergel et al., 2003).
2 The Data
The COMBO-17 data, the sample selection, redshift estimation, construction of rest-frame luminosities, and completeness are all discussed in detail by Wolf et al. (2003, W03 hereafter), Wolf et al. (2001a, W01 hereafter), Wolf et al. (2001b), and in a forthcoming technical paper (Wolf et al., in preparation). Here, we briefly discuss the relevant limitations and sources of uncertainty in the COMBO-17 data.
2.1 Data and Sample Selection
To date, the COMBO-17 project has surveyed 0.78 square degrees to deep limits in three pointings of the Wide Field Imager (WFI; Baade et al., 1998, 1999) at the Max Planck Gesellschaft/European Southern Observatory 2.2-m telescope at La Silla, Chile. COMBO-17 targeted the Chandra Deep Field South, an equatorial field, and a field centered on the Abell 901 cluster (for the coordinates of the three fields, see W03). We study the galaxy population at , therefore the presence of the low- Abell 901 cluster of galaxies in one of the survey fields will not significantly bias our analysis. The WFI has eight 2k4k CCDs, a field of view of , and a pixel scale of /pixel. A total of ksec per field were taken in 5 wide and 12 medium passbands with 3640ÅÅ; an ultra-deep 20ksec -band with seeing below and a limiting magnitude of 25.2, and deep and 12 medium passbands designed to allow the construction of low-resolution spectra, or equivalently accurate photometric redshift estimates, for a total of objects with . The comoving survey volume is Mpc3 in the interval , split between three disjoint roughly equally-sized fields.
Galaxies were detected in the deep -band frames using SExtractor (Bertin & Arnouts, 1996), and we adopt the mag-best magnitude as our total magnitude estimate (a Kron, 1980, magnitude in uncrowded regions). Bertin & Arnouts (1996) show that this magnitude underestimates the flux in galaxies by 6%. We do not correct for this effect as almost all local galaxy surveys adopt similarly biased Kron or Petrosian magnitudes (e.g., Blanton et al., 2003b; Skrutskie et al., 1997). The spectral shapes for -band detected objects were measured by performing seeing-adaptive, weighted aperture photometry in all 17 frames at the position of the -band detected object using the package mpiaphot (Röser & Meisenheimer, 1991, Meisenheimer et al., in preparation). This package measures the peak surface brightness of all of the images smoothed to identical seeing () to maximize signal-to-noise, allowing one to construct the best possible photometric redshifts. Thus, the colors are essentially total for distant objects and are central colors for more extended, nearby galaxies. The effects of this aperture bias are mild, and are discussed later in §4. Photometric calibration was achieved using spectrophotometric standards in each COMBO-17 field. All magnitudes are quoted in Vega-normalized magnitudes. The median galaxy in our sample with has observed galaxy magnitude errors of mag, mag, mag, and for the medium passbands increasing from 0.03 mag at the red end to 0.2 mag at the blue end.
2.2 Photometric Redshifts, Spectral Templates and Rest-Frame Colors
The full survey dataset is photometrically classified into stars, galaxies and AGN using the 17-passband ‘fuzzy’ spectrum (W01). No attempt is made to use morphological information, as, for example, double stars may contaminate the galaxy catalog, and compact galaxies may contaminate the stellar or AGN catalogs. For galaxy classification, we use Pégase (see Fioc & Rocca-Volmerange, 1997, for an earlier version of the model) model spectra. The template spectra are a two-dimensional age/reddening sequence, where a fixed exponential star formation timescale Gyr is assumed, ages vary between 50 Myr and 10 Gyr and the reddening can be as large as 0.5 mag, adopting a Small Magellanic Cloud Bar extinction curve222This classifier uses a different template set from W03, who use empirical templates from Kinney et al. (1996). This completely model-based (somewhat unphysical) template set results in superior photometric redshifts to the template set used by W03. Owing to the almost complete age/metallicity/dust degeneracy, we attach no significance to the physical parameters used to derive the new template set.. These spectra are defined in the interval 1216Å for elliptical through to starburst galaxies. Trustworthy templates shortwards of 1216Å have not yet been included, limiting redshift measurements at this stage to . For our subsequent analysis the redshift range is further limited to in order to have at least two filters redwards of the 4000Å break. The template library does not evolve, and cannot perfectly describe spectral types which are highly unusual in the local Universe, such as post-starburst EA galaxies. Furthermore, low-luminosity or type 2 AGN will be misclassified as galaxies, sometimes leading to increased redshift errors. For galaxies and AGN, galaxy redshifts are estimated simultaneously with the template type (W01). A description of an earlier version of this methodology was presented by W03, and a full description and analysis of these photometric redshifts and classifications will be presented by Wolf et al. (in preparation).
The galaxy redshift estimate quality has been tested by comparison with spectroscopic redshifts for many hundreds of galaxies (see Wolf et al., in preparation). The redshift quality depends primarily on apparent magnitude, and is in excellent agreement with the simulations of Wolf et al. (2001a). At bright limits , the redshifts are accurate to , and the error is dominated by mismatches between template and real galaxy spectra. At the median apparent magnitude , . For the faintest galaxies, redshift accuracy approaches those achievable using traditional broad-band photometric surveys, . Restframe colors and luminosities are constructed on a galaxy-by-galaxy basis by -correcting the nearest observed broad band flux. To estimate this -correction, we convolve the best-fit spectrum with the filter curves for the Johnson , , and passbands. Typical rest-frame color accuracy is mag, corresponding to the redshift uncertainty . Absolute magnitudes have an additional error of mag () and mag () owing to distance uncertainties.
2.3 Completeness
We include only galaxies with successful photometric redshift and spectral classifications. Therefore, when constructing luminosity functions and densities, we must account for the sample completeness. This is done using extensive Monte-Carlo simulations of the galaxy detection, photometry and classification process (W01); example completeness maps are shown in Fig. 7 of W03. For the red galaxies which are the primary aim of this paper, the 90% and 50% completeness limits are at roughly and , respectively.
3 The Color Distribution of Galaxies with
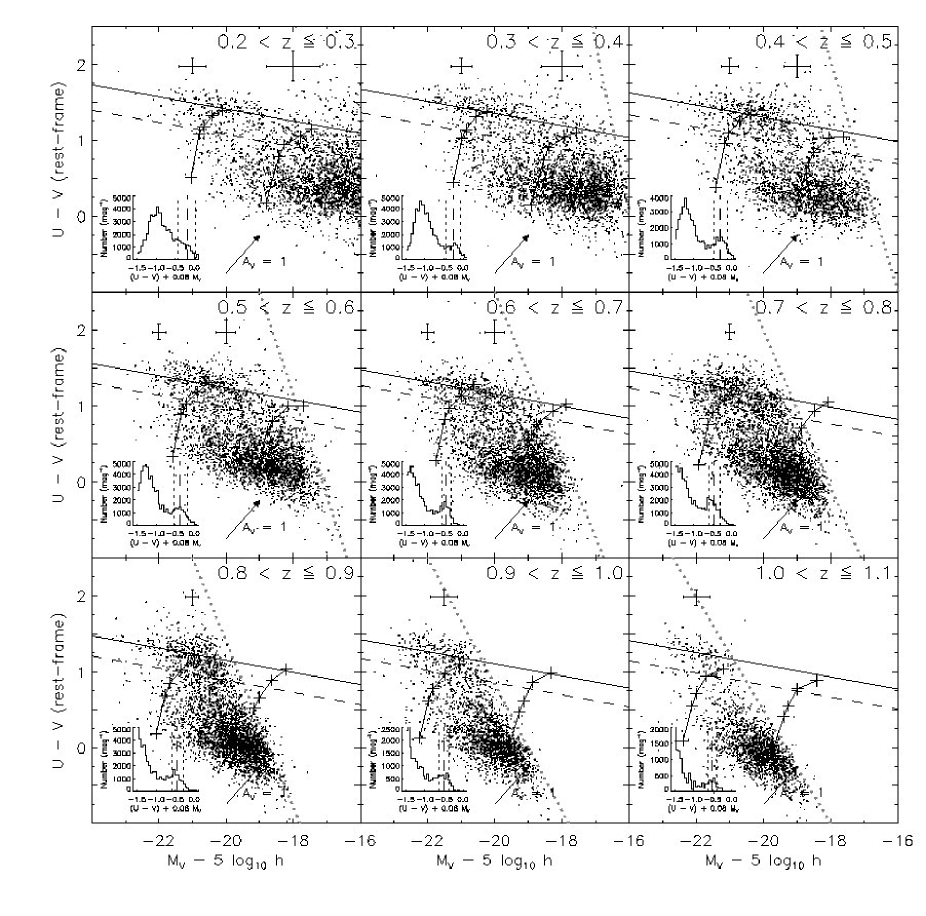
One of the main aims of this paper is to explore and discuss the color distribution of galaxies in the interval . We choose to quantify this in terms of color as a function of -band absolute magnitude, because the color straddles the 4000Å break and is therefore particularly sensitive to age and metallicity variations of the stellar populations in galaxies, and for consistency with well-known works from the literature (e.g., Sandage & Visvanathan, 1978; Bower, Lucey, & Ellis, 1992; Schweizer & Seitzer, 1992). In Fig. 1, we show the distribution of rest-frame galaxy color against the -band absolute magnitude in nine different redshift bins covering .
Fig. 1 shows one of the key observational results of this paper, that the distribution of galaxies in the color–magnitude diagram is bimodal at all redshifts out to . 333It is worth noting that the full range of rest-frame colors is covered smoothly by the template spectra, making it unlikely that the algorithm artificially focuses galaxies away from the gap between the red and blue galaxy sequences. Furthermore, red-sequence galaxies at have , and are the same color as gap galaxies at , arguing further against artificial de-focusing of galaxies to redder or bluer colors. This confirms and extends 9 Gyr back in time the Sloan Digital Sky Survey (SDSS) results from e.g., Strateva et al. (2001), Hogg et al. (2002), or Blanton et al. (2003a), who established and characterized the bimodality of the color distribution of galaxies in the local Universe. Furthermore, this confirms the suggestion of Im et al. (2002), who saw hints of a bimodal color distribution out to .444The Deep2 survey with Keck also appears to find this bimodality (B. Weiner, 2003, priv. comm.) For immediate low-redshift comparison, we show a synthesized color-magnitude diagram for galaxies from the SDSS Early Data Release in the Appendix. We defer a fuller analysis of this bimodality to a future work, but do return to this issue briefly in §6.5.
Beyond the bimodality, it is important to notice two features of Fig. 1. Firstly, the rest-frame colors of blue galaxies become redder (at a given absolute magnitude) from to the present day, probably indicating older mean ages and/or larger dust contents, perhaps with a small contribution from metallicity evolution at a given luminosity. In addition, the number density of blue galaxies, especially at high luminosities, significantly evolves. Because of the different volumes sampled by COMBO-17 in each redshift interval, this strong evolution in the number density of luminous blue galaxies is not apparent in Fig. 1. W03 studied this issue in more detail; when volume-corrected, the number density of faint star-forming galaxies (spectral Type 4) remains almost unchanged, the abundance of luminous galaxies with starburst spectra drops precipitously from redshift unity to the present epoch (Fig. 16 of W03; also, e.g., Cowie et al., 1996). This result, which is discussed much more by W03, also agrees with the CNOC2 (Lin et al., 1999) and CFRS (Lilly et al., 1995) surveys, who found strong evolution in the abundance of star-forming, blue galaxies with redshift. We choose not to elaborate further on the evolving colors or luminosities of star-forming galaxies at this stage.
Secondly, bearing in mind the mag errors in -corrected rest-frame colors, the red galaxies form a relatively well-defined sequence in the color-magnitude plane for . Furthermore, the mean color of this red sequence evolves with redshift, in the sense that galaxies become bluer at a fixed luminosity. This evolution will be quantified in §4. Both observations agree with studies of galaxies in clusters at redshifts up to unity (e.g., Bower, Lucey, & Ellis, 1992; Kodama & Arimoto, 1997; Terlevich, Caldwell, & Bower, 2001; van Dokkum & Franx, 2001), but we extend these results by showing that they apply to volumes which average over many different environments. The red sequence has a significant slope in the color-magnitude plane, therefore can be rightfully termed a color-magnitude relation (CMR) in all redshift bins up to at least . At , the magnitude range is so narrow that a constant color is also quite plausible. It is the CMR of the red sequence galaxies that we study in detail in the rest of this paper.
4 The Color-Magnitude Relation of Red Galaxies
We now quantify the redshift evolution of the CMR by examining its zero point. In order to ensure consistency between the zero point estimates for different bins, we constrain the slope of the CMR to the locally-determined value for cluster galaxies 0.08 (Bower, Lucey, & Ellis, 1992; Terlevich, Caldwell, & Bower, 2001). This slope appears compatible with the CMRs presented in Fig. 1 (a quantitative assessment of this statement is challenging without developing a robust description of the entire bimodal distribution, which is beyond the scope of this work; see, e.g., Baldry et al., 2004), and indeed is compatible with the slope of derived by Schweizer & Seitzer (1992) for E and S0 galaxies in field environments. We determine the robust biweight mean color, with the locally-determined CMR slope subtracted, of all galaxies with (independent of redshift, so as to roughly isolate the red sequence). We illustrate the procedure by showing the CMR-subtracted color histogram of galaxies in the inset panels of Fig. 1. The biweight mean and sigma of the unbinned sample are denoted by the dashed and dotted lines respectively. It becomes clear that the peak of the distribution can be determined to within a few hundredths of a magnitude, which is sufficient for our purposes.
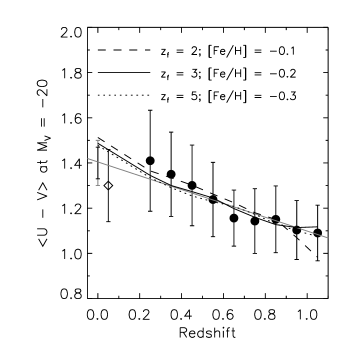
The value of our fit to the CMR color at is shown as a function of redshift in Fig. 2 and is tabulated in Table 1. It is clear that this population evolves considerably between and 0.2; the galaxies become redder by mag. For completeness, a linear fit to the evolution (including the local comparison points) is , as shown by the solid grey line. Some idea of the systematic uncertainties is given by a fit to the COMBO-17 points only: (the fit is not shown for clarity). The biweight RMS for the red sequence is given by the error bar. Overplotted are the evolving colors expected for single-age populations with differing formation redshifts. We use the Pégase stellar population synthesis model with subsolar metallicities to predict colors at a constant absolute magnitude. Galaxies with at redshift zero would be brighter at redshift one, owing to passive evolution of the stellar population. Therefore, we apply a small color correction to the passive evolution models to account for the fact that the galaxies with at redshift one are from a different, bluer part of the CMR. The evolution of the model colors are insensitive to the choice of stellar initial mass function (IMF), for which we adopt the Salpeter (1955) parameterization. We show also the color of the CMR intercept from two local samples. The color intercept of morphologically-classified early-type galaxies in the Abell 754 galaxy cluster is shown by the naked error bars (McIntosh, Rix, & Caldwell, 2004). This color intercept is consistent with early-type galaxies from a wide range of environments from the Nearby Field Galaxy Survey (Jansen et al., 2000; McIntosh, Rix, & Caldwell, 2004). The CMR intercept synthesized from SDSS Early Data Release (EDR; Stoughton et al., 2002) , , and -band data is shown by the diamond with error bars, which is offset from zero redshift for clarity. The SDSS EDR sample is discussed in the Appendix.
The color evolution of the COMBO-17 CMR intercept (the at ) is consistent with the expectations of passive evolution of ancient stellar populations. However, the COMBO-17 points do seem slightly high compared to the local data at . Absolute calibration of surveys is challenging at even the % level, especially as all of the data shown in Fig. 2 have been transformed to from other passbands, except for the Abell 754 data from McIntosh, Rix, & Caldwell (2004). Furthermore, the number of red-sequence galaxies is low at , increasing the uncertainties considerably (see Fig. 1). Finally, and perhaps most importantly, color gradients will affect this analysis at some level. The COMBO-17 colors are measured using adaptive-aperture photometry, and are essentially small-aperture central colors. For the most distant galaxies this will approximate total color. For the nearest COMBO-17 galaxies at , we may sample just their inner, redder parts. Taking typical color gradients from Peletier et al. (1990) as a guide, this could easily lead to a mag reddening of the CMR intercept at low redshift compared to the passive evolution expectation from high redshift. The local surveys we show use colors derived for between 50% and 100% of the galaxy light, and this would also lead to an offset between the lowest- COMBO-17 and local color intercepts at around the mag level. Both of these effects are arguably seen in the data. Nevertheless, taken as an ensemble, the CMR intercepts do appear to redden with time in a way that is consistent with the expectations of passive evolution. Yet, even extending large samples to , it is not possible to constrain meaningfully the formation redshift of the stars in early-type galaxies using this type of information, owing both to the age-metallicity degeneracy, and to systematic model uncertainties of at least in the colors of old stellar populations (Charlot, Worthey, & Bressan, 1996). This is illustrated in Fig. 2, where we choose stellar populations of different ages, with their metallicity at adjusted to keep the average color evolution roughly constant.

It is worth briefly discussing the scatter in the CMR of early-type galaxies. In the local Universe, the scatter in the CMR is observed to be small ( mag; Bower, Lucey, & Ellis, 1992; Terlevich, Caldwell, & Bower, 2001, although Schweizer & Seitzer 1992 find a scatter of mag in a more field galaxy-dominated sample). This has been interpreted as evidence for a small age spread in local Universe early-type galaxies, although Trager et al. (2000) argue that age and metallicity effects can conspire to produce a small CMR scatter even with large, anti-correlated scatter in age and metallicity. We find rather larger scatter (Fig. 1), mostly because our photometric redshift errors of translate into errors in the derived rest-frame colors of mag. In addition, the red sequence at is poorly defined, leading to larger uncertainties. Owing to these, and other systematic uncertainties (such as calibration and mismatches between real galaxy spectra and the template spectra used to derive the -correction), we show the full scatter in Fig. 2. In any case, these sources of uncertainty do not significantly affect our analysis because the color selection cut of mag that we choose later in §5 is larger than the scatter at all redshifts ( mag).
5 The Luminosity Density of Red-Sequence Galaxies
| log | ||||||||||
|---|---|---|---|---|---|---|---|---|---|---|
| (Vega mag) | Mpc)-3 | Mpc3) | ||||||||
| 0.25 | 71 | 16, 20 | 1.88, 2.34 | 1.0 | 1.41 | 0.22 | ||||
| 0.35 | 56 | 23, 12 | 2.81, 1.42 | 1.0 | 1.35 | 0.19 | ||||
| 0.45 | 62 | 9, 10 | 1.10, 1.23 | 0.99 | 1.30 | 0.18 | ||||
| 0.55 | 44 | 2, 6 | 0.38, 1.00 | 0.99 | 1.24 | 0.16 | ||||
| 0.65 | 35 | 7, 5 | 1.14, 0.78 | 0.97 | 1.16 | 0.12 | ||||
| 0.75 | 43 | 3, 5 | 0.54, 0.94 | 0.94 | 1.14 | 0.14 | ||||
| 0.85 | 50 | 11, 5 | 1.91, 0.89 | 0.88 | 1.15 | 0.15 | ||||
| 0.95 | 20 | 5, 2 | 1.11, 0.44 | 0.85 | 1.10 | 0.13 | ||||
| 1.05 | 16 | 3, 1 | 0.64, 0.35 | 0.77 | 1.09 | 0.12 | ||||
Note. — STY fits in 9 redshift intervals where the faint end slope was fit to the entire sample. Listed are , with two estimates of the cosmic variance uncertainty; from field-to-field variation divided by , and following the prescriptions of Somerville et al. (2004). The luminosity density is given, again with cosmic variance uncertainties, and further listed is the fraction of the luminosity density that is constrained by the measurements, and the covariance between and . Also given is the intercept of the CMR at color at and the robust biweight RMS scatter.
Because the stellar populations of red-sequence/early-type galaxies may have formed much earlier than they were assembled into recognizable early-types (Baugh, Cole, & Frenk, 1996; van Dokkum & Franx, 2001), the evolution of the CMR, or of the stellar mass-to-light ratios of red galaxies, is not a sensitive diagnostic of when these galaxies attained their present configuration. A much more sensitive diagnostic is the density or luminosity functions of red-sequence galaxies at redshifts less than unity.
In §§3 and 4, we have seen that it is possible to define the early-type galaxy population in an empirical, model-independent fashion by exploiting the bimodality of the galaxy color distribution out to (Fig. 1). We therefore choose to study galaxies around the red galaxy CMR, defining these as the red-sequence galaxy population at any given redshift. More quantitatively, we define red-sequence galaxies as being redder than (the dashed line in Fig. 1). This line is 0.25 mag bluewards of the linear fit to the evolution of the mean color of a galaxy from Fig. 2 (the solid grey line)555 This fit includes the data points also. A color cut derived using just the COMBO-17 data (which therefore includes the small bias caused by color gradients) is: . Adoption of this color cut in what follows does not change the results to within the errors.. We choose this definition merely to have a criterion that is a continuous function of redshift. Using a discontinuous color-cut which is 0.25 mag bluewards of the empirical CMR zero-point defined within each bin yields results that agree within the errors. Our color-cut philosophy is similar to that of Butcher & Oemler (1984), except that we choose to keep the red galaxies rather than the blue ones. The advantages of this definition of early-type galaxies are many. Firstly, it is straightforward to match this selection criterion in theoretical models. For example, even if the model CMR is curved, one can simply go 0.25 mag redwards of the curved locus in space and choose galaxies redder than that curved locus (although as long as the ‘gap’ between the red and blue peaks is sparsely populated, like in the observational data, the exact choice of color cut makes little difference as long as the cut lies in the ‘gap’). Secondly, it automatically accounts for evolution in a model-free way by fitting the CMR ridge-line. Thirdly, this definition has a well-defined physical meaning (galaxies that have colors consistent with old stellar populations at a given redshift). A final advantage is this definition’s insensitivity to differences in photometric zero points. For example, the local SDSS comparison sample and COMBO-17 sample may have offset color scales (Fig. 2); yet, the -band luminosity density of galaxies on the CMR is insensitive to this small color offset, meaning that the luminosity density of the local SDSS sample can be meaningfully compared with the rest-frame -band luminosity density of the COMBO-17 dataset. We note that this definition contrasts with W03, who adopted spectral type definitions based on present-day spectral energy distribution types. With this new approach, we are taking into account in a natural and empirical way the effects of evolution in red sequence galaxy color.
Defining galaxy types in this way, we now explore the evolution of the luminosity function of 4690 COMBO-17 red-sequence galaxies in Fig. 3. We estimate the galaxy luminosity function in different redshift bins following W03 using the formalism (e.g., Felten, 1977), using our detailed estimates of galaxy completeness as a function of surface brightness, magnitude, redshift and spectral type (see, e.g., Figs. 6 & 7 of W03). Error bars on the data points take into account Poisson errors only (i.e., not accounting for redshift, spectral type and magnitude errors). Schechter (1976) functions were fit to the red-sequence galaxy sample using the method of Sandage, Tammann, & Yahil (1979, STY hereafter).666In studies where the luminosity function is derived from a redshift survey with considerable ‘thickness’, such that galaxies populating the faint end come from different volumes as the galaxies populating the bright end, the can give misleading results owing to large scale structure. The STY estimator does not suffer from this limitation (Sandage, Tammann, & Yahil, 1979). In this paper, we split the COMBO-17 survey data into many thin shells, therefore the faint and bright galaxies in each redshift interval come from nearly identical volumes. Thus, the luminosity function estimates should also be relatively robust to large scale structure. We choose to fit the entire red-sequence galaxy sample at all redshifts with one common value of the faint-end slope ; in practice, is determined mainly by the lower redshift galaxy samples and is in this case, in excellent agreement with local observations (e.g., Madgwick et al., 2002; Bell et al., 2003). The magnitude at the ‘knee’ of the luminosity function () is redshift, but not field-to-field, dependent, and the density normalization is fit separately to each field at each redshift (see Table 1 for fit parameters). The Schechter luminosity function to the local comparison sample is shown by a dotted line (see the Appendix for more details).
W03 found strong evolution of ‘early-type galaxies’, defined via redshift-independent spectral energy distribution criteria (which did not take into account galaxy evolution). In contrast, one can see from Fig. 3 that the luminosity function evolution of early-type galaxies defined in this way is relatively mild. The characteristic magnitude seems to brighten and the number density seems to decrease somewhat with increasing redshift.
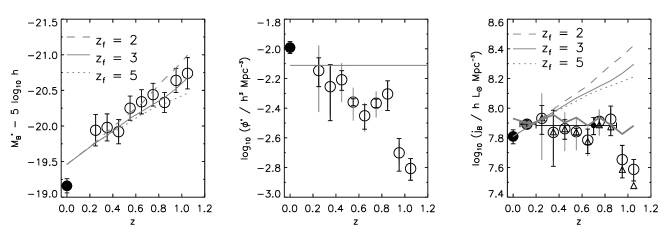
We quantify this evolution in Fig. 4, where we show the redshift evolution of the red-sequence galaxy rest-frame -band luminosity function parameters. In the left and center panels, we show the evolution of the magnitude of the ‘knee’ of the luminosity function, , and the density normalization of the luminosity function, . The solid circle denotes the low-redshift SDSS EDR comparison sample, selected using synthesized colors (Bell et al., 2003, see the Appendix), and -corrected and evolution-corrected to redshift zero. The smooth grey lines show the expectation of passive evolution models, normalized to pass through the COMBO-17 evolution. The model evolution is insensitive to stellar IMF at the 0.1 mag level. Error bars in show the 68% confidence interval. The error bars for attempt to show the expected effect of cosmic variance, and were derived using two methods. The black error bars show the field-to-field variations divided by , whereas the grey error bars show predictions from the prescription of Somerville et al. (2004), which over this redshift range for our sample of galaxies depends primarily on the comoving volume. As Fig. 4 and Table 1 show, these totally independent error estimates agree quite well, demonstrating that we have accounted for the effects of cosmic variance on our results. It is worth noting that and estimates are tightly coupled to give an invariant result for the total luminosity density 777This is a possible explanation for the offsets of the SDSS data point from extrapolations from the COMBO-17 data, as the SDSS control sample may have a slightly different shape, giving low and high estimates.. One can immediately see that the evolves, like the colors, in a way that is consistent with the evolution of an ancient stellar population. In contrast, the seems to strongly evolve in the interval , in clear disagreement with passively-evolving or pure luminosity evolution models.
Much more robustly measured is the total luminosity density of the summed red-sequence galaxy population. The luminosity density is estimated by integrating the best-fit Schechter Function to infinity using . We show the average luminosity density at each redshift from red-sequence galaxies (open circles), again including an error bar showing the uncertainty from cosmic variance. We show also a lower limit to the luminosity density, derived only from the observed luminosity density without extrapolating to zero luminosity (upwards-pointing triangles). We show also the SDSS (solid circle) luminosity density, and the 2dFGRS summed luminosity density of spectral-type selected early-type galaxies (Madgwick et al., 2002) as a filled grey circle. The smooth grey lines show the expectation of passive evolution models as shown above.
This figure shows a few key results. Firstly, it is clear that cosmic variance is a considerable source of uncertainty, even for a survey with 3 independent fields of square degree each. Cosmic variance is the limiting uncertainty for our and similar studies of the luminosity function evolution of red-sequence or early-type galaxies. Furthermore, Somerville et al. (2004) shows that more than an order of magnitude increase in comoving volume is required to reduce the cosmic variance uncertainties by a factor of two, if the areas imaged are contiguous. Alternatively, a factor of four more widely-separated areas could give the same decrease in uncertainty. Therefore, it will be necessary to cover substantially larger areas to similar depths to significantly improve on these results. Secondly, and most importantly, the rest-frame -band luminosity density in red-sequence galaxies remains more or less constant over the interval . In an effort to reduce the effects of cosmic variance, we estimate the average luminosity density in red-sequence galaxies in the interval , at the risk of over-binning the data: . The observed luminosity density falls short of the passive evolution prediction by at least a factor of two by , although cosmic variance and uncertainty in the passive evolution models preclude a more accurate assessment.
Of some importance in establishing this result is the local estimate of red sequence luminosity density. This was the primary motivation for carefully constructing a SDSS comparison sample. As discussed in Bell et al. (2003), this estimate is accurate to 10% in a systematic and random sense, owing largely to the excellent completeness properties of SDSS (used for galaxy selection) and the Two Micron All Sky Survey (which is used to normalize the luminosity function to the all-sky number density of galaxies). Furthermore, the colors were synthesized to allow identical selection criteria to be applied to the low-redshift and COMBO-17 samples, strongly limiting that source of systematic uncertainty. Furthermore, the 2dFGRS estimate of Madgwick et al. (2002) agrees with our SDSS estimate, lending further credibility to the low-redshift comparison data. Therefore, we believe that it is safe to conclude that the rest-frame -band luminosity density of color-selected early-type galaxies does not significantly evolve in the interval . Furthermore, because a passively-evolving population would have to fade by a factor of two or three from redshift one to the present day in rest-frame -band, this non-evolving corresponds to an increase in stellar mass in red galaxies of a factor of two to three from redshift unity to the present day.
6 Discussion
6.1 Comparison with previous work
The data presented here are based on a larger galaxy sample than all previous work in this field combined. Furthermore, we adopt an empirically-motivated definition of ‘early-type galaxy’ which accounts for evolution of the stars in these galaxies in a natural and model-independent fashion. Nevertheless, on the whole there is pleasing agreement between our conclusions and the results of many of the previous studies of this topic. The essentially passive evolution of the stars in early-type galaxies (not the galaxy population as a whole), as estimated from the color intercept of the CMR, is in excellent agreement with the colors (e.g., Kodama & Arimoto, 1997; Kodama, Bower, & Bell, 1999; van Dokkum et al., 2001), line strengths (e.g., Kuntschner, 2000; Kelson et al., 2001; Ziegler et al., 2001), and stellar M/Ls (e.g., van Dokkum & Franx, 2001; Treu et al., 2002) of individual early-type galaxies between , as extensively discussed in the introduction.
There is also good agreement between our detection of a factor of two evolution in stellar mass on the red sequence and other works in the literature. Morphologically-selected surveys (Im et al., 1996; Schade et al., 1999; Menanteau et al., 1999; Brinchmann & Ellis, 2000; Im et al., 2002) found little evidence for density evolution given the small sample sizes ( galaxies) and cosmic variance, and could not rule out passive or mild evolution of the type that we see. Noting that the most luminous galaxies are red at all redshifts up to unity (Fig. 1), our results also agree with a factor of a few decrease in the number of very luminous galaxies in -band selected samples out to (e.g., Drory et al., 2001).
Most color-selected surveys also agree with our conclusions. Lilly et al. (1995) study evolution in the luminosity function of galaxies with colors redder than a present-day Sbc galaxy. They find very little evolution, with large uncertainties from small number statistics and large-scale structure, which is consistent with both our result and passive evolution. Kauffmann et al. (1996) re-analyse this result, finding a factor of three evolution in galaxies with the colors of early-types, although Totani & Yoshii (1998) point out that spectroscopic incompleteness affects this result. Lin et al. (1999) agree with this picture using a similar technique with a larger sample of galaxies over a more restricted redshift range. Pozzetti et al. (2003) used the survey to estimate the evolution of red galaxies out to ; using a total galaxy sample of only 546 galaxies from 52 square arcmins, they find mild evolution in the number of luminous red galaxies, but with error bars of more than a factor of two (not accounting for the dominant uncertainties from large scale structure). Cimatti et al. (2003) study the properties of extremely red objects (EROs) in (galaxies with the colors of passively evolving populations), finding 2–4 less EROs than predicted from passive models (although with large cosmic variance uncertainty); furthermore, many of these galaxies have disturbed or disk-like morphologies. Chen et al. (2003) have used the Las Campanas Infrared Survey to estimate the luminosity density evolution of red galaxies in the rest frame -band, finding at most a factor of a few evolution in red galaxy density, although they were not able to rule out passive evolution with their sample. We are consistent with these results, but have been able to place much stronger constraints based on our factor of at least three improvement in sample size and factor of two larger sky coverage, compared to the largest of the previous works. Importantly, these previous works often neglected the uncertainties stemming from large-scale structure; whereas, we have quantified and accounted for this dominant source of uncertainty.
Finally, we should compare with our own earlier work, W03, where we explored the same COMBO-17 dataset, but used a concepually different, non-evolving definition of ‘early-type galaxies’ (their type 1). Their non-evolving spectral typing corresponds to constant rest-frame color cuts at all redshifts; their type 1 corresponds to , and their type 2 corresponds to . Thus, type 1 galaxies have the colors of present-day luminous elliptical and lenticular galaxies, but are significantly redder than the reddest galaxies at higher redshift. Consequently, W03 found rapid evolution of type 1s, in the sense that galaxies with the colors of present-day early-types are extremely rare in the distant Universe (but primarily because of passive evolution in their colors). Because of these definition differences, the statement by W03 that galaxies redder than a fixed threshold have a rapidly evolving luminosity density is consistent with our statement of a roughly non-evolving rest-frame -band luminosity density in red-sequence galaxies.
In summary, all of our results are consistent with those presented to date in the literature, but with much greater precision and understanding of the uncertainties owing to our factor of larger sample and sky coverage.
6.2 The Nature of Red Galaxies
We now turn to the nature of galaxies in this red population: are these galaxies red because they contain almost exclusively old stars, or is there a significant contribution from more dusty, star-forming galaxies?
At low redshift, the red population is overwhelmingly composed of morphologically early-type galaxies (e.g., Sandage & Visvanathan, 1978; Bower, Lucey, & Ellis, 1992; Schweizer & Seitzer, 1992; Terlevich, Caldwell, & Bower, 2001; Hogg et al., 2002). For the SDSS survey, Strateva et al. (2001) find that 80% of the red galaxies are earlier than Sa in morphological type.
At intermediate redshift, most studies have targeted galaxy clusters where most red or non-star-forming galaxies are spheroid dominated (e.g., Couch et al., 1998; van Dokkum et al., 2000; van Dokkum & Franx, 2001). Furthermore,most of the luminosity density of morphologically-classified early-type galaxies in the Hubble Deep Field North at is in red-sequence galaxies (Kodama, Bower, & Bell, 1999). Recently, Bell et al. (2004) used the GEMS (Galaxy Evolution from Morphology and SEDs Rix et al., 2004) HST Advanced Camera for Surveys dataset to explore the morphology of roughly 500 red-sequence galaxies, finding that % of the luminosity density in red-sequence galaxies is from morphologically-classified early-type (E, S0 and some Sa) galaxies.
The nature of red galaxies at higher redshifts is somewhat less clear. A number of studies have explored the nature of ‘extremely red objects’ (EROs), which have very red colors consistent with passively-evolving ancient stellar populations with (but can in principle be a mixed bag from a variety of different redshifts). Cimatti et al. (2002) use deep spectroscopy to split EROs roughly 50:50 between passively-evolving red-sequence galaxies and dusty star-forming galaxies in a sample of 45 EROs. Complementary analyses are presented by Yan & Thompson (2003), Moustakas et al. (2004), Gilbank et al. (2003), and Cimatti et al. (2003), who demonstrate that there is roughly an equal three-way split between the Hubble Space Telescope (HST) morphologies of EROs, such that are bulge-dominated, are disk-dominated, and have disturbed morphologies. Thus, luminosity densities derived from red color-selected samples may overestimate the stellar mass in early-type galaxies.
This evidence suggests that most red galaxies to are morphologically early-type with dominant old stellar populations. In contrast, a significant fraction of distant red galaxies may have red colors not because of a dominant old stellar population, but rather because of dust (i.e., edge-on disks or dusty starbursts). Bearing this in mind, we caution that our results should be interpreted only as upper limits on the abundance of galaxies dominated by ancient stellar populations until the advent of more definitive morphological data and/or spectra for sufficient numbers of galaxies with .
6.3 The Predicted Luminosity Evolution of Hierarchical Model Galaxies
In §5 we showed that the rest-frame -band luminosity density of red-sequence galaxies does not significantly evolve since . This is at variance with the expectations of a completely passive evolution model (where red-sequence galaxies fully form at and simply age to the present day), which would predict a factor of two or three decrease in the rest-frame -band luminosity density in red galaxies from redshift one to zero. It is interesting to compare our results with the expectations of hierarchical models of galaxy formation and evolution, to check if these models would predict a roughly non-evolving -band luminosity density since in red galaxies.
There are two main predictions of hierarchical models of galaxy formation and evolution. Firstly, early-type galaxies in the field should have stellar population of a somewhat younger mean stellar age, and they should be assembled later than their clustered counterparts, because the mergers which give rise to the early-types happened at earlier times in clusters than in the field (where they continue even to the present day; e.g., Baugh, Cole, & Frenk, 1996). We have chosen not to explore this issue at present, as constructing local density estimators with a redshift precision of is non-trivial. Other studies may have detected an offset, in the sense that field early-types may be younger than cluster early-types, using line strength (Guzman et al., 1992; Bernardi et al., 1998) or fundamental plane constraints (Treu et al., 2002), although Hogg et al. (2004) see no environmental dependence in the CMR in the SDSS at the 0.01 mag level. Nevertheless, progenitor bias and the age-metallicity degeneracy are significant observational worries in studies of this kind, and more work is required to firm up these interesting results. A particularly exciting avenue of research is study of mass-selected galaxies from gravitational lensing studies. In these studies, the sample is selected to have high stellardark masses, without regard for their photometric properties (or indeed, for their environments). First results from these surveys have been controversial but promising. Kochanek et al. (2000) and Rusin et al. (2003) find no evidence for younger stellar populations in (the same) mass-selected sample, compared to galaxy clusters. van de Ven, van Dokkum, & Franx (2003) re-analyze these data using a more model-dependent but sensitive approach, accounting for progenitor bias, finding younger luminosity-weighted ages than clustered massive galaxies, in agreement with hierarchical model expectations.
The second main prediction of hierarchical models of galaxy formation is a gradual increase in the stellar mass of the early-type/red-sequence galaxy population until the present day, because of constant build-up in stellar mass from galaxy mergers (Baugh, Cole, & Frenk, 1996; Kauffmann et al., 1996). In Fig. 4, we show a blind prediction of evolution of the rest-frame -band luminosity density of red-sequence galaxies from the Cole et al. (2000) fiducial model using the same color-magnitude relation methodology adopted in this paper. The models are constrained to match the local luminosity function plus the morphological mix of galaxies in the local Universe, therefore the approximate match between the models and the observations at redshift zero is largely by design. Observations of luminosity functions at non-zero redshifts were not used at any stage to constrain model parameters, therefore the excellent agreement between the model and the data out to is a significant achievement. It is unclear how well other models (e.g., Kauffmann et al., 1999; Somerville & Primack, 1999) will reproduce these data, owing to the well-known inability of models of this type to match both the dynamics and luminosity functions of galaxies simultaneously. The Cole et al. (2000) model tunes to match the luminosity function of galaxies well at the present day, and is therefore the suitable model with which to compare luminosity density evolution. The Somerville & Primack (1999) and Kauffmann et al. (1999) models tune to reproduce galaxy dynamics at the expense of the galaxy luminosity function, and are less suitable for comparisons of this type (but are more suitable for exploring the evolution of galaxy dynamics). A more thorough discussion of the stellar mass, dynamical and morphological evolution of the red-sequence galaxy population is clearly warranted, but is beyond the scope of this paper. Nevertheless, the current zero-order comparison is rather encouraging; models that are tuned to reproduce the present-day distribution of galaxy luminosities predict no evolution in the luminosity density of red-sequence galaxies, in agreement with our observations.
6.4 The Origin of Luminous Red-Sequence Galaxies
What might these data tell us about the origin of luminous red-sequence galaxies? An intriguing observation is that at all redshifts, there are very few blue galaxies luminous enough to fade into the brightest red-sequence galaxies (Fig. 1). In this section, we explore what this may imply.
As a useful tool for this discussion, we construct a sequence of previously star-forming Pégase model galaxies who have had their star formation suddenly stopped at some point in the past, to study how galaxies fade and redden with time (the solid lines with crosses in Fig. 1). We construct a ‘bright’ () and ‘faint’ () set of model galaxies. These models are not designed to be particularly realistic, rather they are discussed only to give a flavor for how star-forming galaxies may settle onto the red sequence if their star formation was stopped for some reason. We discuss the ‘bright’ set of model galaxies first, discussing the ‘faint’ set afterwards. The ‘bright’ set of model galaxies is based on a galaxy with a SFH of the form , where is the star formation rate (SFR), is the time elapsed since galaxy formation, and is the -folding time of the SFH, set in this case to be 4 Gyr (this color would correspond roughly to a Sb galaxy in the local Universe). The formation redshift is assumed to be , and the metallicity is assumed to be constant at solar, for simplicity. The evolution of this model over cosmic time is shown by the bluest cross on the ‘bright’ track in each panel of Fig. 1.
The solid line at in each panel of Fig. 1 connects this Gyr model with models which have the identical SFH (crosses), except that they have had their SF stopped arbitrarily after an elapsed time of 90%, 80%, 50% and 10% of the age of the galaxy at the redshift interval of interest (these models correspond to the second bluest cross to the reddest cross, respectively; the bluest cross is the untruncated model as discussed above). When the SF is stopped, a burst of SF occurs which increases the stellar mass of the truncated model to the same stellar mass as the untruncated galaxy. The ‘faint’ set of models is analagous, except with 1/3 solar metallicity and a constant SFR (), in order to have the somewhat bluer colors characteristic of fainter galaxies.
A cursory inspection of these tracks in Fig. 1 shows clearly that while faint red-sequence galaxies may plausibly be faded remnants of blue, later-type galaxies which exist at the same epoch, there are very few blue galaxies bright enough to fade into the most luminous red-sequence galaxies at all redshifts out to . Thus, luminous red-sequence galaxies cannot have originated from simple fading of single blue star-forming galaxies since redshift one. This implies that most luminous red-sequence galaxies were either completely formed earlier than , or that these luminous red-sequence galaxies formed through mergers of galaxies.
We explore these two possibilities by considering the luminosity density in luminous red-sequence galaxies at . Let us adopt as a null hypothesis that luminous red-peak galaxies form completely at high redshift and simply age to the present day (the first option). Then, if we choose to evaluate the luminosity density in red-sequence galaxies above a passively-fading luminosity cut (i.e., a constant stellar mass cut), we should observe a luminosity density which fades passively (like the grey passive evolution tracks in Figs. 4 and 5). If the total luminosity density in this sub-population does not follow a simple fading track, then a merger origin for at least some of the luminous red galaxies at appears necessary (the second option) to boost this population of luminous red galaxies. Recall that a ‘bulgefading disk’ scenario is not allowed, as a reservoir of very luminous blue galaxies (blue because of their disks) would be required to fade and redden into red-sequence galaxies, in clear contradiction with the observations (Fig. 1). In order to place the most interesting constraints, we choose a luminosity cut corresponding roughly to the ‘bright’ track in Fig. 1 above which there are few blue galaxies which can fade onto the red sequence.
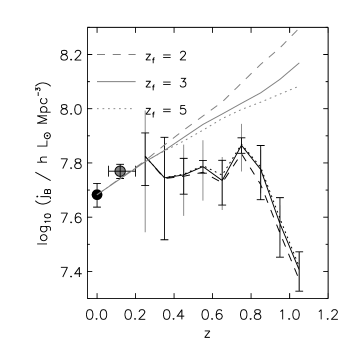
The luminosity density of red-peak galaxies destined to passively evolve into galaxies brighter than at (as calculated using the rate of fading of Pégase model stellar populations in conjunction with an assumed formation redshift) is shown in Fig. 5 by dashed, solid and dotted black lines for different formation redshifts . This luminosity cut is equivalent to , accounting for the average rest-frame color of red-peak galaxies at that redshift of . We show example cuts as a function of redshift in Fig. 3 as arrows, assuming . For reference, these example cuts are 19.1, 19.2, 19.32, 19.44, 19.54, 19.64, 19.74, 19.86, 20.01 for 0.25, 0.35, 0.45, 0.55, 0.65, 0.75, 0.85, 0.95, 1.05, again for . We overplot large scale structure errors, as before. We show also the luminosity density in galaxies brighter than at for SDSS EDR red-peak galaxies as a solid point; this cutoff corresponds to at , passively faded to the present day. The passive fading expectation is shown in the grey lines. The luminosity densities are sums of the points, except for a tiny contribution to the two highest redshift bins, where we must extrapolate slightly using the Schechter function fit.
It is clear that the observed luminosity density in luminous red peak galaxies evolves relatively little over the interval (similarly to the luminosity density evolution in the whole red-sequence galaxy population). There is perhaps a modest increase out to , then a significant drop at higher redshift. This weak evolution does not agree with the expectations of passive evolution models (where the galaxy population forms completely at high redshift and simply ages to the present day). Thus, the population of luminous red-peak galaxies (those destined to become red-peak galaxies with by ) grows in stellar mass by roughly a factor of two in the interval . There is a hint that much of this stellar mass build-up happens at , with a modest gradual increase at later times. Clearly, however, a larger survey with lower uncertainties from large scale structure is required to further constrain the epoch of rapid stellar mass assembly in the luminous red galaxy population.
The significance of the evolution in the luminous red galaxy population is that we have chosen a luminosity cutoff which corresponds to the ‘bright’ truncation model of Fig. 1. At all redshifts, it is clear that there are very few single blue galaxies bright enough to fade into a red galaxy with luminosities brighter than this model. Yet, this luminous red galaxy population builds up in stellar mass by a factor of two in this redshift range. Red massive progenitors would have been included in the luminosity density estimates, and blue massive progenitors are observed to be very rare indeed (Fig. 1). Thus, merging between less luminous galaxies is required to build up these luminous red galaxies (see also, e.g., Le Fèvre et al., 2000; Patton et al., 2002; Brinchmann & Ellis, 2000, for discussion of the increased importance of merging in galaxy evolution at ). Furthermore, owing to the rarity of luminous blue galaxies, these mergers must have at most a very brief luminous blue phase. This is possible if most mergers of massive galaxies are either very dusty (obscuring and reddening the stellar populations until the stellar populations age and redden sufficiently to join the red sequence) or are very gas poor to begin with (e.g., the elliptical-elliptical mergers observed by van Dokkum et al., 2001, and explored theoretically by Khochfar & Burkert 2003). Exploring these two options in detail is far beyond the scope of this work, except to note that both have clear observational signatures. The highly-obscured gaseous mergers should be among the brightest far-infrared sources at any given redshift, and will therefore be well-constrained by current and planned observations in the far-infrared and sub-mm regime (e.g., Flores et al., 1999). On the other hand, the elliptical-elliptical mergers, if they build up the galaxy mass by more than a factor of two or so, will flatten the CMR at the highest luminosities (Bower, Kodama, & Terlevich, 1998). Disentangling the contributions from both processes will be a fascinating prospect for the coming years.
The distribution of galaxy colors also strongly constrains the ‘frosting’ model of Trager et al. (2000). In this scenario, many early-types have residual low-level SF at . One could postulate that the factor of two evolution in stellar mass in red-sequence galaxies is due to residual SF in the other half of the galaxies, making them too blue to satisfy our redshift-dependent color cut. This residual SF slows to the present day, giving an apparent evolution of a factor of two in stellar mass while avoiding the need for wholesale galaxy assembly through galaxy mergers. However, this mechanism could not work for at least high-luminosity red galaxies. A ‘frosting’ of SF on top of a massive red-sequence galaxy at would produce an even brighter blue galaxy, in clear contradiction with the observations. Indeed, as estimated using the Pégase stellar population model, a color difference of (the color cut adopted in our definition of red-sequence galaxies) corresponds to an ongoing SF rate of only a few percent of the average SF rate at earlier times (i.e., the birthrate ). Thus, the observations strongly limit the amount of residual SF in massive red-sequence galaxies all the way from to the present day to less than a few percent enhancement in stellar mass over the whole redshift range . Our observations say little about less luminous early-types; medium-to-high resolution, high S/N spectroscopy will allow us to more meaningfully constrain the SFHs of less luminous red-sequence galaxies.
6.5 A Synthesis
It is interesting to bring together some of the different threads in this paper into an overall qualitative, perhaps in parts naive, picture of galaxy evolution.
Firstly, the color distribution is bimodal. As discussed above at the end of §6.4, birthrates (the relative present-day SFR compared to the average past SFR) for red-sequence galaxies are low . Interesting lower limits on the birthrates of blue-peak galaxies can be derived by assuming that these galaxies are dust-free. Again using the Pégase stellar population models, the red end of the blue peak (with ) corresponds to , whereas the bluest galaxies correspond to (using Pégase models or the results of Kennicutt, Tamblyn, & Congdon, 1994, to transform into ) 888It should be noted that the 4th column of their Table 1 is mistakenly labelled , when it should be labelled .. Thus, galaxies on the blue peak need not be forming stars vigorously at the present day (see also Brinchmann et al., 2004). Indeed, modest rates of only 10% of the past average SFR are required to keep a galaxy on the blue peak (more, if the effects of dust are important). Thus, bimodality in the color distribution of galaxies simply betrays the fact that young stars are very bright, and that if even a small number of young stars are present they dominate the optical colors of that galaxy. The red peak, in contrast, tells us that there is a substantial population of non-star forming galaxies, with present day SFRs of at most a few percent of their past average SFRs (for example, Hogg et al., 2002; Kauffmann et al., 2003; Bell et al., 2003, find that half or more of the stellar mass in the local Universe is in non-star forming early-type galaxies).
Secondly, the -band luminosity density of galaxies in the red sequence does not significantly evolve in the interval . This implies a build-up of stellar mass on the non-star-forming red peak by a factor of at least two since . This stellar mass must come from the blue peak galaxies, as we are not permitted to form the stars in situ because of the red colors of the red-sequence population.
Is the relative number of galaxies in the red and blue peaks, and in the gap, consistent with this picture? We explore this by constructing a very simplistic model, in which some small fraction of star-forming galaxies in the blue peak are ‘turned off’ (by some unspecified mechanism) and subsequently redden and fade (see, e.g., Kodama & Bower, 2001, for a model of this type applied to rich galaxy clusters). Fading across the ‘gap’ takes around of the Hubble time (as seen by the crosses on the fading tracks in Fig. 1). In order to reproduce the roughly factor of two to three difference in the number of galaxies in the gap compared to the blue peak, it is necessary to turn off roughly of the blue galaxies per Gyr, letting them fade across the gap. This rate of transformation also gives a factor of roughly two increase in the stellar mass density on the red sequence. Thus, a very simplistic picture where some small fraction of the blue population of galaxies have their SF stopped every Gyr (by some unspecified mechanism), subsequently fading into red galaxies, holds water.
Of course, we know that there must be other physical processes at work. A truncation-only model predicts that the characteristic luminosity of red galaxies is fainter than the blue population. Yet, the brightest and most massive present-day galaxies in the Universe are almost all red (e.g., Kochanek et al., 2001; Bell et al., 2003). Furthermore, this situation persists out to (Fig. 1). Another prediction is that the morphologies of the red and blue peak populations should be rather similar, which again is completely ruled out by observations (Strateva et al., 2001). Indeed, the hypothesis that luminous red-sequence galaxies at are faded remnants of bulgeblue disk systems at whose disks have faded and reddened can be ruled out owing to the paucity of luminous blue galaxies at . Galaxy mergers are a likely process for rectifying these shortcomings. Galaxy mergers will increase the characteristic luminosity of post-merger galaxies through the addition of the pre-existing stellar populations, in conjunction with any SF associated with the merger itself. Furthermore, the violent relaxation associated with galaxy mergers leads to more spheroidal-dominated morphologies (e.g., Eggen, Lynden-Bell, & Sandage, 1962; Toomre & Toomre, 1972; Barnes & Hernquist, 1996). Indeed, mergers and galaxy interactions may even provide a mechanism for the truncation of SF, through the consumption of the gas in an induced starburst (e.g., Barnes & Hernquist, 1996; Barton, Geller, & Kenyon, 2000). The only constraint which we can place on the role and frequency of these mergers with these data is that the mergers responsible for the most luminous red galaxies cannot have a long blue phase, owing perhaps to dust or a lack of gaseous content in the progenitors.
This qualitative picture agrees well with many of the features of current models of galaxy formation in a hierarchical CDM Universe (e.g., White & Frenk, 1991; Kauffmann et al., 1996; Somerville & Primack, 1999; Cole et al., 2000). Furthermore, it makes a number of predictions that are testable in the near future. For example, the merger origin of the most luminous red galaxies can be tested by both deep optical HST imaging over wide fields and by far-infrared and sub-mm deep imaging to constrain the frequency of mergers between gas-poor early types and more gaseous later types, respectively (building on the studies of, e.g., Flores et al., 1999; Le Fèvre et al., 2000). Additionally, one can test the viability of the truncation model, and constrain truncation mechanisms, through a combination of deep HST imaging (for galaxy morphologies as a function of color and magnitude) and deep spectroscopy (to check for signatures of recently-truncated SF, such as enhanced Balmer absorption lines), extending the cluster-based work of, e.g., Poggianti et al. (1999) to the more general field environment. Furthermore, one can seek to explore these different galaxy populations in different local environments, to seek the signature of more rapid environmentally-induced transformation in denser environments, extending to higher redshift the important work of, e.g., Lewis et al. (2002), Gómez et al. (2003), and Balogh et al. (2004).
7 Conclusions
The evolution of red-sequence/early-type galaxies directly reflects the importance and number of major galaxy mergers, and therefore strongly constrains hierarchical models of galaxy formation and evolution. We have explored the rest-frame colors and luminosities of galaxies from 0.78 square degrees from the COMBO-17 survey, encompassing a cosmologically-representative total volume of Mpc3. We find that the distribution of galaxy colors is bimodal at all redshifts out to .
The blue star-forming peak has colors that become redder towards the present day at a given magnitude, indicating changes in characteristic stellar age, metallicity or dust content with epoch. Furthermore, there are many more luminous blue galaxies at than there are at the present day (this is discussed in much more detail by Wolf et al., 2003).
The red non-star-forming peak forms a scattered but well-defined color-magnitude relation (CMR) at , with luminous galaxies being redder than their fainter counterparts. The color of red galaxies at a given rest-frame magnitude becomes bluer with increasing redshift. The quantitative size of this change is consistent with passive aging of ancient stellar populations to the present day.
Using this empirically-motivated definition of early-type galaxies, we estimate the rest-frame -band luminosity function and luminosity density of red-sequence galaxies in the interval . There may be some contribution from dusty star-forming galaxies at the highest redshifts, making our results upper limits. Nevertheless, we find mild evolution of the rest-frame -band luminosity density between . Ancient stellar populations would fade by a factor of two to three in this time interval; therefore, this mild evolution betrays an increase in the stellar mass on the red sequence since by at least a factor of two. This evolution is consistent qualitatively and quantitatively with the evolution expected from the hierarchical build-up of stellar mass via galaxy mergers in a CDM Universe. The largest source of error is large-scale structure, implying that considerably larger surveys are necessary to further refine this result.
Finally, we explore the evolution of the red, blue and gap population on the color–magnitude plane. We find that a scenario in which SF is stopped (for an as-yet-unspecified reason) in 5–10% of the blue galaxy population per Gyr reproduces the relative numbers of red, blue and gap galaxies. We argue also, based on the luminosity functions and morphologies of red galaxies in the local and distant Universe, that galaxy merging plays an important role. In particular, at least some of the the most luminous red galaxies must be formed in galaxy mergers which are either very dusty or take place between gas-poor progenitors. Disentangling further the processes which drive the evolution of the red galaxy population at will indeed present a fascinating observational challenge over the next few years.
References
- Aragon-Salamanca, Baugh, & Kauffmann (1998) Aragon-Salamanca, A., Baugh, C. M., & Kauffmann, G. 1998, MNRAS, 297, 427
- Baade et al. (1998) Baade, D., et al. 1998, The Messenger, 93, 13
- Baade et al. (1999) Baade, D., et al. 1999, The Messenger, 95, 15
- Baldry et al. (2004) Baldry, I. K., Glazebrook, K., Brinkmann, J., Ivezic, Z., Lupton, R. H., Nichol, R. C., Szalay, A. C. 2004, ApJ, in press (astro-ph/0309710)
- Balogh et al. (2004) Balogh, M., et al. 2004, submitted to MNRAS (astro-ph/0311379)
- Barnes (1992) Barnes, J. E. 1992, ApJ, 393, 484
- Barnes & Hernquist (1996) Barnes, J. E., & Hernquist, L. 1996, ApJ, 471, 115
- Barton, Geller, & Kenyon (2000) Barton, E. J., Geller, M. J., & Kenyon, S. J. 2000, ApJ, 530, 660
- Baugh, Cole, & Frenk (1996) Baugh, C. M., Cole, S., & Frenk, C. S. 1996, MNRAS, 283, 1361
- Bell & de Jong (2000) Bell, E. F., & de Jong, R. S. 2000, MNRAS, 312, 497
- Bell et al. (2003) Bell, E. F., McIntosh, D. H., Katz, N., & Weinberg, M. D. 2003, ApJS, 149, 289
- Bell et al. (2004) Bell, E. F., et al. 2004, ApJ, 600, L11
- Bernardi et al. (1998) Bernardi, M., et al. 1998, ApJ, 508, L143
- Bernardi et al. (2003) Bernardi, M., et al. 2003, AJ, 125, 1882
- Bertin & Arnouts (1996) Bertin, E., & Arnouts, S. 1996, A&AS, 117, 393
- Blanton et al. (2003a) Blanton, M. R., et al. 2003a, ApJ, 594, 186
- Blanton et al. (2003b) Blanton, M. R., et al. 2003b, ApJ, 592, 819
- Bower, Kodama, & Terlevich (1998) Bower, R. G., Kodama, T., & Terlevich, A. 1998, MNRAS, 299, 1193
- Bower, Lucey, & Ellis (1992) Bower, R. G., Lucey, J. R., & Ellis, R. S. 1992, MNRAS, 254, 601
- Brinchmann & Ellis (2000) Brinchmann, J., & Ellis, R. S. 2000, ApJ, 536, L77
- Brinchmann et al. (2004) Brinchmann, J., Charlot, S., White, S. D. M., Tremonti, C., Kauffmann, G., Heckman, T., & Brinkmann, J. 2004, submitted to MNRAS (astro-ph/0311060)
- Butcher & Oemler (1984) Butcher, H., & Oemler, Jr., A. 1984, ApJ, 285, 426
- Calzetti et al. (2000) Calzetti, D., Armus, L., Bohlin, R. C., Kinney, A. L., Koornneef, J., & Storchi-Bergmann, T. 2000, ApJ, 533, 682
- Charlot, Worthey, & Bressan (1996) Charlot, S., Worthey, G., & Bressan, A. 1996, ApJ, 457, 625
- Chen et al. (2003) Chen, H.-W., et al. 2003, ApJ, 586, 745
- Cimatti et al. (2002) Cimatti, A., et al. 2002, A&A, 381, L68
- Cimatti et al. (2003) Cimatti, A., et al. 2003, A&A, 412, L1
- Cole et al. (2000) Cole, S., Lacey, C., Baugh, C. M., & Frenk, C. S. 2000, MNRAS, 319, 168
- Couch et al. (1998) Couch, W. J., Barger, A. J., Smail, I., Ellis, R. S., & Sharples, R. M. 1998, ApJ, 497, 188
- Cowie et al. (1996) Cowie, L. L., Songaila, A., Hu, E. M., Cohen, J. G. 1996, AJ, 112, 839
- Daddi et al. (2002) Daddi, E., et al. 2002, A&A, 384, L1
- Dressler (1980) Dressler, A. 1980, ApJ, 236, 351
- Dressler et al. (1997) Dressler, A., et al. 1997, ApJ, 490, 577
- Drory et al. (2001) Drory, N., Bender, R., Snigula, J., Feulner, G., Hopp, U., Maraston, C., Hill, G. J., & Mendes de Oliveira, C. 2001, ApJ, 562, L111
- Efstathiou et al. (2002) Efstathiou, G., et al. 2002, MNRAS, 330, L29
- Eggen, Lynden-Bell, & Sandage (1962) Eggen, O. J., Lynden-Bell, D., & Sandage, A. R. 1962, ApJ, 136, 748
- Felten (1977) Felten, J. E. 1977, AJ, 82, 861
- Fioc & Rocca-Volmerange (1997) Fioc, M., & Rocca-Volmerange, B. 1997, A&A, 326, 950
- Firth et al. (2002) Firth, A. E., et al. 2002, MNRAS, 332, 617
- Flores et al. (1999) Flores, H., et al. 1999, ApJ, 517, 148
- Freedman et al. (2001) Freedman, W. L., et al. 2001, ApJ, 553, 47
- Gilbank et al. (2003) Gilbank, D. G., Smail, I., Ivison, R. J., Packham, C. 2003, MNRAS, 346, 1125
- Gómez et al. (2003) Gómez, P. L., et al. 2003, ApJ, 584, 210
- Guzman et al. (1992) Guzman, R., Lucey, J. R., Carter, D., Terlevich, R. J. 1992, MNRAS, 257, 187
- Hogg et al. (2002) Hogg, D. W., et al. 2002, AJ, 124, 646
- Hogg et al. (2003) Hogg, D. W., et al. 2003, ApJ, 585, L5
- Hogg et al. (2004) Hogg, D. W., et al. 2004, submitted to ApJ letters (astro-ph/0307336)
- Im et al. (1996) Im, M., Griffiths, R. E., Ratnatunga, K. U., & Sarajedini, V. L. 1996, ApJ, 461, L79
- Im et al. (2002) Im, M., et al. 2002, ApJ, 571, 1361
- Jansen et al. (2000) Jansen, R., Franx, M., Fabricant, D., & Caldwell, N. 2000, ApJS, 126, 271
- Kauffmann & Charlot (1998) Kauffmann, G., & Charlot, S. 1998, MNRAS, 297, L23
- Kauffmann et al. (1996) Kauffmann, G., Charlot, S., & White, S. D. M. 1996, MNRAS, 283, L117
- Kauffmann et al. (1999) Kauffmann, G., Colberg, J. M., Diaferio, A., & White, S. D. M. 1999, MNRAS, 303, 188
- Kauffmann et al. (2003) Kauffmann, G., et al. 2003, MNRAS, 341, 54
- Kelson et al. (2001) Kelson, D. D., Illingworth, G. D., Franx, M., & van Dokkum, P. G. 2001, ApJ, 552, L17
- Kennicutt, Tamblyn, & Congdon (1994) Kennicutt Jr., R. C., Tamblyn, P., Congdon, C. E. 1994, ApJ, 435, 22
- Khochfar & Burkert (2003) Khochfar, S., & Burkert, A. 2003, ApJ, 597, 117L
- Kinney et al. (1996) Kinney, A. L., Calzetti, D., Bohlin, R. C., McQuade, K., Storchi-Bergmann, T., & Schmitt, H. R. 1996, ApJ, 467, 38
- Kochanek et al. (2000) Kochanek, C. S., et al. 2000, ApJ, 543, 131
- Kochanek et al. (2001) Kochanek, C. S., et al. 2001, ApJ, 560, 566
- Kodama & Arimoto (1997) Kodama, T., & Arimoto, N. 1997, A&A, 320, 41
- Kodama, Bower, & Bell (1999) Kodama, T., Bower, R. G., & Bell, E. F. 1999, MNRAS, 306, 561
- Kodama & Bower (2001) Kodama, T., & Bower, R. G. 2001, MNRAS, 321, 18
- Kron (1980) Kron, R. G. 1980, ApJS, 43, 305
- Kuntschner (2000) Kuntschner, H. 2000, MNRAS, 315, 184
- Larson (1975) Larson, R. B. 1975, MNRAS, 173, 671
- Le Fèvre et al. (2000) Le Fèvre, O., et al. 2000, MNRAS, 311, L565
- Lewis et al. (2002) Lewis, I., et al. 2002, MNRAS, 334, 673
- Lilly et al. (1995) Lilly, S. J., Tresse, L., Hammer, F., Crampton, D., & Le Févre, O. 1995, ApJ, 455, 108
- Lin et al. (1999) Lin, H., et al. 1999, ApJ, 518, 533
- Madgwick et al. (2002) Madgwick, D. S., et al. 2002, MNRAS, 333, 133
- McIntosh, Rix, & Caldwell (2004) McIntosh, D. H., Rix, H.-W., & Caldwell, N., 2004, submitted to ApJ(astro-ph/0212427)
- Menanteau et al. (1999) Menanteau, F., Ellis, R. S., Abraham, R. G., Barger, A. J., Cowie, L. L. 1999, MNRAS, 309, 208
- Moustakas & Somerville (2002) Moustakas, L. A., & Somerville, R. S. 2002, ApJ, 577, 1
- Moustakas et al. (2004) Moustakas, L. A., et al. 2004, ApJL, 600, L131
- Nulsen & Fabian (1997) Nulsen, P. E. J., & Fabian, A. C. 1997, MNRAS, 291, 425
- Patton et al. (2002) Patton, D. R., et al. 2002, ApJ, 565, 208
- Peletier et al. (1990) Peletier, R. F., Davies, R. L., Illingworth, G. D., Davis, L. E., & Cawson, M. 1990, AJ, 100, 1091
- Poggianti et al. (1999) Poggianti, B. M., Smail, I., Dressler, A., Couch, W. J., Barger, A. J., Butcher, H., Ellis, R. S., & Oemler Jr., A. 1999, ApJ, 518, 576
- Pozzetti et al. (2003) Pozzetti, L., et al. 2003, A&A, 402, 837
- Pryke et al. (2002) Pryke, C., Halverson, N. W., Leitch, E. M., Kovac, J., Carlstrom, J. E., Holzapfel, W. L., & Dragovan, M. 2002, ApJ, 568, 46
- Rix et al. (2004) Rix, H.-W., et al. 2004, ApJS, in press (astro-ph/0401427)
- Röser & Meisenheimer (1991) Röser, H.-J., & Meisenheimer, K. A&A, 252, 458
- Rusin et al. (2003) Rusin, D., et al. 2003, ApJ, 587, 143
- Salpeter (1955) Salpeter, E. E. 1955, ApJ, 121, 161
- Sandage & Visvanathan (1978) Sandage, A., & Visvanathan, N. 1978, ApJ, 225, 742
- Sandage, Tammann, & Yahil (1979) Sandage, A., Tammann, G. A., & Yahil, A. 1979, ApJ, 232, 352
- Schade et al. (1999) Schade, D., et al. 1999, ApJ, 525, 31
- Schechter (1976) Schechter, P. 1976, ApJ, 203, 297
- Schlegel, Finkbeiner, & Davis (1998) Schlegel, D. J., Finkbeiner, D. P., & Davis, M. 1998, ApJ, 500, 525
- Schweizer & Seitzer (1992) Schweizer, F., & Seitzer, P. 1992, AJ, 104, 1039
- Skrutskie et al. (1997) Skrutskie, M. F., et al. 1997, in ‘The Impact of Large Scale Near-IR Sky Surveys’, eds. F. Garzon et al., p 25. (Dordrecht: Kluwer Academic Publishing Company)
- Somerville & Primack (1999) Somerville, R. S., & Primack, J. R. 1999, MNRAS, 310, 1087
- Somerville et al. (2004) Somerville, R. S., Lee, K., Ferguson, H. C., Gardner, J. P., Moustakas, L. A., & Giavalisco, M. 2004, ApJ, 600, 171
- Spergel et al. (2003) Spergel, D. N., et al. 2003, ApJS, 148, 175
- Stoughton et al. (2002) Stoughton, C., et al. 2002, AJ, 123, 485
- Strateva et al. (2001) Strateva, I., et al. 2001, AJ, 122, 1861
- Terlevich, Caldwell, & Bower (2001) Terlevich, A. I., Caldwell, N., & Bower, R. G. 2001, MNRAS, 326, 1547
- Toomre & Toomre (1972) Toomre, A., & Toomre, J. 1972, ApJ, 178, 623
- Totani & Yoshii (1998) Totani, T., & Yoshii, Y. 1998, ApJ, 501, L177
- Trager et al. (2000) Trager, S. C., Faber, S. M., Worthey, G., & González, J. J. 2000, AJ, 120, 165
- Treu et al. (2002) Treu, T., Stiavelli, M., Casertano, S., Møller, P., & Bertin, G. 2002, ApJ, 564, L13
- Tully et al. (1998) Tully, R. B., Pierce, M. J., Huang, J.-S., Saunders, W., Verheijen, M. A. W., & Witchalls, P. L. 1998, AJ, 115, 2264
- van de Ven, van Dokkum, & Franx (2003) van de Ven, G., van Dokkum, P. G., & Franx, M. 2003, MNRAS, 344, 924
- van Dokkum & Franx (2001) van Dokkum, P. G., & Franx, M. 2001, ApJ, 553, 90
- van Dokkum et al. (2000) van Dokkum, P. G., & Franx, M., Fabricant, D., Illingworth, G. D., & Kelson, D. D. 2000, ApJ, 541, 95
- van Dokkum et al. (2001) van Dokkum, P. G., Stanford, S. A., Holden, B. P., Eisenhardt, P. R., Dickinson, M., & Elston, R. 2001, ApJ, 552, L101
- van Dokkum et al. (2003) van Dokkum, P. G., et al. 2003, ApJ, 587, L83
- Vazdekis et al. (2001) Vazdekis, A., Kuntschner, H., Davies, R. L., Arimoto, N., Nakamura, O., & Peletier, R. 2001, ApJ, 551, L127
- White & Frenk (1991) White, S. D. M., & Frenk, C. S. 1991, ApJ, 379, 52
- Wolf et al. (2001a) Wolf, C., Meisenheimer, K., Röser, H.-J. 2001, A&A, 365, 660 (W01)
- Wolf et al. (2001b) Wolf, C., et al. 2001b, A&A, 365, 681
- Wolf et al. (2003) Wolf, C., Meisenheimer, K., Rix, H.-W., Borch, A., Dye, S., & Kleinheinrich, M. 2003, A&A, 401, 73 (W03)
- Yan & Thompson (2003) Yan, L., & Thompson, D. 2003, ApJ, 586, 765
- Ziegler et al. (2001) Ziegler, B. L., Bower, R. G., Smail, I., Davies, R. L., Lee, D. 2001, MNRAS, 325, 1571
Appendix A Red-Sequence Galaxies in the Local Universe

Because of its homogeneity and color information, the SDSS Early Data Release (EDR; Stoughton et al., 2002) offers an ideal comparison sample to COMBO-17 at redshift zero. In order to compare as fairly as possible with COMBO-17, we choose to synthesize , , and magnitudes from SDSS data, using the bandpasses that were used to construct COMBO-17 rest-frame magnitudes. We adopt the transformations:
| (A1) | |||
| (A2) | |||
| (A3) |
which were derived from the single stellar populations from the Pégase stellar population synthesis model, and are valid for stellar populations between 1/200 and 5 solar metallicity, and ages between 50 Myr and 20 Gyr. These transformations are dominated by the systematic zero point uncertainties (in absolute terms) of the SDSS and Johnson photometric system, and by limitations of the SDSS Petrosian magnitude. These uncertainties are likely mag in terms of color, although absolute calibration of or -band data is always challenging. SDSS EDR galaxies were chosen to have measured redshifts and a reddening-corrected Petrosian magnitude in between , yielding a total sample of 3592 galaxies. The Petrosian magnitude of concentrated (i.e. early-type) galaxies is corrected by mag to crudely account for the well-known shortfall of Petrosian magnitudes for centrally-concentrated galaxies (e.g., Blanton et al., 2003b).
We show the distribution of synthesized color against for a volume-limited SDSS subsample in the left-hand panel of Fig. 6. Galaxies are weighted by the inverse of the volume within which they are observable (), and are selected to have a uniform distribution in terms of . Since SDSS is an apparent magnitude-limited survey, only a small fraction of the bright, distant galaxies are selected for inclusion on this plot, whereas the fainter galaxies which are visible over a much smaller volume are selected multiple times. We choose to construct a sample of 2000 galaxies with (to roughly match the magnitude cutoff for galaxies at ), and we add random color and magnitude offsets with and to allow the reader to see multiply-included galaxies explicitly. This SDSS control sample shows a CMR with scatter 0.16 mag; this large scatter is expected, as the total colors we used have typical uncertainties mag, after observational error and evolution and -correction errors are accounted for. The intercept of the CMR is consistent with the intercept of the Abell 754 galaxy cluster (McIntosh, Rix, & Caldwell, 2004) and the Nearby Field Galaxy Survey (Jansen et al., 2000) morphologically-classified early-type galaxy CMR to within 0.1 mag. This kind of offset is not unexpected given the difficulty of calibrating absolute photometry to better than 10%.
Following Bell et al. (2003), we construct a rest-frame -band luminosity function of red-sequence galaxies (redder than the dashed line in Fig. 6) using the formalism. Galaxy selection for inclusion in this luminosity function is unbiased by any zero-point uncertainty in calibration, as this criterion is applied relative to the ridge-line of the CMR, which is measured using the same data. In order to constrain the effects of magnitude error (from photometric redshift error) on the luminosity function (as discussed by Chen et al., 2003), we convolve our -band luminosities with a random 0.3 mag error, which simulates a at (our lowest redshift bin). We also constrain the faint-end slope , to match with the COMBO-17 luminosity function determinations. The Schechter function fit parameters are , , , and (random errors only). The luminosity function calculated in this way is shown by the solid black circles and solid line in the right-hand panel of Fig. 6. For reference, a Schechter function fit to the unconvolved (i.e. real) -band synthesized luminosity function is shown by the dotted line. The of this fit is mag fainter than the convolved fit (with corresponding increase of to compensate); this modest offset is the maximum bias that we expect in the Schechter fit parameters because of our use of 17-passband derived photometric redshifts. This is in agreement with Chen et al. (2003), who show that we would expect only a modest bias towards brighter because of our relatively small photometric redshift uncertainty. The uncertainty in luminosity density is roughly 10% in a systematic sense; this error is dominated by uncertainties in absolute magnitude calibration and in correcting the luminosity function normalization to the observed all-sky density of galaxies.
For more discussion of the selection, photometric parameters, luminosity function estimation, and uncertainties, see Bell et al. (2003).