Abstract
Black holes with masses dominate the accretion history of the Universe. These black hole masses are typical of those found in radio-selected galaxies today, suggesting that the giant elliptical hosts of low redshift radio galaxies were the hosts of powerful, mostly radio-quiet, quasars in the high redshift Universe. The reason that all radio galaxies are found in such hosts may be the correlation of black hole mass with radio luminosity, but it is emphasized that accretion rate too plays an important role in the production of powerful radio jets. The tight relation of luminous, high redshift, radio galaxies is probably a selection effect due to the selection on high black hole masses and high accretion rates. Luminous radio galaxies are the radio-loud part of the “quasar-2” population, and the ratio of radio-loud quasars to luminous radio galaxies, about 1:1, is so far our only good estimate of the relative numbers of quasar-1s and quasar-2s. The numbers of radio-quiet and radio-intermediate quasar-2s are still uncertain, but a much larger population than the quasar-1s would conflict with constraints from the present-day black hole mass density. A comparison of the number densities of dark matter haloes and the high redshift quasars, however, suggests that there are plenty of dark haloes capable of hosting the known high redshift AGN and thus room for a significant, but not huge, quasar-2 population.
Chapter 0 Massive Black Holes at High
Redshifts
1 Introduction
The most massive black holes () are of particular interest as it is the quasars containing these black holes which contribute most to the integrated accretion luminosity of the Universe at the height of the “quasar epoch” at . Their hosts today, giant ellipticals, are also typically seen as the hosts of nearby luminous quasars and radio galaxies. Furthermore, even out to radio galaxies are still the most luminous galaxies known at any redshift. In this paper I begin by discussing correlations between radio luminosity and the properties of the AGN (black hole mass, accretion rate and (possibly) spin). I then discuss the radio galaxy relation and its implications for the nature of radio-loud AGN and their host galaxies. Another point about which there was some discussion at the meeting was the obscured “quasar-2” population, so I have added a brief survey of the current state of radio, IR and X-ray selection of dust reddened/obscured quasars. Finally, I conclude with a discussion of how we might relate the number densities of high mass black holes as measured by AGN luminosity functions to the number densities of massive dark matter haloes at high redshift, and briefly discuss the uncertainties in this calculation.
2 The Production of Powerful Radio Jets
1 Black hole mass
The ability to estimate black hole masses of AGN from H linewidths has provoked a large number of papers which attempt to relate black hole mass to the radio properties of the AGN, with varying degrees of success (Laor 2000; Lacy et al. 2001; Boroson 2002; Ho 2002; Oshlack, Webster & Whiting 2002; Woo & Urry 2002). The relationship clearly has a lot of scatter; at least at low redshift, all luminous AGN are found in massive galaxies with correspondingly massive black holes, and the difference in the mean black hole masses between radio-loud and radio-quiet objects (if any) is small. Weak intrinsic correlations can easily be masked through orientation effects, however, due to a combination of both beamed radio emission and orientation-dependence of broad-line widths (Jarvis & McLure 2002). Nevertheless, it is also true that samples in which correlations have been found, although consistently selected, complete, and mostly consisting of steep-spectrum objects free from orientation bias, have been fairly small ( quasars). Deeper radio surveys, combined with the Sloan quasar survey, are probably needed before a definitive statement can be made on the basis of linewidths alone. However, host galaxies can provide good, orientation-independent estimates of black hole masses, either from the host magnitudes or (in the case of nearby radio galaxies and BLLacs) from measurement of the velocity dispersion of the host galaxy, and all the evidence so far from such studies points to radio-luminous AGN being found only in the most massive galaxies, with massive black holes (e.g. McLure et al. 1999; O’Dowd, Urry & Scarpa 2002; Barth, Ho & Sargent 2003; Bettoni et al. 2003). For example, FRI radio sources, with very low accretion powers, but relatively high radio luminosities (and very high radio-loudnesses) are always hosted by giant elliptical galaxies, whereas Seyfert galaxies and LINERs with similar accretion luminosities exist in a large range of hosts, on average less massive.
2 Accretion rate
The role of accretion rate is well-illustrated by the radio luminosity – emission line luminosity correlation for steep-spectrum radio galaxies, which extends over five orders of magnitude in radio luminosity (e.g. Willott et al. 1999; Figure 1.1). With only one or two exceptions in samples totalling several hundred, all such radio galaxies are hosted by giant ellipticals with luminosities of and above, and thus have a very narrow range of black hole masses (). The range in radio luminosity must therefore derive principally from the range in accretion rate. Interestingly, the correlation is only close to linear at the highest radio/emission line luminosities, and at low luminosities the logarithmic slope of the correlation decreases to about 0.3 (Zirbel & Baum 1995). This suggests that radio jet production could become more efficient at low accretion rates, leading to the anticorrelation of radio-loudness (i.e. the ratio of radio luminosity to AGN accretion luminosity) and accretion rate relative to the Eddington limit noted by Ho (2002). Samples of local radio galaxies, with their small range of black hole masses but large range of accretion rates show no correlation of black hole mass with radio luminosity (Bettoni et al. 2003), as expected if their range in radio luminosities is dominated by their range of accretion rates.

3 The Relation for Radio Galaxies
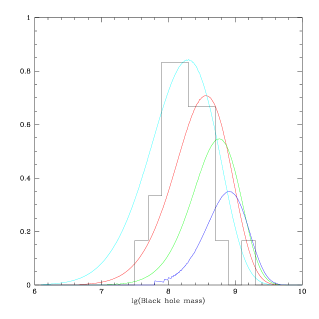
Ever since the early 1980’s when Lilly & Longair (1982) first published their -band photometry of powerful 3C radio galaxies, the cause of the good correlation between -band flux and redshift, and its implication – that radio galaxies exist only in the most massive galaxies – has been a puzzle. This is not only true locally, but continues to be the case out to at least (de Breuck et al. 2002; Jarvis et al. 2002). Initially, it was thought that emission-line and nuclear contamination by the AGN might dominate the -band emission of high- radio galaxies, but, although this seems to be true in a few cases (e.g. Eales & Rawlings 1993), it does not seem to be the case in general. The advent of redshift surveys of radio source samples significantly fainter than 3C, where AGN contamination of the -band light is negligible, allowed us to show that the bulk of the light in high- radio galaxies is indeed stellar (Lacy, Ridgway & Bunker 2000; Willott et al. 2002), and this has recently been confirmed by HST NICMOS imaging of the 3C sample itself, where the resolution is high enough to separate AGN-related emission from the stellar light (Zirm et al. 2003). As has been pointed out before (Rawlings 2003; Kukula et al. 2001), this is consistent with the observed correlation of black hole mass and radio luminosity (most radio galaxies are steep spectrum objects, and thus avoid the complications of beaming). With the quantitative estimate of the dependence of radio luminosity on black hole mass from Lacy et al. (2001), we can predict the distribution of black hole masses in a sample of radio-selected objects with radio luminosities above a given threshold. Figure 1.2 shows this calculation for 5GHz radio luminosity cuts of , compared to the black hole mass distribution obtained from the velocity dispersion data for 3C radio galaxies of Smith et al. (1990). Pushing to the higher radio luminosities of high redshift radio galaxies narrows the distribution further, as the Schechter function cutoff in the black hole mass distribution comes into play, and the accretion rates approach the Eddington limit, explaining the tightness of the relation. This also explains the radio-luminosity dependence of the host galaxy magnitudes. Selection effects mean that all high- radio galaxies have similar, high, accretion rates relative to the Eddington limit, leaving black hole mass as the only variable.
Differences between radio-loud and radio-quiet AGN hosts seem particularly pronounced at high redshift, where both Kukula et al. (2001) and Ridgway et al. (2001) note a 2 magnitude difference between the host galaxies of radio-loud quasars/radio galaxies and radio-quiet quasars. Why this should be so much stronger an effect at high redshift than locally is unclear.
4 Dust-reddened and Obscured Quasars
One of the fundamental tests of the “standard model” – that black holes form by unobscured radiative accretion of matter – is that the total mass density in black holes today, times a plausible accretion efficiency, should equal the integrated luminosity density from quasars. Recently, Yu & Tremaine (and Yu, these proceedings) have updated the original analysis of Soltan (1982) using the early-type galaxy luminosity function from the Sloan Digital Sky Survey (SDSS). Their analysis suggests that the agreement between these two numbers is remarkably good. This good agreement would suggest that there is little room for a substantial population of quasars whose apparent luminosity is decreased by dust obscuration, apparently consistent with the small numbers of reddened quasars found, even in the SDSS. Dust-reddened quasars are, however, notoriously difficult to find, being strongly selected against in any optically-based, magnitude-limited survey (e.g. Lacy et al. 2002), and it is possible that many more intrinsically luminous quasars remain to be discovered. Certainly, in the parts of parameter space where we have been able to define “complete” populations of AGN independent of reddening towards the nucleus, namely, IRAS-selected Seyfert galaxies and radio-luminous AGN, we typically find significant populations of AGN whose quasar nucleus is obscured by absorbing columns of dust, with rest-frame extinctions in the range . (For simplicity I’ll refer to the whole of this population as “quasar-2s” even though some of these objects with lower extinctions often have broad lines visible in near-infrared or deep optical spectra.)
1 Current estimates of the numbers of quasars-2s
Radio surveys
Radio-loud quasar-2s have been known for many years in the form of radio galaxies. Although it now seems clear that, at lower luminosities, not all radio galaxies contain hidden quasars, most radio galaxies with radio luminosities above contain hidden quasars, and comprise about half the total radio source population at this radio luminosity and higher (Willott et al. 2000). Radio surveys are unbiased with respect to dust reddening, but even relatively deep surveys such as FIRST do not go deep enough to find the bulk of the quasar population. By matching the 2MASS near-infrared survey with the FIRST radio survey, and searching for objects which disappear on the Palomar Observatory Sky Survey we have been successful at finding radio-intermediate quasars with moderate rest-frame reddenings (e.g. Lacy et al. 2002; Gregg et al. 2001). Most quasars-2s will be missing even in 2MASS (our study is most sensitive to for quasars with , compared to a typical Seyfert 2 or radio galaxy reddening of towards the AGN), but comparing the fractions of moderately-obscured quasars in the 3CRR radio-loud sample (Simpson, Rawlings & Lacy 1999) with our 2MASS findings indicates that the fraction of obscured quasars would be similar if the distributions of rest-frame reddenings are the same in our FIRST-2MASS sample as they are in 3CRR. This would imply that about half of all radio-intermediate quasars are dust-reddened.
Hard X-ray surveys
Observations with Chandra, in particular the deep surveys, have revealed large numbers of AGN, but typically these have been low luminosity objects, with a few notable exceptions (e.g. Norman et al. 2002). One of the reasons for this may be simply that the Chandra deep surveys cover very little sky area, and thus sample relatively small volumes and expect to find very few luminous objects. Crawford, Ghandi & Fabian (2003) use a serendiptous Chandra survey to cover a much larger sky area and can thus find rare objects like high luminosity AGN. This survey has already found several plausible quasar-2s. As Fabian (these proceedings) and Gandhi & Fabian (2003) discuss, however, the evidence from the deep surveys suggests that the obscured AGN are predominately of low luminosity, and thus accretion onto them contributes little to the local mass density of black holes. We will probably have to wait until Chandra serendipitous surveys find a statistically-useful sample of obscured quasars before this can be accurately determined.
IR surveys
Cutri (2003) and collaborators have used a near-IR color criterion to successfully select dust-reddened quasars from the 2MASS survey, but their technique is again limited to a fairly narrow range in rest-frame reddening. Fortunately, the hot dust component in obscured quasars will be very visible in the mid-IR. Already, a red FeLoBAL quasar has be found by ISO (Duc et al. 2002) and many more should appear in the SIRTF surveys. Although the most obscured quasars in the SIRTF surveys will be hard to differentiate from starbursts on the basis of IR/optical SEDs alone, moderately obscured quasars with should stand out on the basis of near to mid-IR excesses from hot dust emission near the nucleus.
2 How many quasar-2s might there be?
If the fraction of obscured radio-quiet quasars is similar to the fraction in radio-loud samples, then the additional factor of two in quasar luminosity density would probably not be a major problem for the Soltan argument, given the uncertainty in, e.g., relating bulge luminosity to black hole mass. There is one good reason to expect more radio-quiet quasars to be obscured, however. There are more radio-quiet quasars on the high-accretion rate end of Eigenvector 1 (Boroson 2002), and high accretion rates are typically linked to absorption by Broad Absorption Line (BAL) systems, and thus to excess reddening (Sprayberry & Foltz 1992).
5 Number Densities of High-Redshift Black Holes
One potentially exciting consequence of the relationship between galaxy velocity dispersion and black hole mass is the ability to directly tie AGN populations to the number densities of the massive black holes hosting them. Since the pioneering work of Efstathiou & Rees (1988), several calculations have used progressively more refined versions of the Press-Schechter method to derive dark halo mass and temperature/velocity distributions as a function of redshift. Recently Mo & White (2002) have computed these for a -dominated cosmology. Most relevant to our work is the halo velocity distribution, , rather than the halo mass, . As Mo & White point out, decreases with increasing redshift even in the absence of halo mergers and accretion, because the cutoff radius within which the halo mass is measured is defined as a fixed overdensity relative to the cosmic mean at redshift , and thus increases as decreases.
To compare the numbers of dark haloes and black holes, however, we need to know how the black hole mass – velocity dispersion relation evolves, and how to relate the host galaxy velocity dispersion () to . Progress on the first of these problems is being made fairly rapidly. The width of the [OIII]5007 emission line can be used as a crude measure of , though it is clear that there is a lot of scatter in this relation (Shields et al. 2003; Boroson 2003; Heckman, these proceedings). Also promising is the use of quasar host luminosities to estimate black hole masses independent of AGN-related emission lines using HST or AO data (Dunlop, these proceedings, Lacy et al. 2002b). Progress on the second question, the relationship of to , is more difficult. This is because the dark matter in the cores of the dark matter haloes needs to be replaced with the baryonic matter that dominates the mass distribution in the centers of early-type galaxies today via a mechanism that is not yet understood. Kochanek (1994) examined this problem observationally by fitting the velocity dispersion profiles of 37 nearby elliptical galaxies, and found no significant differences between and , but his modeling assumed only a simple isothermal sphere model for the dark matter. Ferrarese (2002) and Wyithie & Loeb (2002) examined this problem from a theoretical point of view, and obtained essentially the same result for galaxies, namely that , though predicting a non-linear relationship which diverges from this for more or less massive galaxies. Somerville (these proceedings), however, suggests that current hierarchical galaxy formation models predict no straightforward relation between the two velocity dispersions, and that one might expect a large scatter depending on the exact process by which dark matter in the halo core is replaced by the baryonic matter which dominates the inner parts of galaxies today.
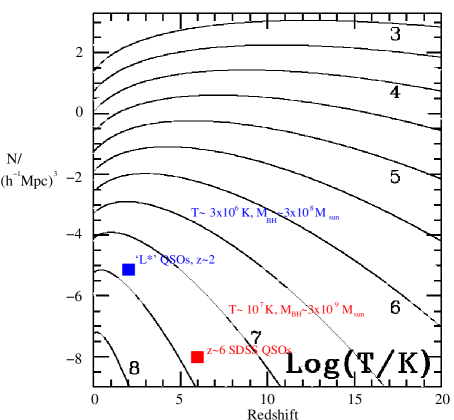
If we assume for the moment that dark matter and stellar velocity dispersions are similar, we can use the current best estimates of the quasar number density to compare with the number of dark haloes, and, assuming accretion at the Eddington rate, we can thus obtain an estimate of the duty cycle and typical quasar lifetime to compare with the independent estimate obtained from the Soltan argument by Yu & Tremaine (2002). It turns out (Figure 1.3) that there are times as many dark haloes capable of hosting quasars as there are quasars at , implying a duty cycle of during the yr “quasar epoch” and hence a quasar lifetime yr. This compares with the estimates of Yu & Tremaine (2002), who estimate lifetimes for quasars yr. This relatively small difference may be due to stellar velocity dispersion indeed being a poor estimator of dark matter velocity dispersion, or the local estimate of black hole mass density being low, e.g. because black holes are occasionally expelled from galaxies during 3-body interactions, or simply because the relation is still a little in error. Taken at face value, the halo numbers do leave some room for a quasar-2 population as much as a few times larger than the quasar-1 population, but a quasar-2 population an order of magnitude or larger than the quasar-1 population can probably be ruled out both on the basis of the Soltan argument and the numbers of available dark haloes.
Another interesting feature of Figure 1.3 comes from comparing the number densities of haloes capable of hosting highly-luminous quasars at and the number density of such quasars found in the SDSS. There are times as many haloes as observed quasars. As these black holes must be accreting continuously close to the Eddington rate to form their very high mass black holes by , one might speculate that a large population of obscured quasars with very massive black holes could exist at high redshifts.
The number densities of radio galaxies and radio-loud quasars at are comparable to the number densities of optically-selected quasars of similar black hole mass (as estimated from their host galaxy luminosities). The radio galaxies typically have much lower accretion rates, however, suggesting that they are the less active, but perhaps longer-lived, radio-bright equivalents of the quasars.
6 Conclusions
The ability to estimate black hole masses in AGN has provided us with an excellent opportunity to investigate correlations between AGN properties such as the presence of powerful radio jets or BAL flows with black hole mass and accretion rate. Although such studies are in their early phases and sparking much controversy, it seems likely that some answers to basic questions (Why are radio galaxies always giant ellipiticals whereas radio-quiet AGN can exist in spirals? Why is the relation for radio galaxies so tight? Is there a link between BAL flows and high accretion rates? Why are radio-loud BAL quasars rare?) can come from such studies using samples selected to cover appropriate ranges in parameter space. A speculative “Grand Unified Scheme” for AGN using black hole mass, accretion rate and orientation as the principal variables can even be constructed (Lacy 2003).
The tight constraints on integrated quasar number densities at the peak of the quasar epoch place strong constraints on the allowed fraction of quasar-2s. Nevertheless, such objects continue to be found with the new generations of all-sky, large area, multi-wavelength surveys, and what little evidence we have so far suggests that true quasar number densities could be at least a factor of two higher than those of quasars detected in optical and soft X-ray surveys.
The use of high redshift AGN for constraining galaxy formation models has also received a boost from the ability to estimate black hole masses from broad line widths (e.g. Vestergaard, these proceedings). Relating the dark matter velocity dispersion to that of the galaxy which forms inside it remains a problem which needs to be further addressed both observationally and in galaxy formation models. However, it seems clear that very massive black holes existed early in the history of the Universe, making galaxy formation models which form large galaxies early (e.g. Granato et al. 2001; Loeb & Peebles 2003) particularly attractive.
7 Acknowledgements
This work was carried out at the Jet Propulsion Laboratory, California Institute of Technology, under contract with NASA.
References
- [1] Barth, A., Ho, L. C. & Sargent, W. L. W., 2003, ApJ, 583, 134
- [2] Bettoni, D., Falomo, R., Fasano, G. & Govoni, F. 2003, A&A, in press (astro-ph/0212162)
- [3] Boroson, T. A. 2002, ApJ, 565, 78
- [4] Boroson, T. A. 2003, ApJ, in press (astro-ph/0211372)
- [5] Crawford, C. S., Gandhi, P. & Fabian, A. C. 2003, Astr. Nachr., in press (astro-ph/0211400)
- [6] Cutri, R. 2003, in IAU Colloq. 184, AGN Surveys, ed. R. F. Green, E. Ye. Khachikian, & D. B. Sanders (San Francisco: ASP), in press
- [7] de Breuck, C., van Breugel, W., Stanford, S. A., Röttgering, H., Miley, G., & Stern D. 2002, AJ, 123, 637
- [8] Duc, P. A., et al. 2002, A&A, 389, L47
- [9] Eales, S., & Rawlings, S. 1993, ApJ, 411, 67
- [10] Efstathiou, G. P., & Rees, M. J. 1988, MNRAS, 230, 5
- [11] Ferrarese, L. 2002, ApJ, 578, 90
- [12] Gandhi, P., & Fabian, A. C. 2003, MNRAS, in press (astro-ph/0211129)
- [13] Gebhardt, K., et al. 2000, ApJ, 539, L13
- [14] Gregg, M., Lacy, M., White, R. L., Glikman, E., Helfand, D., Becker, R. H., & Brotherton, M. S. 2001, ApJ, 564, 133
- [15] Ho, L. C. 2002, ApJ, 564, 120
- [16] Jarvis, M. J., & McLure, R. J. 2002, MNRAS, 337, 109
- [17] Kochanek, C. S. 1994, ApJ, 436, 56
- [18] Kukula, M., Dunlop, J. S., McLure, R. J., Miller, L., Percival, W. J., Baum S. A., & O’Dea, C. P. 2001, MNRAS, 326, 1533
- [19] Lacy, M. 2003, in Active Galactic Nuclei: from Central Engine to Host Galaxy, ed. S. Collin, F. Combes, & I. Shlosman (San Francisco: ASP), in press
- [20] Lacy, M., Bunker, A. J., & Ridgway S. E. 2000, AJ, 120, 68
- [21] Lacy, M., Gates, E. L., Ridgway, S. E., de Vries, W., Canalizo, G., Lloyd, J. L., & Graham, J. R. 2002, AJ, 124, 3023
- [22] Lacy, M., Gregg, M., Becker, R. H., White, R. L., Glikman, E., Helfand, D., & Winn, J. N., 2002, AJ, 123, 2925
- [23] Lacy, M., Laurent-Muehleisen, S. A., Ridgway, S. E., Becker R. H., & White R. L. 2001, ApJ, 551, L17
- [24] Laor, A. 2000, ApJ, 543, L111
- [25] Lilly, S. J., & Longair, M. J. 1982, MNRAS, 199, 1053
- [26] Loeb, A., & Peebles, P. J. E. 2003, ApJ, submitted (astro-ph/0211465)
- [27] McLure, R. J., Kukula, M. J., Dunlop, J. S., Baum, S. A., O’Dea, C. P., & Hughes, D. H. 1999, MNRAS, 308, 377
- [28] Norman, C., et al. 2002, ApJ, 571, 218
- [29] O’Dowd, M., Urry, C. M., & Scarpa, R. 2002, 580, 96
- [30] Oshlack, A. Y. K. N., Webster, R. L., & Whiting, M. T. 2002, ApJ, 576, 81
- [31] Rawlings, S. 2003, in IAU Symp. 199. The Universe at Low Radio Frequencies, ed. A. Pramesh Rao, G. Swarup & Gopal-Krishna, in press (astro-ph/0008067)
- [32] Ridgway, S. E., Heckman, T. M., Calzetti D., & Lehnert, M. 2001, ApJ, 550, 122
- [33] Shields, G. A., Gebhardt, K., Salviander, S., Wills, B. J., Xie, B., Brotherton, M. S., Yuan, J., & Dietrich, M. 2003, ApJ, 583, 124
- [34] Simpson, C., Rawlings S., & Lacy, M. 1999, MNRAS, 306, 828
- [35] Smith, E. P., Heckman, T. M., & Illingworth, G. D. 1990, ApJ, 356, 399
- [36] Soltan, A. 1982, MNRAS, 200, 115
- [37] Sprayberry D., & Foltz, C. B. 1992, ApJ, 390, 39
- [38] Willott, C. J., Rawlings, S., Blundell, K., & Lacy, M. 1999, MNRAS, 309, 1017
- [39] Willott, C. J., Rawlings, S., Blundell, K., & Lacy, M. 2000, MNRAS, 316, 449
- [40] Willott, C. J., Rawlings, S., Jarvis M. J., & Blundell, K. 2002, MNRAS, in press (astro-ph/0209439)
- [41] Woo, J.-H., & Urry, C. M. 2002, ApJ, 581, L5
- [42] Wyithe, J. S. B., & Loeb, A. 2002, ApJ, 577, 615
- [43] Yu, Q., & Tremaine, S. 2002, MNRAS, 335, 965
- [44] Zirbel, E. L., & Baum, S. A. 1995, ApJ, 448, 521
- [45] Zirm, A. W., Dickinson, M., & Dey, A. 2003, ApJ, in press (astro-ph/0211469)