The Incidence of Strong-Lensing Clusters in the
Red-Sequence Cluster Survey11affiliation: Based on observations collected at the Baade 6.5m
Telescope, the CFHT 3.6m telescope, and the CTIO 4m telescope.
Abstract
The incidence of giant arcs due to strong-lensing clusters of galaxies is known to be discrepant with current theoretical expectations. This result derives from a comparison of several cluster samples to predictions in the framework of the currently favored CDM cosmology, and one possible explanation for the discrepancy is that this cosmological model is not correct. In this paper we discuss the incidence of giant arcs in the Red-Sequence Cluster Survey (RCS), which again shows significant disagreement with theoretical predictions. We briefly describe a total of eight strong lens systems, seven of which are discussed here for the first time. Based on the details of these systems, in particular on the ratio of single to multiple arc systems, we argue that it may be possible to explain this discrepancy in the currently favored cosmology, by modifying the details of the lenses themselves. Specifically, the high incidence of multiple arc systems and their overall high redshift suggests that a sub-population of the global cluster population is responsible for much of the observed lensing. The lack of lensing clusters at in the RCS indicates that a property associated with clusters at early times results in the boosted lensing cross sections; likely a combination of ellipticity and elongation along the line of sight, substructure, and changes in the cluster mass profiles is responsible. Cluster mass, which should evolve to globally higher values toward lower redshifts, is clearly not the most significant consideration for the formation of giant arcs.
1 Introduction
The incidence of giant arcs due to the strong lensing effects of galaxy clusters is in principle calculable, given a known cluster population, a cosmology, and a source population (Bartelmann et al., 1998, hereafter B98). The cosmology has an effect on the expected result, both because of its effect on angular diameter distances, and more importantly by its effect on the lens population. The evolution of the space density of massive clusters with redshift is strongly affected by the parameters and (e.g., Oukbir & Blanchard, 1992; Carlberg et al., 1997; Bahcall & Fan, 1998), and to a lesser extent (e.g., Haiman, Mohr, & Holder, 2001). This has a strong effect on the expected lensing incidence. Moreover, the cosmology affects the internal details of the cluster lens population; significant sub-structure and ellipticity are known to boost lensing cross sections (e.g., Oguri, 2002; Bartelmann, Steinmetz, & Weiss, 1995) and the occurrence of such features is affected by cosmology (e.g., Richstone, Loeb, & Turner, 1992). Unfortunately, the internal properties of galaxy clusters are likely also affected by non-cosmological physics, including the detailed nature of dark matter (e.g., Meneghetti et al., 2001), and the effects of baryons on the cluster mass profile in the cluster core (e.g., Williams, Navarro, & Bartelmann, 1999). The source population also affects the incidence of arcs. These various complications make the prediction of arc statistics a challenging problem, and likely limits the cosmological impact of such studies.
However, B98 showed that the influence of cosmology on arc statistics is dramatic, with variations in arc counts of several orders of magnitude between extreme models. Given this sensitivity to cosmology, one might hope that this effect would dominate and allow one to use arc statistics as a cosmological test. Notably, both the results of B98 using the EMSS (Einstein Medium Sensitivity Survey) cluster sample and Zaritsky & Gonzalez (2002) using primarily the LCDCS (Las Campanas Distant Cluster Survey) cluster sample show that the observations clearly favor an open, low- universe. Both samples overproduce arcs in comparison to the currently favored flat CDM model by a factor of 10.
In this paper we describe another cluster arc sample which has far too many arcs compared to the standard expectation for a CDM cosmology. The cluster sample is drawn from the Red-Sequence Cluster Survey (RCS; Gladders & Yee, 2003) and includes five clusters with arcs in a primary sample drawn directly from the survey images and a further three from a secondary followup sample. We briefly describe the survey and each arc system in §2. In §3 we analyse the occurrence rates and redshifts of single- and multiple-arc clusters and from that conclude that internal lens structure, rather than cosmology, is the likely cause of the discrepancy.
2 The RCS Sample
The RCS is a 90 square degree - and -band imaging survey designed primarily to search for galaxy clusters to redshifts as high as (see Gladders & Yee, 2003, for further details). The images, acquired at the CFHT and CTIO 4m telescopes using mosaic cameras, are relatively shallow, with point source limits typically 24.8 mag in (Vega normalized) and 23.6 mag in (SDSS normalized). Despite this, the original survey contains 5 clusters with features interpreted as giant arcs due to strong lensing. We designate this the primary sample. An ongoing follow-up project, consisting in part of deeper -band imaging using the Baade 6.5m telescope of one hundred of the most significant RCS cluster candidates, has also turned up a secondary sample of 3 clusters with giant arcs, selected from a sample to date of 46 clusters.
In both samples, the arcs were detected by visual examination of known cluster fields, with the cluster found in each case as an over-density of red galaxies using a variant of the algorithm defined in Gladders & Yee (2000). Several of the brightest and most obvious arcs in the primary sample were found independently by a direct examination of images during the initial observing. The effective selection area for these brightest arcs in the primary sample is the full area of the RC. For some fainter arcs variations in seeing and sky brightness make the effective areas smaller; the images of clusters with arcs all have seeing better than one arcsecond, and approximately 80% of the RCS has similar image quality. Overall, the survey data for fields with arc clusters are typical, both in seeing and sky brightness. All of the RCS survey data has also been visually examined by various individuals to check the object finding in the primary processing, and a large fraction of the good-seeing data were re-examined by H. Hoekstra while checking all the weak-lensing results (Hoekstra et al., 2002). It is thus highly unlikely that comparable undiscovered arcs exist in the RCS survey data.
The secondary arc sample is drawn from data with much better seeing than the RCS data - a median seeing of 0″.45 for the run, with no image worse than 0″.7 - and all these data have been visually examined for arcs. No other arcs comparable to the three in the secondary sample exist in these data.
Below we briefly describe each arc system, and argue the strong-lensing interpretation for each object. A summary of the cluster and arc properties, including length-to-width ratios for the arcs, is given in Table 1. Table 1 includes a measure of the relative rank of the detection significance for each cluster. This is computed considering all RCS cluster candidates over the redshift spanned by all the lens candidates for the primary sample (), and within only the 46 clusters imaged so far when considering the secondary sample. Table 1 also provides an estimate of the surface brightness limits at 5, per square arcsecond, for the detection image for each arc.
2.1 Primary Sample
2.1.1 RCS0224.5-0002
Even considering only the ground-based data (Gladders, Yee, & Ellingson, 2002), this spectroscopically confirmed cluster is the single most obvious case of strong lensing in the RCS, with the most distant arc spectroscopically confirmed at . Recent HST imaging (Gladders et al., 2003) shows that the features visible in the ground-based data probably correspond to images of three different background sources, with two of the sources at a similar redshift. Sources at a similar redshift are clustered significantly on the distance scales relevant here, and so conservatively this represents a two-arc system to the depth imaged in the RCS. In the deeper HST observations, another fainter giant arc system - either a third or fourth arc system depending on interpretation - is also visible (Gladders et al., 2003).
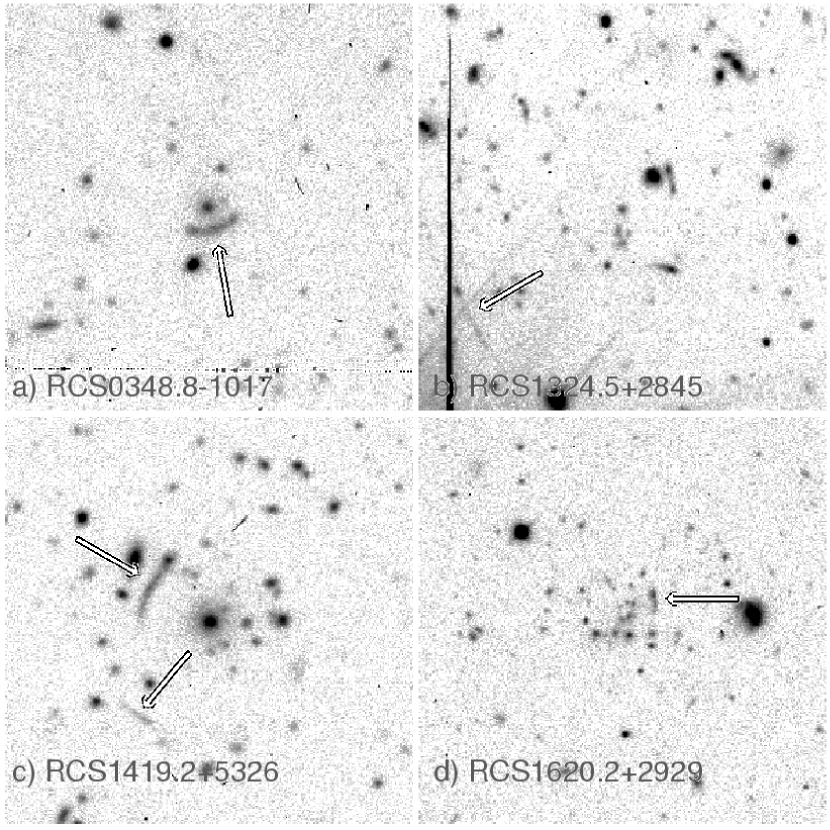
2.1.2 RCS0348.8-1017
This single arc, shown in Figure 1a, is apparently produced by a poor cluster at a photometric redshift of 0.800.05. The lens is at a lower significance than the lower limit for the primary RCS catalog. The arc is blue compared to other nearby objects; this fact, as well as the morphology and the object’s location with respect to an apparent poor cluster, argues for the lensing interpretation in this case.
2.1.3 RCS1324.5+2845
This extremely rich cluster, at a photometric redshift of 0.850.05, produces one apparent giant arc, and several other features which are suggestive of strong lensing. As can be seen in Figure 1b, follow-up of this system is complicated by the presence of two nearby bright stars. The interpretation of the extended feature as an arc is primarily based on its extremely elongated morphology, and tangential alignment with respect to the cluster center.
2.1.4 RCS1419.2+5326
RCS1419.2+5326, shown in Figure 1c, is a spectroscopically confirmed cluster (Ellingson et al., 2003) which produces two obvious giant arcs. These objects are both blue. The color, overall morphology, as well as the tangential arrangement with respect to the cluster core suggests a strong lensing interpretation. Moreover, note that the fainter of the two putative arcs is about twice as distant from the cluster center as the brighter arc. Giant arcs occur near critical curves, and the significant differences in radial position of these arcs makes it unlikely that they are at similar redshifts. The more distant arc also has a lower surface brightness, and it is also marginally redder. Based on these differences, we suggest that the two arcs correspond to images of two different background sources, with the fainter corresponding to a source at significantly higher redshift than the brighter.
2.1.5 RCS1620.2+2929
This spectroscopically confirmed compact and rich cluster (Ellingson et al., 2003) has one feature which is suggestive of an arc, and several other smaller sources with strong tangential shear apparently aligned about the cluster core. This arc candidate, shown in Figure 1d, has an unusual color compared to all other galaxies in the immediate field. The color of the galaxy as well as its morphology are consistent with a strong-lensing interpretation, but this should be considered the least secure arc candidate in the primary sample.
2.2 Secondary Sample
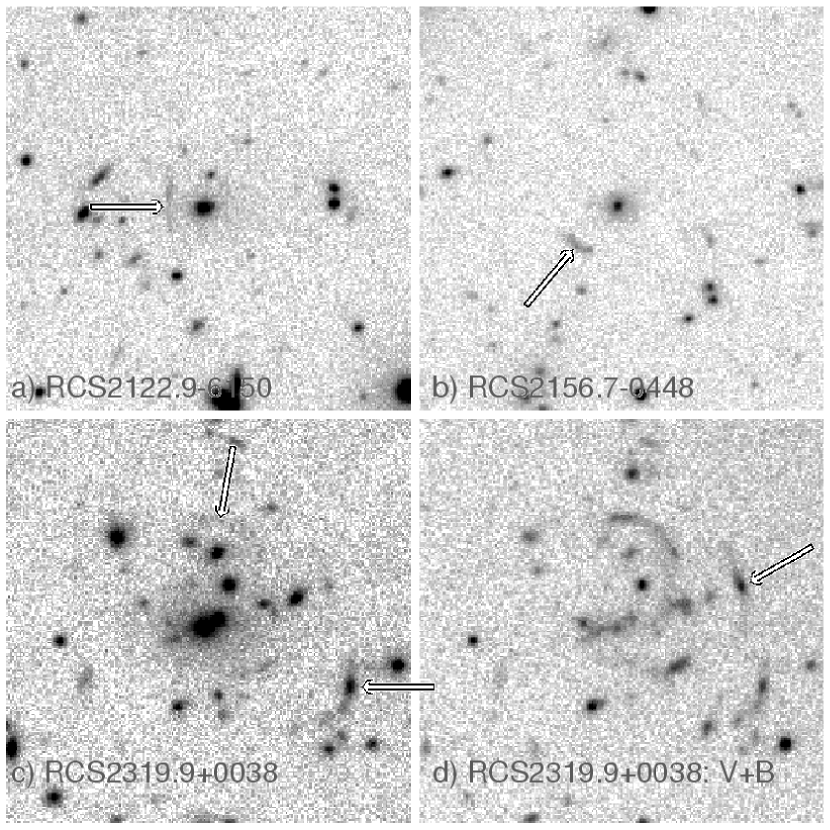
2.2.1 RCS2122.9-6150
This cluster is shown in Figure 2a, and is at a photometric redshift of 1.10.10. The giant arc candidate is obvious, consisting of an extended feature near and somewhat tangential to the apparent cluster cD. This object is not visible in the original RCS survey data and hence no useful color information is currently available.
2.2.2 RCS2156.7-0448
RCS2156.7-0448, shown in Figure 2b, is a rich cluster at a photometric redshift of 1.20.10. It has one candidate arc, located near the apparent cluster cD galaxy and tangential to it. This object also has a relatively uniform surface brightness along its entire length, arguing against it being a projection of several disk galaxies. The putative arc is barely visible in the original RCS survey imaging, and appears bluer than the cluster galaxies in that data. This should be considered the least-likely arc candidate in the secondary sample.
2.2.3 RCS2319.9+0038
This rich cluster is at a photometric redshift of 1.00.1. -band Baade 6.5m imaging, shown in Figure 2c, suggests the presence of two arcs. Bluer imaging, shown in Figure 2d, reveals that this is in fact a three arc system, and clearly confirms that RCS2319.9+0038 is another spectacular example of strong lensing by a high redshift cluster, comparable to RCS0224.5-0002. These data also show that one of the arcs is a -band dropout. For the purposes of constructing a statistical sample we consider only the -band data and treat this as a two arc system.
| Cluster Name | Redshift | Surface Brightness | Rank# | Arc Redshift(s) | Arc | Notes |
|---|---|---|---|---|---|---|
| RCS0224.5-0002 | 0.773 | 23.82 | 1 | 3rd(or 4th) fainter arc | ||
| 4.8786 | in HST imaging | |||||
| RCS0348.8-1017 | 0.800.05 | 23.63 | aaThe apparent poor cluster producing this arc does not appear in the primary RCS cluster sample, since its significance is below the threshold. | —— | ||
| RCS1324.5+2845 | 0.850.05 | 23.95 | 98 | —— | ||
| RCS1419.2+5326 | 0.64 | 23.97 | 16 | —— | ||
| —— | ||||||
| RCS1620.2+2929 | 0.87 | 23.93 | 20 | —— | tentative ID | |
| RCS2122.9-6150 | 1.200.10 | 24.10 | 31 | —— | ||
| RCS2156.7-0448 | 1.100.10 | 24.11 | 43 | —— | tentative ID | |
| RCS2319.9+0038 | 1.000.05 | 23.90 | 1 | —— | 3rd arc visible in | |
| bluer imaging |
Note. — Lens redshifts with error bars are photometric estimates, and are otherwise spectroscopic redshifts. Arc length-to-width ratios, , are reported as lower limits if the arc appears unresolved. Arc redshifts are either spectroscopic, photometric, or based on lens modeling. The quoted surface brightnesses are 5 magnitude limits per square arcsecond for the detection image for each arc: -band for the RCS primary sample, and -band for the secondary sample, Vega calibrated using Landolt (1992) standards in both cases. Uncertainties are less than 0.1 magnitudes.
3 Discussion
The standard prediction from B98 for the number of giant arcs due to clusters in a CDM universe is approximately one arc per 150 square degrees, integrated over , for sources at . Though the RCS cluster sample probes a somewhat different redshift range (in particular the secondary arc sample described above) the resulting differences should be factors of order unity. Even considering only the primary RCS arc sample (5 clusters, 7 arcs) and ignoring details of specific arc length-width sub-samples, we find disagreement with the Bartlemann CDM predictions by a factor of 10-20. Similar disagreements exist for the EMSS sample (B98) and the LCDCS (Zaritsky & Gonzalez, 2002).
There are three basic ways to increase the number of arcs predicted: increase the surface density of sources, increase the number of lenses, or increase the cross section of the lenses. Cosmology affects the latter two, but not the first. The number of sources, and their redshift distribution, is a well established observable, and is now in principle known to extremely faint limits due to the Hubble Deep Fields (e.g. Casertano et al., 2000, and references therein). The expected number of lenses is a strong function of the cosmology, and observably depends on the mass limit in a given sample. Establishing precisely the same limit in theoretical calculations is non-trivial and may represent a significant source of error in comparing observations to predictions. The cross section of individual lenses is also a function of mass, with more massive clusters having larger cross sections. Moreover, lensing cross sections can be strongly affected by such things as lens ellipticity (Oguri, 2002), projected secondary structures (Wyithe, Turner, & Spergel, 2001), internal cluster substructure (Bartelmann, Steinmetz, & Weiss, 1995), the presence of a central cD galaxy (Williams, Navarro, & Bartelmann, 1999), and the cluster mass profile (Takahashi & Chiba, 2001), at least some of which are also affected by cosmology (e.g., Richstone, Loeb, & Turner, 1992). The cross section of a given lens for a source at a given redshift is also a function of cosmology since this affects the size of the lens caustics in the source plane.
A further expression of the discrepancy between theory and observations is suggested by the relative proportion of single to multiple arc clusters. In either the RCS primary or secondary sample, in which arcs are found on the basis of examining images of uniform depth of a large number of clusters, the probability of two arcs occurring around any one cluster is approximately , if the probability of forming a single arc is merely . This ignores the effects of source redshift on the lensing cross section, but is of sufficient precision for the following discussion. If one makes the further simple assumption that all the lensing clusters are drawn from the same parent population, each member of which has a similar lensing cross-section, the implication from the primary sample is that the probability, , of forming an arc for any one cluster is 2/5. Similarly from the secondary sample. Both samples also contain one single-arc system with a tentative identification; exclusion of these systems implies even higher lensing probabilities. However, based on the detection rankings in Table 1, it appears that many of the individual clusters with arcs do not stand out in the context of the whole cluster sample, with many other clusters without arcs showing similar or greater cluster detection significance.
To produce the large proportion of multiple arc clusters seen in the RCS, we require at least some clusters with large lensing probabilities, and this conclusion is independent of the number of clusters considered. Given the large number of clusters in the RCS which do not show arcs, it seems likely that the distribution of lensing probabilities is strongly skewed, with a tail of high probability lenses. Mass is an obvious underlying property which might cause this, since variations in the cluster mass as given by the cluster mass function produces a small sub-population (the most massive clusters) which have an enhanced lensing cross section.
To investigate the effect of the cluster mass function on the expected proportion of single to multiple arc clusters, we use the cluster catalogs from the Hubble Volume Virgo simulations111The simulations used in this paper were carried out by the Virgo Supercomputing Consortium using computers based at the Computing Centre of the Max-Planck Society in Garching and at the Edinburgh Parallel Computing Centre. The data are publicly available at http://www.mpa-garching.mpg.de/NumCos (Evrard et al., 2002) to construct mock samples of clusters over the redshift and mass range explored by the RCS. In simple symmetric lens models the probability of forming giant arcs for any one cluster scales linearly with mass because the length of the caustic is proportional to mass; to form a giant arc one must cross the caustic, and so length is the relevant quantity. Detailed measurements of known strong lensing clusters suggest that the relationship between mass and lensing power is shallower than this (Williams, Navarro, & Bartelmann, 1999), though with significant scatter. Simulations conversely suggest that the scaling between mass and lensing cross section is steeper (e.g., Meneghetti, Bartelmann & Moscardini, 2003). We use the simplest model, with the lensing cross section proportional to mass, as a middle ground between these extremes. This is sufficient for the simple illustrative models shown here.
The lensing probability for each cluster in the mass function is set relative to a fiducial value, . , which is the lensing probability for a 5h-1M cluster, is arbitrarily adjusted in order to reproduce the number of single arc systems observed in the primary sample. This particular mass is chosen since it is approximately the lower mass limit used by B98 when comparing to arc numbers in the EMSS cluster sample (Le Fèvre et al., 1994).
The value of is a function of the lower mass limit used, since a lower mass limit yields a larger number of clusters in the mock catalog, and hence requires a lower values of in order to reproduce a fixed number of single arcs. Figure 3 shows the value of required to reproduce the number of single arc clusters observed, versus mass limit for limits ranging from 0.5h-1M⊙ to 5.5h-1M⊙. The resulting percentage of multiple to single arc clusters is also shown. Limits greater than 5.5h-1M⊙ produce a sample with an insufficient number of clusters and are hence not considered. At any reasonable mass cut, this model arcs compared to the results of B98, and always multiple-arc clusters as observed by the RCS. Overall, simply scaling the cluster lensing cross section by the cluster mass produces a poor fit both to the RCS observations and previous extensive modeling efforts.
A better match to both the results of B98 and the RCS than that shown in Figure 3 is achieved if the distribution of probabilities is even more skewed than one would infer from the cluster mass function. As a simple test, we consider an ad hoc model in which a small fraction of clusters have a dramatically increased lensing cross section. Such a modification has the advantage of keeping the lensing probabilities for the bulk of the cluster fairly low. B98 modeled only a small sample of clusters (only nine in any one cosmology) and might well not have included any of these suggested extreme systems. Note also that changes in source populations and cosmology may do little to produce changes in the of lensing probabilities. Effects producing a global increase in the lensing probabilities will enhance the ratio of multiple to single arcs found, but at the expense of worsening the already poor agreement with the B98 CDM result.
Figure 4, similar to Figure 3, shows the result of a particular toy model in which a random ten percent of all clusters have lensing cross sections increased by a factor of ten. Figure 4 considers the lensing probabilities both for the entire cluster population and only the “typical” clusters; the former produces overall lensing probabilities consistent with the EMSS as seen by Luppino et al. (1999), while the latter produces probabilities much closer to those modeled by B98. The percentage of multiple arc clusters produced is now significantly higher, with values not inconsistent with those seen from the primary and secondary RCS samples. Notably, further observations of the two most striking double-arc clusters in this sample also suggest that these clusters are remarkably good lenses, and hence that positing a sub-population of “super lenses” is not unreasonable. As discussed in §2.2.1, bluer and deeper observations of both clusters reveal further giant arc features in each system. In particular, RCS0224-0003 shows what can be interpreted as three giant arc systems in the initial ground-based images, and clearly shows a fourth giant arc system in relatively shallow HST imaging (Gladders et al., 2003).
The redshift distribution of the RCS primary arc sample provides conclusive evidence that, as suggested by the above toy models, mass is not the dominant factor which determines lensing cross sections. For the more massive clusters which make up the bulk of the parent population of lensing clusters, the RCS is complete from about (Gladders & Yee, 2003). However, all the RCS clusters in the primary sample are at , despite the fact that clusters at moderate redshifts(0.3-0.4) are better lenses because their caustics are bigger for distant sources, and that massive clusters are more abundant at lower redshift. Qualitatively, based on the Hubble Volume simulations used above, and taking 5.0h-1M⊙ as a cut for massive clusters, the median redshift of massive clusters is only 0.49 in a , universe, and less than 30% of all such clusters are at a redshift higher than the lowest redshift arc cluster seen in the RCS primary sample. The probability that the RCS primary arc cluster sample is drawn from this population of simulated massive clusters is less than 0.001. Something must act to reduce the cross section of analogs to the RCS primary sample clusters at later times.
Observations of clusters at redshifts similar to the RCS arc clusters indicate that massive high-redshift clusters are often elongated or occur with associated superstructure (e.g., Gioia et al., 1999) and likely have significant substructure; seen in appropriate projection such systems will have enhanced lensing cross sections. If the formation process of clusters tends to produce more such systems at higher redshifts, this might explain both the high proportion of multiple arc clusters seen, and their tendency to be at unexpectedly high redshifts.
Another possible explanation of the redshift distribution of the RCS lenses is that the cluster potentials are more concentrated at high redshift . Such an effect is well known from n-body simulations, in which the concentration of a given halo is observed to be correlated with the value of at the redshift at which it collapsed (Navarro, Frenk, & White, 1997). The RCS sample may be the first sample with sufficient redshift grasp to observe this effect. Moreover, the multiple-arc clusters, particularly RCS0224-0003, have regular concentric arcs; this implies that a single potential is responsible for the lensing, and that it is unlikely to be highly substructured. This contrasts with the multiple arc systems seen in deep HST imaging around extremely massive lower redshift clusters (e.g. Kneib et al., 1996) in which substructure clearly has a significant effect.
Finally, we note that in general, better agreement is found with the results of B98 by comparing the RCS samples to an open CDM model, since this model produces approximately the correct number of arcs. The results of B98 show that a significant portion of this increase in arcs numbers is due to larger lensing cross sections, in addition to a global increase in the number of clusters in such a cosmology. It is unclear whether this may result in the skewed lensing probability distribution required by the RCS data, and whether an open CDM model would correctly reproduce the multiple to single arc ratio observed. It would be useful to redo the calculations of B98 with this in mind, in particular paying attention to multiple arc systems. Though numerous other observations appear to indicate that open CDM models are unlikely, and in particular the CMB results indicate that the universe is near to flat (e.g. de Bernardis et al., 2002), the continuing suggestion that an open CDM universe is preferred by arc statistics makes this topic worth revisiting.
4 Conclusions
We have presented a total of seven new lensing clusters from the Red-Sequence Cluster Survey. In conjunction with one system already in the literature (Gladders, Yee, & Ellingson, 2002), this sample has been analysed in the context of theoretical predictions for lensing statistics in a CDM universe. The long-standing disagreement between theory and observations, in which the actual arc numbers are severely under-predicted for this cosmology, is confirmed by these new data. The most striking property of the RCS sample is the large number (3 of 8) of multiple arc lensing clusters seen. An open CDM model is still preferred by the RCS data, since this produces more arcs, in part due to clusters with individually larger cross sections and thus a greater tendency to produce multiple arc systems.
The high frequency of multiple arc systems result implies that there exists a sub-population of clusters which are extraordinarily good lenses. The overall high redshift of the RCS lens sample suggest that the source of these “super-lenses” is likely related to the process of cluster formation, and possibly due to some combination of substructure, lens ellipticity, and projection of associated structure along the line of sight. An alternate interpretation is that these lenses are particularly dense, as is expected on theoretical grounds for clusters which form early. Regardless of cause, these results suggest that some physical effect must serve to reduce the lensing cross sections of clusters at later times, the opposite of what is expected if mass is the primary parameter controlling lensing cross sections.
Notably, these effects may have not been well captured in previous modeling efforts due to the small number of clusters simulated, and an incomplete treatment of surrounding structures. We suggest that future efforts to model lensing by clusters must include both a large number of clusters, and the complete line of sight to each in order to correctly model such effects. Consideration of multiple arcs in such models may help rehabilitate arc statistics as a cosmological tool, as it provides an independent check on the modeling. Finally, we note that the presence of a skewed distribution of lensing probabilities for clusters, implied by our data, may complicate the use of such clusters as probes of the global properties of cluster dark matter haloes. Clusters showing arcs may represent a significantly biased sample.
References
- Bahcall & Fan (1998) Bahcall, N. A., & Fan, X. 1998, ApJ, 504, 1
- Bartelmann et al. (1998) Bartelmann, M., Huss, A., Colberg, J.M., Jenkins, A., & Pearce, F.R. 1998, A&A, 330, 1
- Bartelmann, Steinmetz, & Weiss (1995) Bartelmann, M., Steinmetz, M., Weiss, A. 1995, A&A, 297, 1
- Carlberg et al. (1997) Carlberg, R.G., Morris, S., Yee, H.K.C., & Ellingson, E. 1997, ApJ, 479, L19
- Casertano et al. (2000) Casertano et al. 2000, AJ, 120,2747
- de Bernardis et al. (2002) de Bernardis et al. 2002, ApJ, 564, 559
- Kneib et al. (1996) Kneib, J.-P., Ellis, R.S., Smail, I., Couch, W.J., & Sharples, R.M. 1996, ApJ, 471, 643
- Ellingson et al. (2003) Ellingson, E. et al. 2003, in preparation
- Evrard et al. (2002) Evrard, A.E., MacFarland, T., Couchman, H.M.P., Colberg, J.M., Yoshida, N., White, S.D.M., Jenkins, A., Frenk, C.S., Pearce, F.R., Efstathiou, G., Peacock, J.A., & Thomas, P.A. 2002, ApJ, 573, 7
- Haiman, Mohr, & Holder (2001) Haiman, Z., Mohr, J.J., & Holder, G.P. 2001, ApJ, 553, 545
- Hoekstra et al. (2002) Hoekstra, H., Yee, H.K.C., Gladders, M.D., Barrientos, L.F., Hall, P.B., & Infante, L. 2002, ApJ, 572, 55
- Gioia et al. (1999) Gioia, I.M., Henry, J.P., Mullis, C.R., Ebeling, H., & Wolter, A. 1999, AJ, 117, 2608
- Gladders & Yee (2003) Gladders, M.D., & Yee, H.K.C. 2003, in preparation
- Gladders et al. (2003) Gladders, M.D., Hoekstra, H., Ellingson, E. & Yee, H.K.C. 2003, in preparation
- Gladders, Yee, & Ellingson (2002) Gladders, M.D., Yee, H.K.C., & Ellingson, E. 2002, AJ, 123, 1
- Gladders & Yee (2000) Gladders, M.D., & Yee, H.K.C. 2000, AJ, 121, 2148
- Landolt (1992) Landolt, A.U. 1992, AJ, 104, 340
- Le Fèvre et al. (1994) Le Fèvre, F., Angonin, M.C., Gioia, I.M., & Luppino,G. A. 1994, ApJ, 422, 5
- Luppino et al. (1999) Luppino, G.A., Gioia, I.M., Hammer, F., Le Fèvre, O., Annis, J.A., 1999 A&AS, 136, 117
- Meneghetti et al. (2001) Meneghetti, M., Yoshida, N., Bartelmann, M., Moscardini, L., Springel, V., Tormen, G., White, S.D.M. 2001, MNRAS, 325, 435
- Meneghetti, Bartelmann & Moscardini (2003) Meneghetti, M., Bartelmann, M., & Moscardini, L. 2003, MNRAS, 340, 105
- Navarro, Frenk, & White (1997) Navarro, J.F., Frenk, C.S., & White, S.D.M. 1997, ApJ, 490,493
- Oguri (2002) Oguri, M. 2002, ApJ, 573, 51
- Oukbir & Blanchard (1992) Oukbir, J., & Blanchard, A. 1992, A&A, 262, 21O
- Richstone, Loeb, & Turner (1992) Richstone, D., Loeb, A., & Turner, E.L. 1991, ApJ, 393, 477
- Takahashi & Chiba (2001) Takahashi, R., & Chiba, T. 2001, ApJ, 563, 489
- Williams, Navarro, & Bartelmann (1999) Williams, L.L.R., Navarro, J.F., & Bartelmann, M. 1999, ApJ, 527, 535
- Wyithe, Turner, & Spergel (2001) Wyithe, J.S.B., Turner, E.L., & Spergel, D.N. 2001, ApJ, 555, 504
- Zaritsky & Gonzalez (2002) Zaritsky, D., & Gonzalez, A.H. 2002, ApJ, in press, astro-ph/0210352