Bowen Fluorescence from the Companion Star in X1822-371
Abstract
We present a clear evidence for the motion of the companion star in the Low Mass X-Ray Binary (LMXB) X1822-371. We detect NIII 4640 emission moving in antiphase with the radial velocity curve of the neutron star and produced on the X-ray heated hemisphere of the donor star. From the motion of this feature we derive a lower limit to the radial velocity semi-amplitude of the companion star km s-1, which, combined with a previous determination of the inclination angle and the pulsar’s radial velocity curve, yield and . The HeI 4471 absorption line moves at lower velocities ( 225 km s-1) and with a -0.05 phase shift, suggests a likely origin on the gas stream near the point. In addition, we detect an S-wave emission of OVI 3811 produced by illumination of the hot-spot bulge by the central source. The Balmer lines are dominated by broad absorptions probably due to obscuration of the accretion disc by vertically extended cool material from the splash region and overflowing stream. We also derive a more accurate, and significantly different (compared to earlier work) systemic velocity of km s-1 based on the motion of the HeII 4686 wings and Doppler tomography. This work confirms the power of imaging the companion stars in LMXBs and outbursting transients using the Bowen fluorescence transitions.
1 Introduction
X1822-371 is one of the brightest Low Mass X-ray Binaries (LMXBs) in the optical but comparatively weak in X-rays (i.e. cf. it is usually 500-1000, see van Paradijs & McClintock 1995) which makes it the prototypical Accretion Disc Corona (ADC) source. In ADC sources, the combination of a high inclination and thick disc obscures the central source, and only X-rays scattered from material above and below the disc (a “corona”) can reach the observer (White & Holt 1982). The optical light curve displays regular eclipses of the accretion disc by the companion star on the 5.57 hr orbital period (see e.g. Hellier & Mason 1989). Detailed modelling of the optical and X-ray light curves has provided an accurate determination of the inclination angle (Heinz & Nowak 2001; see also Hellier & Mason 1989).
X1822-371 is also remarkable thanks to the discovery of 0.59s X-ray pulses (Jonker & van der Klis 2001, hereafter JvdK) which flags it as one of the “rare” precursors of millisecond pulsars (eight out of several hundred LMXBs). The analysis of the pulse arrival time delay has enabled an extremely precise determination of the orbit of the neutron star ( lightseconds) corresponding to a primary radial velocity semi-amplitude of 94.5 0.5 km s-1.
A complete determination of the system parameters however requires the knowledge of the radial velocity curve of the companion star. This was first intimated by Harlaftis, Charles & Horne (1997) from the motion of HeI 5876 absorption, which was interpreted as being produced on the irradiated face of the companion star, thereby providing a lower limit to the velocity semi-amplitude of km s-1. More recently, Jonker, van der Klis & Groot (2002) report km s-1 based on measurements of HeI 4026 and 5875. However, they also find a -0.08 phase shift with respect to the pulse-timing ephemeris which they attribute to asymmetric irradiation of the companion’s Roche lobe and a systemic velocity of 67 15 km s-1, significantly larger than in Harlaftis et al. (19 19 km s-1).
In this paper we present new phase-resolved intermediate resolution blue spectroscopy of X1822-371. Inspired by our work on the LMXB Sco X-1 (Steeghs & Casares 2002, herefater SC) we are pursuing the detection of the companion star via Bowen fluorescence emission due to X-ray irradiation. The combination of velocity information and light curves enable us to locate the site of the main emission/absorption lines whithin the binary.
2 Observations and Data Reduction
We observed X1822-371 using the RGO Spectrograph attached to the 3.9m Anglo-Australian Telescope (AAT) on the nights of 10-11 June 2002. A total of 38 spectra were obtained with the R1200B grating centered at 4350 Å which provided a wavelength coverage of 3500-5250, although the extreme 150 Å at each end were severely affected by vignetting and not employed in the analysis. The seeing was variable () during our run and we used a 1 arcsec slit which resulted in a resolution of 70 km s-1 (FWHM). The flux standard Feige 15 was observed with the same instrumental configuration so as to correct for the instrumental response of the detector. We also rotated the slit to include a comparison star which enabled us to monitor slit losses and obtain a relative flux calibration. In addition, we obtained five more spectra of X1822-371 with EMMI and grating on ESO’S 3.5m New Technology Telescope (NTT) at La Silla on 11 June 2002. These spectra cover the spectral range 4400-5150 at 75 km s-1 resolution. In total we covered 1.5 orbital cycles of the target on June 10 and one cycle on June 11.
The images were de-biased and flat-fielded, and the spectra subsequently extracted using conventional optimal extraction techniques in order to optimize the signal-to-noise ratio of the output (Horne 1986). CuAr comparison lamp images were obtained every 30 mins, and the -pixel scale was derived through 5th-order polynomial fits to 95 lines, resulting in an rms scatter 0.025 Å. The calibration curves were interpolated linearly in time.
3 Trailed Spectra and Radial Velocity Curves
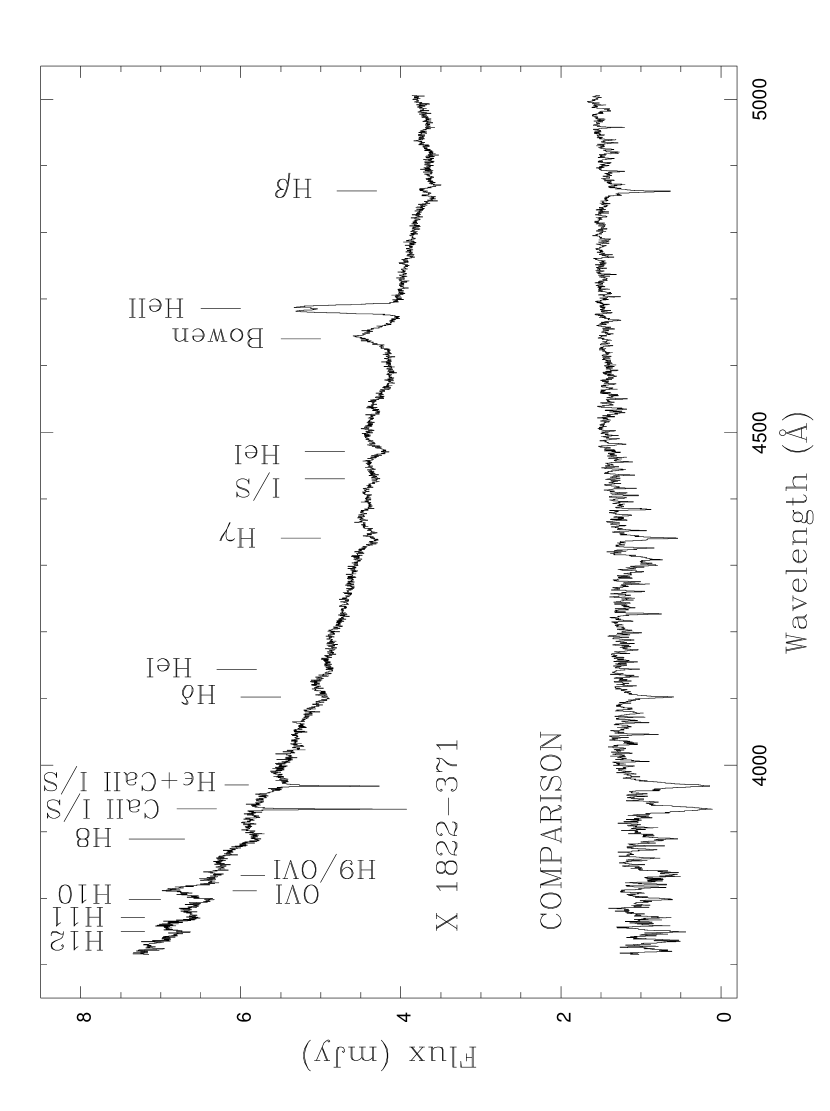
Absolute flux calibration of X1822-371 and its slit comparison was tied to the spectrophotometric standard Feige 15. Slit losses for individual spectra were computed by fitting a second-order spline to the ratio between each comparison star spectrum and its grand sum average. The X1822-371 spectra were subsequently divided by their corresponding splines in order to get the final fluxed spectra, corrected for slit losses. Figure 1 shows the average spectra of X1822-371 and its slit comparison in mJy flux units. The spectrum is dominated by high excitation emission lines of HeII 4686 and the Bowen blend. There is also evidence of a broad emission feature at 3813 which was already noted by Charles, Thorstensen & Barr (1980) in their low resolution spectra and tentatively identified with either HeII 3813 or OVI 3811 (see however Mason et al. 1982 for a different interpretation). The HeI and Balmer lines are dominated by broad absorptions, with residual emission cores observable in H and H.
Orbital phases were computed using the most accurate quadratic ephemeris published by Parmar et al (2000). However, given the large number of cycles we estimate an accumulated uncertainty of 0.03 orbits at the time of our observations and hence we decided to take the most updated from JvdK. This is defined by the superior conjunction of the X-ray pulsar and yields a final accuracy of 0.002 cycles. Binary phases are therefore computed from the ephemeris:
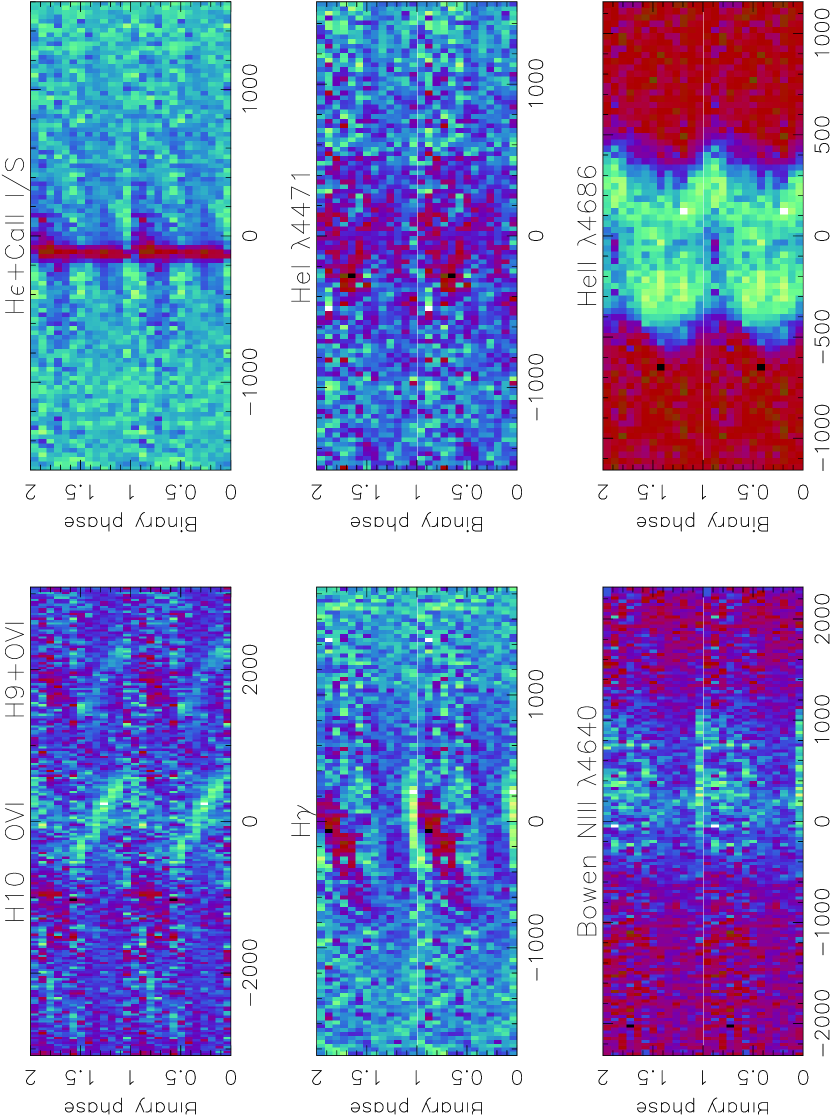
The orbital evolution of several lines is plotted in Fig. 2 in the form of trailed spectrograms. Balmer lines are dominated by deep absorptions, with velocity shifts of 800 km s-1, maximum depth between phases 0.7-1.0 and strengthening with excitation energy. Some residual emission cores are nonetheless seen in H and H at phase 0-0.1. The HeI lines are always seen in absorption with lower amplitudes ( 200 km s-1) and blue-to-red crossing velocities at phase 0 (e.g. see HeI 4471). A radial velocity curve is presented in the top panel of figure 3, obtained after cross-correlating the spectra, coadded in 13 phase bins, with a gaussian of km s-1. As noted by Harlaftis et al. (1997; see also Jonker et al. 2002), the radial velocity curve is distorted around phase 0 because of possible contamination by another component. Therefore, we mask the data points within the phase interval 0.95-0.25 and perform a sinewave fit to the remaining to derive the following parameters: km s-1, km s-1 and , where is the velocity semi-amplitude and the blue-to-red crossing. These numbers are in good agreement with Harlaftis et al. (1997) and the phase shift confirm the claim by Jonker et al. (2002) that the radial velocity curve of HeI occurs earlier than expected from the pulse-timing ephemeris.
The HeII 4686 emission exhibits a classic double-peaked disc profile with an S-wave crossing from blue to red velocities at phase 0.8. We postpone a detailed analysis of the radial velocity curve of HeII to Sect. 5. On the other hand, the 3813 line displays a single S-wave, significantly broader (FWHM km s-1) than our resolution, and blue-to-red crossing also at phase 0.8. The S-wave pattern of this feature in our trailed spectra demonstrates that it is a real line and not just a spurious feature caused by the broadened Balmer absorptions at each side (Mason et al. 1982). As noted by Charles et al. (1980), if it were HeII 3813 there is no special reason why this line should be enhanced relative to others in the Pickering series. Alternatively, it could be the blue member of the OVI doublet 3811/3834 and indeed we see another S-wave emission in our trailed spectra at 3834, although much weaker because of overlapping with the broad H9 absorption. Therefore, we identify this feature with OVI 3811.4. We have also extracted the radial velocity curve of this line by cross-correlation of our 13 phase bins of co-added spectra with a gaussian of km s-1, and the results are presented in fig. 3 (middle panel). A sinewave fit yields km s-1, km s-1 and . The phasing and large velocity amplitude suggest an origin related to the accretion disc/hot-spot region.
The Bowen blend shows a complicated pattern of narrow (FWHM km s-1) S-waves, barely detectable in our limited signal-to-noise ratio individual spectra, superposed on the broad disc emission. These narrow components are identified with the Bowen fluorescent components of NIII 4634.12/4640.64Å and CIII 4647.4/4650.1Å and have been shown to arise from the irradiated hemisphere of the donor in Sco X-1 (see SC). We have attempted to extract radial velocities of these sharp Bowen fluorescent components using a multigaussian fit, as explained in SC, but the method failed due to the weakness of these features in the individual spectra. However, in Section 6 we will show how we can exploit the powerful Doppler Tomography technique (Marsh 2001) to derive the radial velocity curve of the 4640.64 NIII line, which is found to trace the motion of the donor star. The reliability of this technique was already demonstrated in the case of Sco X-1; radial velocities derived from Doppler maps were in excellent agreement with the results from Gaussian fitting (SC).
4 Light Curves
In the top left panel of Figure 4 we show the continuum light curve, extracted from integrating the individual fluxed spectra in the wavelength range 4000-4600. Solid circles correspond to the night of 10 July and open circles to 11 July. In addition to the eclipse of the disc by the companion star, we also note a post-eclipse hump centered at orbital phase 0.25-0.3 which has been interpreted as the visibility of the irradiated inner disc rim or hot-spot hump (e.g. Mason & Córdova 1982). We note that this is when the OVI flux (top right panel) is also at a maximum, suggesting that it too is located in this region.
We have also obtained integrated light curves of the main emission/absorption lines and these are also presented in Fig. 4. The light curve of HeII 4686 shows a narrow eclipse at phase 0.2 and maximum emission around phase 0.75, suggesting that the bulk of the emission might be related to the visibility of the stream/disc impact region (i.e. equivalent to the classical hot spot in a CV). The Bowen blend exhibits a sinewave modulation peaking at phase 0.5, which suggests a likely origin on the irradiated hemisphere of the donor star. We note that the phases of maximum emission of both HeII and Bowen are the same as observed in the neutron star transient XTE J2123-058 during its outburst phase (Hynes et al. 2001).
The OVI 3811 emission line shows a similar light curve to the Bowen blend, but leading in phase by 0.15 orbits. The minimum flux occurs at phase 0.8, which also coincides with the blue-to-red crossing (see Fig. 3). The combination of the light curve and velocity information strongly suggests that OVI 3811 is associated with the irradiated inner rim of the hot-spot bulge, which is self-obscured by the outer disc rim at phase 0.8. The amplitude of the modulation is a factor of two larger than in the Bowen blend, and also the flux drops to zero at minimum, indicating that the entire line is produced at the irradiated inner bulge, with no significant contribution from other regions (e.g. axisymmetric disc or companion star). None of the emission lines exhibit a sharp eclipse feature at phase 0 and hence they must arise in a vertically extended structure, such as a disc atmosphere or corona.
The Balmer lines show intricate light curves in absorption. They exhibit two minima, at phase 0.25 and 0.8, increasing depth with excitation energy i.e. deeper for H8 than for H. The trailed spectra of H in figure 2 clearly show that the phase 0.25 dip is produced by a sharp absorption whereas the 0.8 minimum is caused by a broader feature moving redwards from phase 0.5 to 1.0. The phase 0.8 absorption is consistent with obscuration of the irradiated inner disc by a high disc rim extending from phase 0.5 to 0.9. The light curve of HeI 4471, also in absorption, appears to modulate only weakly with orbital phase, reaching maximum strength around phase 0.6.
5 The Systemic Velocity
Before discussing the location of the different emission sites we need to estimate the systemic velocity from these data. So far there is no clear determination, with only tentative values based on radial velocity curves of the HeI lines: 19 19 km s-1 (Harlaftis et al. 1997) and 67 15 km s-1 (Jonker et al. 2002). On the other hand, we notice that the strong HeII 4686 emission is blueshifted in our sum spectrum and a simple Gaussian fit yields a centroid position at -50 km s-1. The double-peaked profile indicates it comes from the accretion disc and hence it will likely provide the most reliable determination.
In an attempt to estimate both the systemic velocity and the velocity semi-amplitude of the compact object , we have applied the double-Gaussian technique to HeII 4686 (Schneider & Young 1980). We employed a two Gaussian band-pass with km s-1 and Gaussian separations km s-1 in steps of 100 km s-1. The velocity drops dramatically from 230 to 60 km s-1 as we move from the line core to the wings, whereas the systemic velocity yields consistent values in the range -30 – -60 km s-1. We find that the velocity points start to be corrupted by continuum noise for km s-1 and a sinewave fit (with the period fixed) to this velocity curve gives km s-1, and km s-1 (see bottom panel in figure 3). On the other hand, the radial velocity curve of the compact object is well determined through the pulse-timing analysis and yields km s-1 (represented by a dotted curve in fig. 3). The small difference in phasing (0.08 orbits) and velocity indicates that even the line wings are contaminated by inhomogeneities in the disc. Nevertheless, the systemic velocity appears quite stable and hereafter in this paper we will adopt km s-1 from the fit using km s-1. This is subject to systematic uncertainties, but further confirmation for a systemic velocity close to -43 will be presented in the next section. At this point we note that the radial velocity curve of OVI implies a positive systemic velocity of 43 km s-1 (see sect. 3). This is due to its formation in gas located on the irradiated inner face of the hot spot which probably has a local vertical velocity component after the gas stream collision with the disc outer edge (see fig. 5).
6 Doppler Mapping
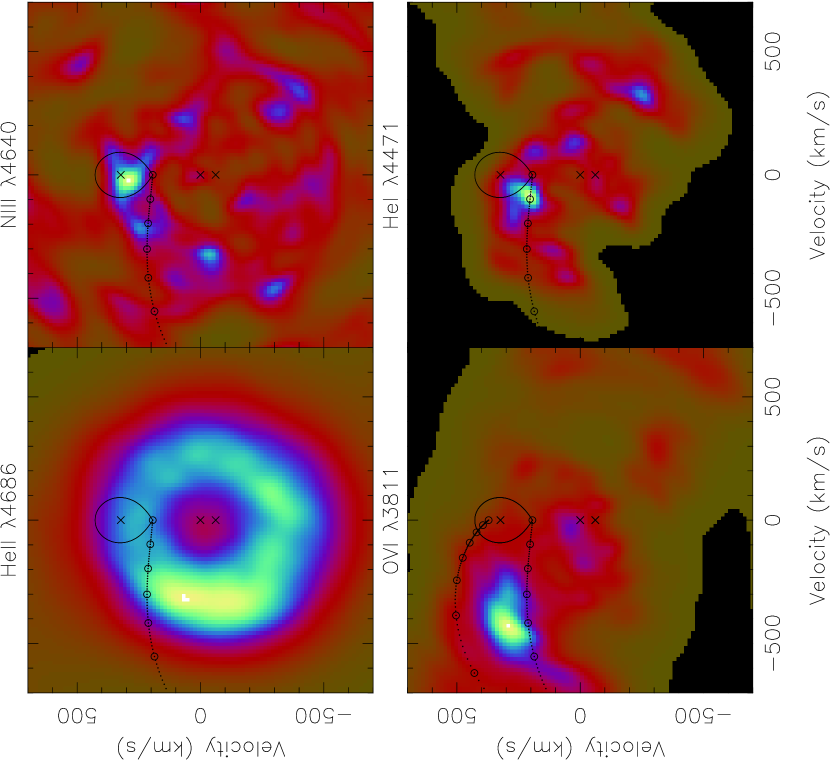
Armed with this value of , we have computed Doppler maps of the principal lines seen in our spectra and these are presented in Fig. 5. All the spectra were rectified, by subtracting a low-order spline fit to the continuum, and rebinned into a uniform velocity scale of 15 km . Doppler Tomography combines the orbitally-resolved line profiles to reconstruct the brightness distribution of the system in velocity space by maximizing the entropy of the final image (see Marsh 2001 for details). Since Doppler Tomography only deals with emission features, in order to map the absorption line HeI 4471 we first had to invert the spectra.
The emission line distribution of HeII 4686 shows the classic ring-like distribution of an accretion disc. The distribution is slightly asymmetric, with maximum emissivity over an extended arc peaking at phase 0.8. In order to help interpret the maps we have overplotted the Roche lobe of the companion star and the gas stream trajectory for a typical neutron star mass of and hence . We have also marked the center of mass and compact object’s position with crosses.
We used the HeII Doppler map to verify the adopted systemic velocity. The value of the map was calculated for a range of ’s, and the best fit in terms of mimimal was achieved for km s-1. We also searched for the optimal center of symmetry of the HeII map as a means to estimate (see SC). We found that the disc emission was subtracted optimally by assuming a of 97 5 km s-1. We did not include the region at negative velocities, since this part of the map is severely affected by the bright spot asymmetries. This value compares favorably with the radial velocity amplitude of the primary as determined from the X-ray pulsations (JvdK).
The Doppler image of OVI 3811 shows no evidence for the accretion disc but a very compact emission knot which lies between the predicted gas stream velocity and the keplerian velocity of the disc along the gas stream path. The OVI emission probably arises from irradiated turbulent gas around the hot spot which, after the shock, shares the velocity of the gas stream and the accretion disc. This is identical to the Doppler maps of HeII 4686 and HeI 4471 computed for the cataclysmic variable U Gem (Marsh et al. 1990).
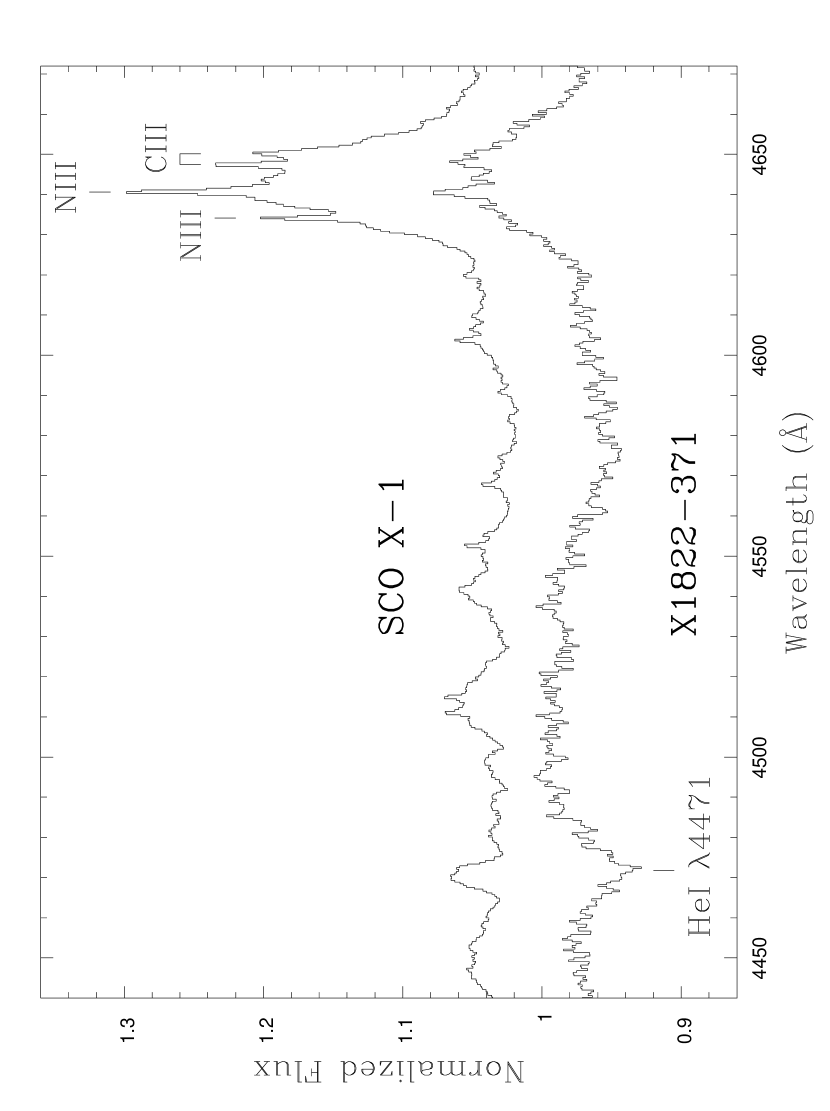
The Doppler analysis of the Bowen blend is complicated by the merging of many CIII, NIII and OII transitions (e.g. McClintock, Canizares & Tarter 1975). The most prominent component is NIII 4640.64Å for which we have also computed a tomogram. We clearly detect a sharp spot along the axis and we have inferred its centroid position at km s-1 and km s-1 through a two-dimensional gaussian fit. The spot is effectively on the axis given our phase uncertainties. The phasing and velocity amplitude proves that this emission is produced on the irradiated front side of the donor. We have experimented with computing maps for a set of -velocities in the range 0 – -80 km s-1 and we find that only values in the range -40 – -60 km s-1 provide well focused NIII spots. The remaining -velocity maps produce more extended and blurred spots which further confirm our systemic velocity determination. In Fig. 6 we compare the Bowen blend average of X1822-371 and Sco X-1 (from SC), in the rest frame of the donor stars. The prominent NIII 4640 emission and the CIII blend at 4647/50 are clearly identified in X1822-371, whereas the NIII 4634 is diluted in the much noisier spectrum of X1822-371.
Finally, we also present the tomogram of HeI 4471 absorption, which very much resembles the map of NIII 4640.64Å but the spot seems to be skewed to the leading side of the donor or on the gas stream, at 0.1 from the point. A two-dimensional gaussian fit to the bright spot yields a centroid position at km s-1 and km s-1 which places it exactly over the gas stream trajectory.
7 Discussion
We have succesfully detected the companion star in X1822-371 through Doppler imaging of the fluorescent NIII 4640 emission. The emission is exactly in antiphase with the radial velocity curve of the pulsar and hence no asymmetric irradiation of the companion’s Roche lobe needs to be invoked. On the other hand, the distribution of HeI 4471 absorption is concentrated near the point but leading in phase. We find a phase shift of -0.05 with respect to the position of the NIII 4640 spot and the pulse-timing ephemeris which places the HeI absorber on the leading side of the companion’s Roche lobe or, more likely, over the gas stream. This solves the problem raised by Jonker et al. (2002) who, following Harlaftis et al. (1997), assumed that the HeI absorption arises on the irradiated hemisphere of the companion.
The Doppler map of NIII 4640 yields a bright spot at km s-1. Since this spot is produced on the inner hemisphere of the companion star through irradiation, it gives a lower limit to , the velocity semi-amplitude of the companion’s center of mass. The lower limit to can then be combined with the very accurate determination of the inclination () and the radial velocity curve of the pulsar to derive robust lower limits to the masses of the neutron star and companion of and , respectively.
An upper limit to can be obtained by using the K-correction equation (Wade & Horne 1988):
where is the velocity semi-amplitude of the irradiated-induced emission, and is the displacement of the reprocessing site from the center of mass of the star in units of the companion’s star radius . Furthermore we assume that the NIII line (with km s-1) is produced at the point i.e. . The equation then yields km s-1, where we have used and km s-1. This upper limit would imply which coincides with the maximum neutron star mass possible with the stiffest equation of state of condensed matter. In addition, since must be between 300–437 km s-1 and we know , this translates to firm limits to the mass ratio of .
For the case of a canonical neutron star mass of 1.4 we would expect km s-1 and . This would imply a K-correction for NIII of which is comensurate with the value seen for the cataclysmic variable HU Aqr which has a similar mass ratio (Schwope, Mantel & Horne 1997). On the other hand, JvdK have shown that the neutron star in X1822-371 is undergoing an accretion spin-up phase and therefore we might expect to find . Tighter constraints on the system parameters may have important implications for our knowledge of the equation of state of nuclear matter (e.g. Cook, Shapiro & Teukolsky 1994).
The combination of light curves and velocity information from trailed spectra/Doppler maps has enabled us to locate the different regions responsible for the main spectral lines in the binary. The Balmer lines (from H to the Balmer break) are embedded in deep absorptions whose phasing and large velocity shifts suggest they are produced in vertically extended cool gas associated with the hot-spot/post-shock region. Simulations of stream-disc interaction with inefficient cooling (Armitage & Livio 1998) produce a “halo” of material above the disc and a bulge along the disc rim which can obscure the bright inner disc. This behaviour is mainly observed in SW Sex stars (e.g. Groot, Rutten & van Paradijs 2001, Rodríguez-Gil, Martínez-Pais & Casares 1999) where (possible) magnetic white dwarfs are fed by disc overflowing material. SW Sex behaviour has also been recognized in the neutron star transient XTE J2123-058 during outburst (Hynes et al. 2001). A key ingredient of this behaviour seems to depend on large accretion rates, although an inclination selection effect may be needed to account for the lack of orbitally modulated absorptions in other persistent LMXBs (e.g. Sco X-1). The OVI 3811 emission arises from the post-shock region between the gas stream and the disc but it has maximum flux at phase 0.25, rather than 0.8. Therefore, it must be triggered by irradiation of the inner hot-spot bulge region i.e. further evidence for a vertical thickening of the disc at the splash point position.
After our work on Sco X-1 (SC) and GX339-4 (Hynes et al. 2002) this paper further establishes the importance of the fluorescent Bowen as excellent tracer of the companion’s motion in active LMXBs and Soft X-ray Transients in outburst. This new technique opens a new window on the detection of the, otherwise, radiatively overwhelmed companion stars and thereby allows follow-up dynamical studies of X-ray binaries.
References
- Armitage & Livio (1998) Armitage P.J., Livio, M. 1998, ApJ, 493, 898
- Charles et al. (1980) Charles P., Thorstensen J.R., Barr P. 1980, ApJ, 241, 1148
- Cook et al. (1994) Cook G.B., Shapiro S.L., Teukolsky S.A. 1994, ApJ, 424, 823
- Groot et al. (2001) Groot P.J., Rutten R.G.M., van Paradijs J. 2001, å, 368, 183
- Harlaftis et al. (1997) Harlaftis E.T., Charles P.A., Horne K. 1997, MNRAS, 285, 673
- Heinz & Novak (2001) Heinz S, Nowak M.A. 2001, MNRAS, 320, 249
- Hellier & Mason (1989) Hellier C., Mason K.O. 1989, MNRAS, 239, 715
- Horne (1986) Horne K. 1986, PASP, 98, 609
- Hynes et al. (2001) Hynes R. I., Charles P. A., Haswell C. A., Casares, J., Zurita, C., Serra-Ricart M. 2001, MNRAS, 324, 180
- Hynes et al. (2003) Hynes R.I., Steeghs D., Casares J., P.A. Charles, O’Brien K. 2003, ApJLetters, in press, astro-ph/0301127
- Jonker & van der Klis (2001) Jonker P.G., van der Klis M. 2001, ApJ, 553, L43
- Jonker et al. (2002) Jonker P.G., van der Klis M., Groot P.J. 2002, ApJ, astro-ph/0210506
- Marsh (2001) Marsh T.R. 2001, in Astrotomography, Indirect Imaging Methods in Observational Astronomy, eds. H.M.J. Boffin, D. Steeghs and J. Cuypers (Lecture Notes in Physics) vol. 573, p.1
- Marsh et al. (1990) Marsh T.R., Horne K., Schlegel E.M., Honeycutt R.K., Kaitchuck R.H. 1990, ApJ, 364, 637
- Mason & Córdova (1982) Mason K. O., Córdova F.A. 1982, ApJ, 262, 253
- Mason et al. (1982) Mason K. O., Murdin P.G., Tuohy I.R., Seitzer P., Branduardi-Raymont G. 1982, MNRAS, 200, 793
- McClintock et al. (1975) McClintock J.E., Canizares C.R., Tarter C.B. 1975, ApJ, 198, 641
- Parmar et al. (2000) Parmar A.N. et al. 2000, å, 356, 175
- Rodríguez-Gil et al. (1999) Rodríguez-Gil P., Casares J., Martínez-Pais I.G. 1999, MNRAS, 305, 661
- Schwope et al. (1997) Schwope A. D., Mantel, K.-H., Horne K. 1997, å, 319, 894
- Steeghs & Casares (2002) Steeghs D., Casares J. 2002, ApJ, 568, 273
- Schneider & Young (1980) Schneider D.P., Young P. 1980, ApJ, 238, 946
- (23) van Paradijs J., McClintock J.E. 1995, in X-Ray Binaries, eds. W.H.G. Lewin, J. van Paradijs and E.P.J. van den Heuvel (CUP 26, Cambridge), p58
- Wade & Horne (1988) Wade R.A., Horne, K. 1988, ApJ, 324, 411
- (25) White N.A., Holt S.S. 1982, ApJ, 257, 318


| Date | Telescope | Exposure Time | Wav. Range | Dispersion |
|---|---|---|---|---|
| (seconds) | Å | Å ) | ||
| 10 Jun 02 | AAT | 24x900 | 3650-5100 | 0.45 |
| 11 Jun 02 | ,, | 14x900 | ,, | ,, |
| ,, | NTT | 1x1200 | 4400-5150 | 0.40 |
| ,, | ,, | 4x600 | ,, | ,, |