An HST/WFPC2 Snapshot Survey of 2MASS-Selected Red QSOs
Abstract
Using simple infrared color selection, the Two Micron All Sky Survey (2MASS) has found a large number of red, previously unidentified, radio-quiet quasi-stellar objects (QSOs). Although missed by UV/optical surveys, the 2MASS QSOs have -band luminosities that are comparable to “classical” QSOs. This suggests the possible discovery of a previously predicted large population of dust-obscured radio-quiet QSOs. We present the results of an imaging survey of 29 2MASS QSOs observed with the Wide-Field Planetary Camera 2 onboard the Hubble Space Telescope. -band images, which benefit from the relative faintness of the nuclei at optical wavelengths, are used to characterize the host galaxies, measure the nuclear contribution to the total observed -band emission, and to survey the surrounding environments. The 2MASS QSOs are found to lie in galaxies with a variety of morphologies, luminosities, and dynamical states, not unlike those hosting radio-quiet PG QSOs. Our analysis suggests that the extraordinary red colors of the 2MASS QSOs are caused by extinction of an otherwise typical QSO spectrum due to dust near the nucleus.
To appear in The Astrophysical Journal
1 Introduction
Mostly immune from absorption processes and obscuration by dust, radio surveys are ideal for identifying complete samples of quasi-stellar objects (QSOs). However, only 10% of QSOs are “radio-loud”111Radio-loud QSOs are distinguished by their radio to optical flux ratio, . This cut-off value, as well as the wavelengths used, vary throughout the literature., necessitating the use of other more vulnerable wavelengths. Optical surveys designed to find UV-excess objects have long prevailed. Despite their success, searches in the optical are fated to miss QSOs that might be reddened by dust.
Webster et al. (1995) studied a large sample of radio-selected quasars and found an enormous amount of scatter in their colors (). This was interpreted as the result of varying amounts of dust within the quasar host galaxy. Optically-selected QSOs showed a much smaller color range, presumably because the redder objects were not detected. If the dust content around radio-loud and radio-quiet QSOs does not differ significantly, their results suggested that approximately 80% of radio-quiet QSOs are missed by optical surveys.
The prediction of a large, predominantly undetected population of red QSOs is consistent with theoretical explanations for the hard x-ray background (Comastri et al., 1995). However, some have claimed that the large spread in colors seen by Webster et al. (1995) is not due entirely to dust obscuration (Boyle & di Matteo, 1995; Benn et al., 1998). In that case, any missing population of QSOs would be much smaller, if even significant.
The discovery of highly reddened and buried QSOs in the Infrared Astronomical Satellite (IRAS) database (e.g., Beichman et al., 1986; Low et al., 1988; Cutri et al., 1994; Hines et al., 1995, 1999a, 1999b) confirmed that at least some radio-quiet QSOs are indeed obscured along our line of sight by dust. While IRAS was only able to detect the mid and far-infrared emission of extremely reddened QSOs, it was quickly recognized that a wide area, near-infrared survey could potentially uncover large numbers of previously unknown QSOs due to less extinction at 2 than in the optical.
With this key feature in mind, Cutri et al. (2001) are compiling a catalog of active galactic nuclei (AGN) derived from the Two Micron All-Sky Survey (2MASS: Skrutskie et al., 1997) Point Source Catalog. Even with a relatively small fraction of the sky analysed so far, spectroscopic followup has confirmed over 400 previously unidentified emission-line AGN with QSO-like luminosities ( and : Cutri et al., 2001, 2002).
The nature of these red 2MASS QSOs is an open question. The -band and [O III]5007 luminosities of many of the newly found objects fall in the same ranges as for UV/optically-selected QSOs (Smith et al., 2003). However, nearly all have much redder colors () compared with traditional QSOs (e.g., PG QSOs: Schmidt & Green, 1983), implying that many of the 2MASS objects are obscured from our direct view by dust. Smith et al. (2002) find that at least 10% of the 2MASS QSOs are “highly-polarized” (); a significantly higher fraction than both the PG (Berriman et al., 1990) and broad absorption line QSOs (Schmidt & Hines, 1999). Indeed, only the IRAS-selected hyperluminous infrared galaxies (HIGs) show higher polarization. In addition, several of the highly polarized 2MASS QSOs exhibit broad polarized emission lines even though they are dominated by narrow emission lines in total flux (Schmidt et al., 2002; Smith et al., 2003). This is very reminiscent of the simple orientation-dependent unified schemes for Seyfert galaxies (Antonucci, 1993; Tran, 1995) and HIGs (Hines & Wills, 1993; Hines et al., 1995, 1999a, 1999b; Goodrich et al., 1996; Tran, 2001). In these schemes, a dusty torus obscures our direct view but light from the nucleus escapes through the open poles to be scattered (thus polarized) into our line of sight; type 2 objects appear different from type 1 simply because their tori are more highly inclined.
However, there is still an ambiguity between simple orientation schemes and those that involve significant dust cover from debris left by strong galaxy-galaxy interactions. It has been suggested that ultraluminous infrared galaxies (ULIRGs), IRAS-selected systems with the bulk of their energies emerging in the far-infrared and with bolometric luminosities of L⊙, can evolve into classical QSOs once the gas and dust around their nuclei are either consumed as fuel by a powerful starburst or a nascent AGN, or blown away in powerful winds (Sanders et al., 1988; Heckman, Armus & Miley, 1990). In this scenario, some or all of the 2MASS QSOs might be aging ULIRGs, complete with post-starburst stellar populations, fading tidal remnants, disturbed morphologies, and perhaps closely spaced multiple nuclei.
The 2MASS-selected QSOs might therefore be (1) relatively normal QSOs seen from near the plane of an obscuring torus, (2) fairly young, evolving post-ULIRG systems wherein most of the molecular gas and dust has been removed from the circumnuclear environment, but that still retain enough material to make them “invisible” to classical UV or visual searches for AGN, or (3) an entirely new aspect of the overall phenomenon of nuclear activity. As part of a multi-wavelength investigation of the 2MASS AGN, we have performed a snapshot imaging survey with the Wide-Field Planetary Camera 2 (WFPC2) aboard the Hubble Space Telescope (HST) to investigate these possibilities. The images have enabled us to characterize the host galaxies, estimate the relative contributions to the emitted optical flux from the host galaxy and the active nucleus, and survey the immediate environments of these objects.
2 Data
2.1 The 2MASS QSO Sample
Candidate AGN were selected from 2MASS according to color (), galactic latitude (), and detection (complete to ) in each of the three 2MASS bands, (Cutri et al., 2001, 2002). These criteria efficiently filter almost all known AGN and all but the coolest stars (Beichman et al., 1998). Approximately 80% of these candidates were confirmed as AGN via follow-up optical spectroscopy that also determined their redshifts and spectral type. Of these AGN, most have absolute magnitudes that easily fall within the luminosity range of UV/optically-selected QSOs (Figure LABEL:fig_pg). A representative subset (90) of this red, radio-quiet QSO () catalogue was surveyed for optical broad-band polarization (Smith et al., 2002). Twenty-nine of these objects comprise the sample addressed by this paper. They range in redshift from to with a median value of 0.213. The sample members and their previously determined properties are provided in Table LABEL:tbl_sample. For brevity, the designation of objects from the 2MASS Incremental Release Point Source Catalog has been shortened to 2Mhhmmssddmm in the text.
2.2 Observations
A WFPC2 snapshot survey was conducted between the UT dates of 2 July 2001 and 14 October 2001 during Cycle 10 of the HST observing schedule. Twenty-eight of fifty-four potential targets were observed during that period. A final twenty-ninth object (2M010607+2603) was added on 10 June 2002. The QSOs were centered on the planetary camera (PC) and observed with a single filter, F814W. Each observation consisted of two 400 second integrations in CR-SPLIT mode to allow for the removal of cosmic rays. In order to maximize integration time, no dithering was attempted. The survey was designed to balance the scientific requirements of the project with the simplicity needed for successful snapshot scheduling. WFPC2 was selected to facilitate comparisons with previous studies, and the PC, with 0.046 pixels and a 36.8 field of view, was chosen over the wide field cameras in order to better sample the point spread function (PSF). As a result, the light contribution of AGN can be subtracted more precisely, but at the expense of sensitivity to extremely low surface brightness features. The F814W filter, which corresponds closely to the Cousins -band (hereafter referred to simply as I), has the dual advantage of being sensitive to red light from older stellar populations, while still benefitting from the relative faintness of the nuclei at optical wavelengths.
f1.eps
Table LABEL:tbl_sample
Sample of 29 2MASS-selected red QSOs
Object
RA
Dec
aaRedshifts from Cutri et al. (2001).
bbNear-infrared apparent magnitudes and colors from the 2MASS Point Source Catalog.
bbNear-infrared apparent magnitudes and colors from the 2MASS Point Source Catalog.
bbNear-infrared apparent magnitudes and colors from the 2MASS Point Source Catalog.
ccCalculated (Eq. 1) from Column 5 values ( km s-1 Mpc-1 and ).
TypeddSpectral classifications from Cutri et al. (2001) and Smith et al. (2003).
(2MASSI J)
(J2000)
(J2000)
000810.8+135452
00 08 12.26
13 55 14.68
0.185
14.4
2.1
0.8
-25.2
2
005055.7+293328
00 50 57.15
29 33 51.82
0.136
13.2
2.1
1.0
-25.6
2
010607.7+260334
01 06 09.89
26 03 43.07
0.411
14.6
2.7
1.2
-27.3
1.2
015721.0+171248
01 57 22.66
17 13 08.17
0.213
13.2
2.7
1.3
-27.0
1.x
022150.6+132741
02 21 52.64
13 27 46.94
0.140
13.2
2.4
1.1
-25.7
1.8
023430.6+243835
02 34 32.33
24 38 55.20
0.310
13.7
2.2
1.1
-27.2
1.5
032458.2+174849
03 25 00.27
17 48 59.48
0.328
12.8
2.4
1.0
-28.3
1
034857.6+125547
03 48 59.61
12 55 56.82
0.210
13.6
3.3
1.5
-26.7
1.x
092049.0+190320
09 20 51.16
19 03 12.47
0.156
14.9
2.1
1.2
-24.3
1.b
125807.4+232921
12 58 05.30
23 29 27.66
0.259
13.4
2.1
0.9
-26.9
1
130700.6+233805
13 06 58.46
23 38 02.45
0.275
13.4
3.3
1.6
-27.6
1.b
145331.5+135358
14 53 29.47
13 53 52.13
0.139
13.1
2.2
1.0
-25.9
1.x
151621.1+225944
15 16 19.13
22 59 31.25
0.190
14.1
2.1
1.0
-25.5
1.b
152151.0+225120
15 21 49.08
22 51 07.62
0.287
14.3
2.3
0.9
-26.5
1.x
154307.7+193751
15 43 05.68
19 37 44.90
0.228
12.7
2.3
1.1
-27.4
1.5
163700.2+222114
16 36 58.71
22 21 36.03
0.211
13.6
2.1
1.1
-26.3
1.5
163736.5+254302
16 37 34.36
25 42 54.13
0.277
14.2
2.3
1.2
-26.5
1.9
165939.7+183436
16 59 37.68
18 34 30.53
0.170
12.9
2.2
0.9
-26.5
1.5
170003.0+211823
17 00 01.09
21 18 37.62
0.596
14.9
2.5
1.4
-28.0
1.5
171442.7+260248
17 14 40.52
26 02 49.5
0.163
13.1
2.2
1.1
-26.3
1
171559.7+280717
17 15 58.64
28 07 43.72
0.524
14.6
2.5
1.3
-27.9
1.8
222202.2+195231
22 22 03.14
19 52 58.93
0.366
13.3
2.9
1.3
-28.4
1.5
222221.1+195947
22 22 20.86
20 00 17.54
0.211
12.9
2.1
0.9
-27.0
1.5
222554.2+195837
22 25 55.00
19 59 05.57
0.147
13.5
2.1
1.0
-25.6
2
225902.5+124646
22 59 03.97
12 47 09.33
0.199
14.1
1.9eeFollowing recent observations, this object no longer meets the J-K selection criterion. It has been included in the analysis of the sample.
0.9
-25.6
1.x
230304.3+162440
23 03 05.71
16 25 03.07
0.289
14.7
2.3
1.4
-26.1
2/S
230442.4+270616
23 04 43.80
27 06 40.73
0.237
14.8
2.1
1.3
-25.4
1.5
232745.6+162434
23 27 46.26
16 25 02.68
0.364
14.5
2.4
1.1
-27.0
?
234449.5+122143
23 44 51.18
12 22 02.48
0.199
12.9
2.1
0.9
-26.8
1
2.3 Data Reduction
The WFPC2 images were calibrated using the STSDAS routine calwp2 that is incorporated into the STScI data reduction pipeline and makes use of the best reference files available. Subsequently, a flat-field correction was applied as described in the WFPC2 Instrument Science Report 2001-07 (Karkoshka & Biretta, 2001). The two images for each object were combined and cosmic rays were removed using the IDL routine cr_reject that is nearly identical to crrej in IRAF and is available in the IDL Astronomy User’s Library. No compensation was made for charge transfer efficiency (CTE) problems known to affect WFPC2, resulting in an underestimation of the illumination in the center of the chip at the few percent level (Whitmore & Heyer, 1997; Biretta et al., 2002). The dominant source of error in the magnitudes we derive is not the CTE compensation, but uncertainty in the PSF-subtraction. Sky subtraction was carried out using custom IDL software.
2.4 PSF-Subtraction
Factors affecting the PSF include the filter response, scattering due to surface irregularities in the optics such as dust, the shape of an object’s spectral energy distribution (SED), and especially slight changes in the position of the secondary mirror, or “breathing”. While all of these may vary slightly between observations, their combined effect is minimized by creating a PSF directly from observed point sources. Using the sample QSOs themselves for this purpose is preferable to field stars for two reasons. The PSF is somewhat dependant on a source’s position on the chip, and a star’s color significantly affects whether or not it is suitable for modeling a QSO PSF (Bahcall et al., 1997). As this observing program was designed to be a single filter snaphot survey, colors were not available and valuable orbits were not dedicated to observing stars centrally located on the chip.
In order to identify the most “point source like” QSOs in our sample, an artificial PSF created by the software package Tiny TIM (Krist & Hook, 2001) was scaled and subtracted from each image where a host galaxy was not readily apparent. Direct comparison of the resulting profiles revealed extended emission around six of the nine candidates. Two of the remaining three were not optimal for the purpose of constructing a PSF. 2M170003+2118 was relatively faint requiring that it and its inherent noise be scaled significantly to combine it with brighter objects. A saturated star in the field of 2M023430+2438 was a source of contamination that could not be removed reliably. Therefore, our PSF was created solely from 2M222202+1952.
The light contribution of the AGN can be bounded by considering two extreme cases. The upper limit to the AGN emission corresponds to the PSF amplitude which results in the subtraction residuals summing to zero within a specified aperture (defined here as the full width at half maximum (FWHM) of the PSF). With the constraint that the PSF amplitude must be sufficiently large to eliminate the presence of diffraction spikes and an Airy pattern, the lower limit corresponds to the removal of the central peak without introducing any negative residuals.
Between these bounds, the PSF amplitude which minimizes the variance of the residuals can be considered the best determination of the light contribution of the AGN. This approach yields generous errors. Finally, for the purpose of estimating a flux uncertainty due to PSF-subtraction, the smaller of the differences between the accepted value and the upper and lower limits was adopted.
2.5 QDOT ULIRGs
Before presenting the results from the analysis of the 2MASS QSOs, we briefly describe a second sample of objects investigated in this paper. For reasons outlined in §1 we wished to compare properties of the 2MASS QSOs to a sample of ULIRGs. Identification of companion objects surrounding the latter are not currently available in the literature, requiring us to perform our own analysis of HST archival data. A substantial number of ULIRGs have been observed with WFPC2/F814W (Borne, Bushouse, Lucas, & Colina, 2000) and are publicly available in the archive. These images were taken in exactly the same manner as the 2MASS QSO sample, with the exception of being centered on WF3 instead of the PC. Cross-listing those objects with the QDOT222QDOT is a redshift survey of 2,387 IRAS galaxies brighter than the IRAS PSC completeness limit (Lawrence et al., 1999, and references therein). In the context of this paper, it is only used as means for constructing a ULIRG sample with uniform selection criteria. ULIRG sample and imposing the same sky position restriction used to select the 2MASS QSOs () results in a homogeneous sample of 30 high-latitude ULIRGs. These objects and their redshifts are presented in §3.5. Precisely the same steps described in §2.3 were applied to these observations.
3 Results
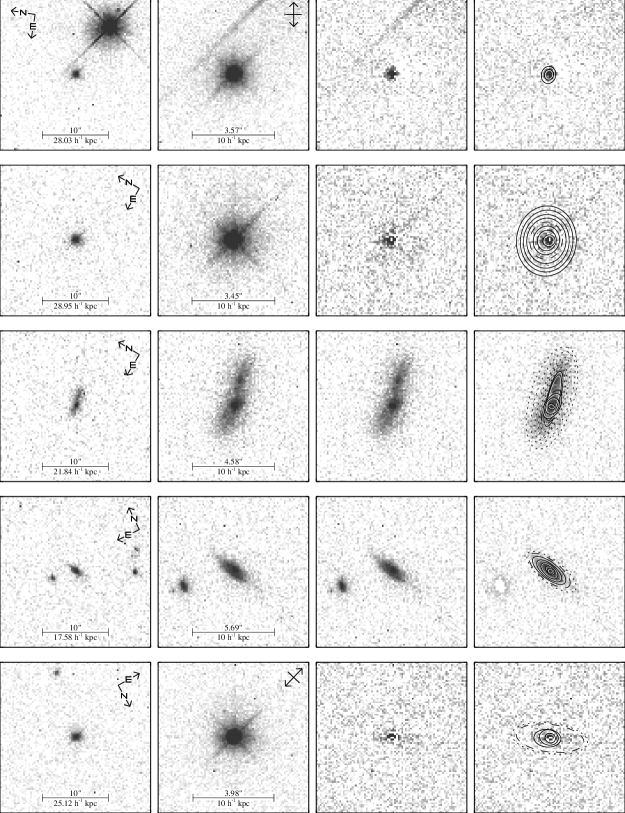
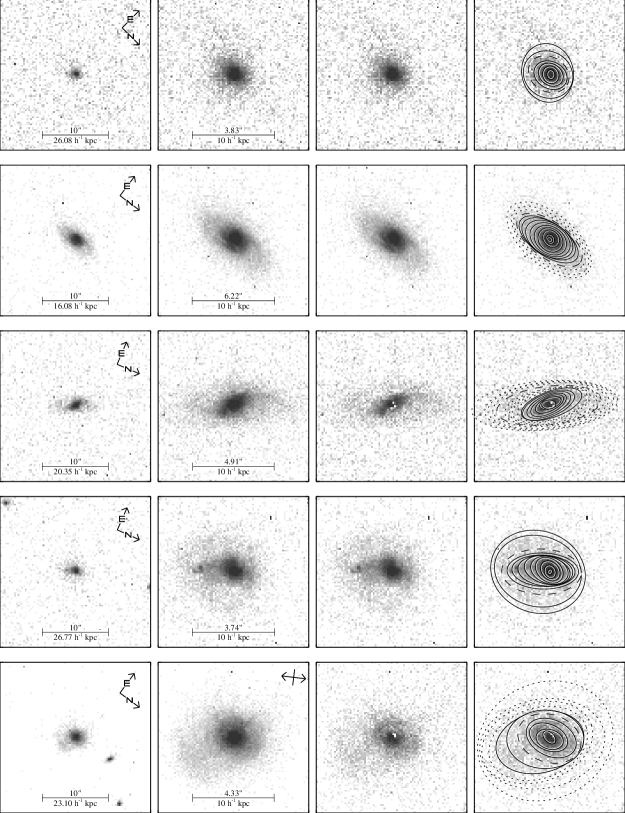
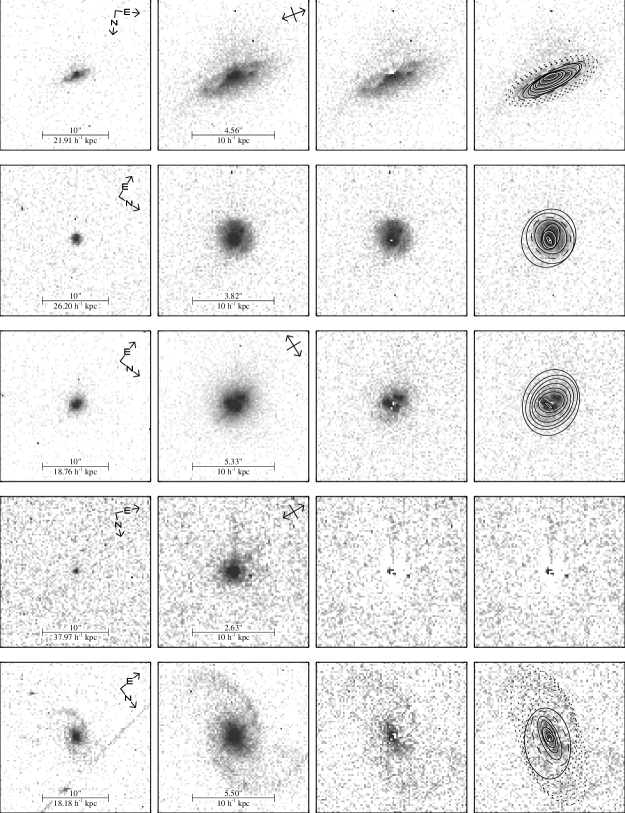
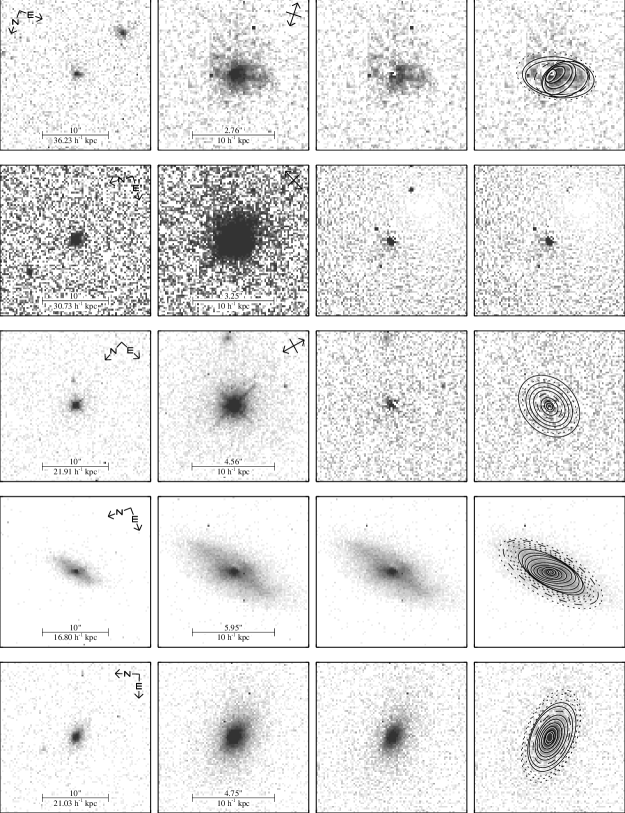
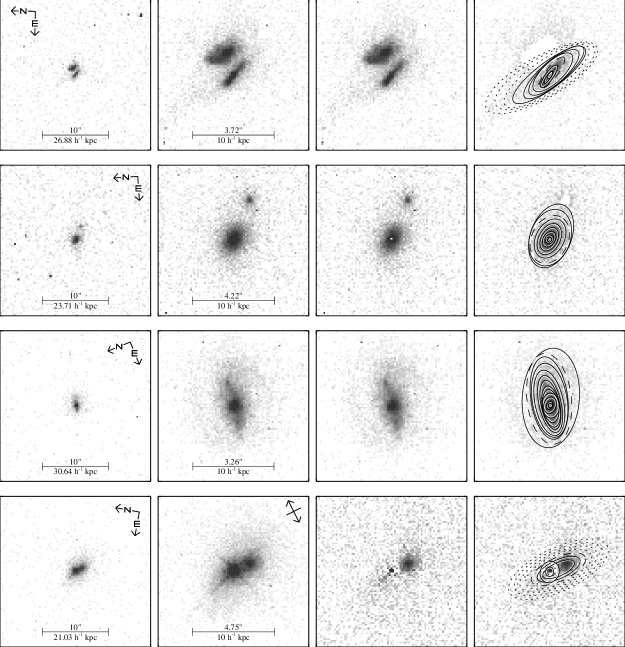
Images of all 29 2MASS QSOs prior to and following PSF-subtraction are shown in Figure LABEL:fig_hosts1. The entire sample is displayed at the same angular and physical scales in the first and second columns, respectively. The second and third columns show the objects before and after subtraction of the light contribution from the AGN. In some cases this difference is dramatic; in others there is very little visual change. The position angle of polarization (taken from Smith et al. (2002, 2003)) for those objects with measured is denoted by the double-headed arrow in the upper righthand corner in column two. Isophotes of the residual images (and the masks used in calculating them) are shown in the last column. In some cases, the isophotes more clearly reveal underlying structure, highlighting features such as multiple nuclei and isophotal twisting caused by interaction or the presence of spiral arms. The solid contours indicate flux levels that are distinguishable from image noise at the confidence level, as opposed to the dotted contours. The dashed line identifies the isophote used to determine the eccentricity and position angle of the host galaxy. Measured properties of the host galaxies are listed in Table LABEL:tbl_properties and are discussed below. Additional notes on individual objects can be found in Appendix A.
3.1 Luminosities
The PSF-subtraction revealed the relative flux contributions of the AGN and host galaxies within radius apertures333Foreign sources such as stars, background galaxies and companions were masked.. Absolute magnitudes were then calculated using the standard formula (Peebles, 1993)
| (1) |
and the prescription found in the WFPC2 Instrument Handbook (Biretta et al., 2002)
| (2) |
where , is the redshift-dependant K-correction, is the number of counts in the F814W filter, and is the exposure time. Throughout this paper, values for the cosmological constants and are taken to be 0.5 and 75 km s-1 Mpc-1, respectively. Although transformation between the HST system and standard magnitudes generally depends strongly on the shape of an object’s spectrum, the effect is minimal for the F814W filter (0.05 magnitudes). Equation 2 yields results nearly identical to those obtained by Holtzman et al. (1995).
K-corrections for the host galaxies, ranging between and magnitudes, were measured from spiral and elliptical SED templates. For those hosts with ambiguous morphologies, an average of the two templates was used. For the AGN, K-corrections were taken from the Sloan Digital Sky Survey (SDSS) composite QSO spectrum (Vanden Berk et al., 2001). Of course, the 2MASS QSOs are much redder than UV/optically selected QSOs and their physical nature has yet to be adequately determined. Extrapolating their SED from a “typical” QSO spectrum in order to calculate K-corrections is not necessarily correct. Fortunately, for the redshift range of this sample, these corrections are relatively small ().
Absolute magnitudes for the host galaxies and AGN are given in Table LABEL:tbl_properties. For the latter, both absolute rest frame -band and apparent (without K-corrections) F814W values are listed. In this cosmology, an L* galaxy has an -band absolute magnitude of (Norberg et al., 2002; Blanton et al., 2003). The 2MASS hosts range between LL* and LL* with three quarters of them being brighter than L*. The range in luminosity of the nuclei extends over 7 magnitudes, with only ten of the 29 objects satisfying the traditional criterion444Extrapolating to -band yields . for QSO classification (Schmidt & Green, 1983). Section 5 presents evidence that AGN luminosity is correlated with the color index, suggestive of a reddening effect.
3.2 Surface Brightness Profiles
Isophotes were fit to the host galaxy images after the point source was subtracted and nearby stars/galaxies were masked. The methodology used is described by Buote & Canizares (1994) and references therein. Surface brightness profiles were then constructed using these isophotes. The average magnitude per square arc second was calculated as a function of radius along the semi-major axis for the regions between successive elliptical annuli. Figure LABEL:fig_profiles1 shows surface brightness profiles for each object, plotted against as well as . Linear profiles on the left reflect an exponentially decreasing surface brightness (a disk). On the right, linear profiles indicate a de Vaucouleurs law that is characteristic of spiral bulges and elliptical galaxies.
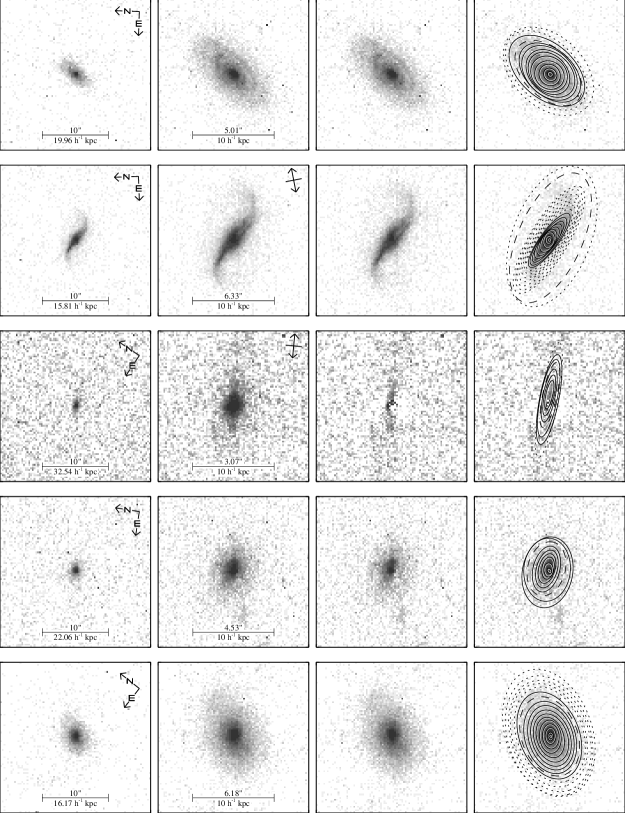
.


The profiles of the three objects with no obviously discernible host galaxies were noise-limited and are not included. Additionally, it should be noted that the profile shown for the last object, 2M234449+1221, may be misleading. The inner points are dominated by the immediate region surrounding the QSO, while at larger distances the surface brightness reflects the other feature clearly seen in Figure LABEL:fig_hosts1. Whether this is a double nucleus within the same host galaxy or a separate companion is unclear. By chance this results in a fairly smooth surface brightness profile.
3.3 Morphologies
In three cases, a host galaxy could not be visually distinguished from either the image noise or the PSF-subtraction residuals. Considering the survey’s short exposure times, the PC’s relative insensitivity to low surface brightness features, and the comparatively high redshifts (, 0.366 and 0.596) of these objects, it is reasonable to assume that host galaxies are present but very faint555The 800 second observations reached a limiting magnitude of approximately .. In fact, luminosities from the residual flux are consistent with the other host galaxies’ absolute magnitudes. For the remainder of the sample, morphologies were assigned by visual inspection of both the PSF-subtracted images and the surface brightness profiles. In many cases, classifying the type of host galaxy is an extremely uncertain exercise. Table LABEL:tbl_properties lists only fairly unambiguous morphologies, leaving nearly half the sample unclassified. Of the 26 QSOs with visible hosts, nine reside in disk (spiral) galaxies and four are found in what are well described as ellipticals.
The hosts classifed as spirals preferentially lie at low redshifts (Figure LABEL:fig_z). A Kolmogorov-Smirnov (KS) test yields only a probability that the redshifts of the spirals and remaining galaxies are drawn from the same parent population. This suggests that some, or all, of the unclassified host galaxies may have spiral disks that are less obvious due to their smaller angular extent and the shallow exposures of the shapshot survey. This is a testable hypothesis, at least in a coarse sense. Figure LABEL:fig_ecca shows the normalized distributions of axial ratios for 12,045 spiral and 1,022 elliptical galaxies in the Third Reference Catalog of Bright Galaxies (RC3: de Vaucouleurs et al., 1995). The axial ratios of the unclassified 2MASS QSO hosts are shown in Figure LABEL:fig_eccb. There is a and probability that the unclassified host axial ratios are drawn from the distributions of the RC3 elliptical and spiral galaxies, respectively, as indicated by KS tests. Both of these results are inconclusive, except to say that it is more likely that the unclassified hosts are all spirals than that they are all ellipticals. Their nature can be investigated more generally with a Monte Carlo approach. A total of spiral axial ratios and elliptical axial ratios were selected at random using the RC3 distributions as parent populations. These 16 values were then binned to the same degree as Figure LABEL:fig_ecc. Repeating this exercise 10,000 times resulted in an average distribution for spiral galaxies as well as a Gaussian error for each bin. Computing indicated how well the unclassified 2MASS QSO hosts can be described as a sample of spiral galaxies and remaining ellipticals. This test was not very sensitive to the precise choice of N, but it showed that the unclassified hosts can be characterized equally well as being purely spiral galaxies or evenly divided between the two morphologies.
The preceding analysis begs the question of whether or not the 2MASS QSOs are exclusively found in spiral galaxies. For this to be the case, the four hosts classified as ellipticals would in fact have to be bulge-dominated spiral galaxies for which the disk was simply missed. However, two of these lie at fairly low redshifts ( and ) where disks would likely be detected if present. Also, two-thirds of the 2MASS QSOs with unclassified hosts also exhibit evidence of interaction including tidal debris, obviously merging galaxies and general asymmetry. This is true of only two other hosts, one spiral and one elliptical. Thus, what is seen clearly at low redshift as two closely separated galaxies, might instead appear to be a nearly edge-on spiral galaxy when seen at a higher redshift (e.g., 2M034857+2155 and 2M010607+2603). The results of this snapshot survey seem to indicate that 2MASS QSOs are found in both spiral and elliptical host galaxies (possibly more often in the former) exhibiting a range of dynamical activity.
f10.eps
3.4 Inclinations
The distribution of inclinations for the disk galaxies in the sample can potentially reveal selection effects caused by obscuring dust local to the nucleus or in the host galaxy. Inclinations were calculated while accounting for the intrinsic axial ratio, , of an edge-on galaxy using
| (3) |
where is the axial ratio b/a and (Hubble, 1926; Holmberg, 1958). The inclinations for each host are listed in Table LABEL:tbl_properties and their distribution is shown in Figure LABEL:fig_inclinations. The mean inclination is , with only one inclination greater than and none less than .
Despite our limited sample size (nine), there is an apparent disparity between the inclinations of the 2MASS QSO hosts and those of UV-selected AGN. With the exception of hard X-ray selected samples, spirals hosting AGN preferentially have
Table LABEL:tbl_properties
Measured properties of 2MASS QSOs
Object
NucleusaaNuclear and host magnitudes are the result of PSF-subtraction within apertures. The total uncertainty in this decomposition can be as large as one magnitude.
Host GalaxyaaNuclear and host magnitudes are the result of PSF-subtraction within apertures. The total uncertainty in this decomposition can be as large as one magnitude.
(2MASSI J)
F814WbbApparent magnitude in HST F814W filter (not K-corrected).
Morphology
Interaction?ccDouble-nuclei, merging galaxies or disturbed morphologies such as tidal debris and obvious asymmetry.
000810.8+135452
spiral
0.61
54°
N
005055.7+293328
spiral
0.46
65°
N
010607.7+260334
?
0.21
N
015721.0+171248
?
0.68
Y
022150.6+132741
elliptical
0.68
Y
023430.6+243835
N
032458.2+174849
?
0.87
N
034857.6+125547
?
0.41
Y
092049.0+190320
spiral
0.39
70°
N
125807.4+232921
?
0.41
N
130700.6+233805
elliptical
0.81
N
145331.5+135358
spiral
0.48
64°
N
151621.1+225944
spiral
0.37
72°
N
152151.0+225120
?
0.57
Y
154307.7+193751
?
0.74
Y
163700.2+222114
spiral
0.27
80°
Y
163736.5+254302
?
0.86
Y
165939.7+183436
?
0.44
Y
170003.0+211823
N
171442.7+260248
spiral
0.52
61°
N
171559.7+280717
?
0.65
N
222202.2+195231ddThe sample PSF was created from 2MASSI J222202.2+195231.
N
222221.1+195947
?
0.77
N
222554.2+195837
spiral
0.39
70°
N
225902.5+124646
elliptical
0.57
N
230304.3+162440
?
0.29
Y
230442.4+270616
elliptical
0.74
N
232745.6+162434
spiral
0.49
63°
N
234449.5+122143
Y

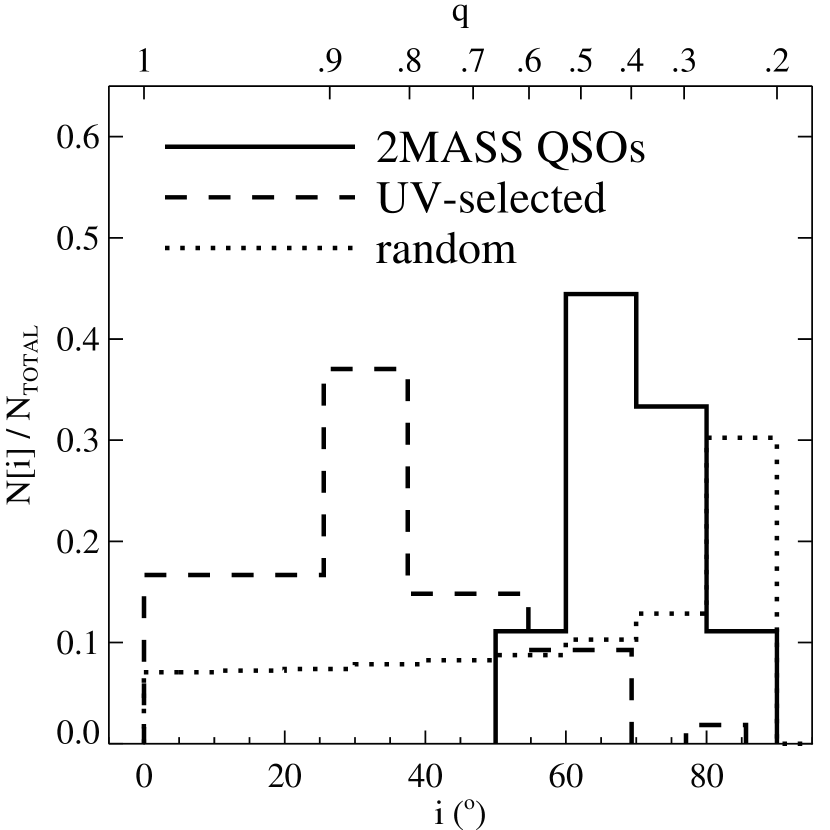
low inclinations (Simcoe et al., 1997). Maiolino & Rieke (1995) found a more even distribution of inclinations in a sample of very nearby Seyferts ( Mpc) in which nuclei with low apparent brightness were observable. They suggested that a 100 pc-scale torus coplanar with the galactic disk could be responsible for obscuring nuclear activity in highly-inclined disk galaxies. This is consistent with the results of our study. Reddened AGN in highly-inclined spirals that are missed by UV/optical surveys could be detected in the near-infrared. Furthermore, low inclinations would not be found in our sample because a less obstructed view of the nucleus would not satisfy the 2MASS red AGN color criterion.
A lack of the highest inclinations is not surprising. At the nucleus would be viewed through the entire plane of the galaxy and not likely seen at all. Also, the 2MASS selection criteria require objects to be seen in all three wavebands. Extremely red “J-band drop-outs” that were excluded from the original 2MASS AGN sample, may include objects with host galaxies seen nearly edge-on.
Table LABEL:tbl_companions
2MASS QSO apparent companions
Object
projection
(2MASSI J)
(h-1 kpc)
015721.0+171248
5.9
034857.6+125547
3.5
092049.0+190320
6.4
152151.0+225120
4.1
154307.7+193751
14.4
163736.5+254302
1.2
165939.7+183436
1.2
171442.7+260248
17.0
14.9
12.4
222221.1+195947
7.9
225902.5+124646
10.8
230304.3+162440
3.0
230442.4+270616
5.0
16.0
234449.5+122143
2.9
Table LABEL:tbl_companions_ulirgs
QDOT ULIRG apparent companions
Object
z
projection
(IRAS)
(h-1 kpc)
00207+1029
0.230
11.9
1.8
002752859
0.280
3.6
7.4
004610728
0.243
1.5
01185+2547
0.184
2.7
012841535
0.153
1.7
02054+0835
0.345
19.1
12.2
15.7
12.7
5.9
025876336
0.255
21.0
13.1
035386432
0.301
1.6
043844848
0.204
1.4
051204811
0.163
14.4
17.1
1.8
08201+2801
0.168
2.2
10026+4347
0.178
18.9
10558+3845
0.207
10579+0438
0.173
2.6
12108+3157
0.206
0.9
12202+1646
0.181
21.6
13469+5833
0.158
4.7
2.9
15168+0045
0.154
17.3
16.2
161590402
0.213
6.3
16455+4553
0.191
0.5
165411+530
0.194
4.0
171754+544
0.147
24.0
0.6
17469+5806
0.309
22.9
17.9
1.1
201764756
0.178
5.6
202533757
0.180
4.2
2.1
203141919
0.153
23.6
3.9
205075412
0.228
1.1
215475823
0.165
10.2
23140+0348
0.220
15.4
23498+2423
0.212
8.5
3.5 Apparent Companions
Previous studies have shown that low-redshift QSOs generally lie in moderate galaxy groups as opposed to rich clusters or field densities (Hartwick & Schade, 1990; Bahcall & Chokshi, 1991; Fisher et al., 1996, and references therein). The environment in which this sample of 2MASS-selected QSOs is found was characterized by studying the frequency and distribution of apparent companion galaxies. This refers to all extended objects with small projected separations. Redshift and color information are unavailable and only magnitude considerations can be used to eliminate some background galaxies. Clearly, the number of apparent companions is greater than or equal to the number of true companions that, by definition, lie in close proximity to the QSOs. The presence of physically unrelated objects will also dilute any non-random radial distribution (in the plane of the sky) of companion galaxies. However, for the purpose of comparative studies, background galaxies do not pose a systematic problem as long as the same identification criteria are employed for all studies.
Apparent companions were selected in the following way. The images were marginally smoothed and high-density regions with surface brightness exceeding the image noise by were flagged. The FWHM was then measured for each candidate and compared to that of the previously constructed PSF as well as with obvious field stars. Objects with a FWHM less than the adopted two pixel cutoff, as well as those possessing diffraction spikes in the case of stars with saturated cores, were rejected. Finally, an absolute magnitude criterion () was imposed assuming the same redshift as the QSO. This serves to discriminate against more luminous objects at larger, unrelated distances.
f14.eps
The identical procedure was performed on the sample of 30 ULIRGs drawn from the HST archive. To account for the different pixel scale of the WF3 camera, these images were first resampled to match the 2MASS QSO images observed with the PC. This allowed us to select the high density surface brightness regions with the same criteria, preventing any bias that might have resulted from different angular pixel sizes. The increased sensitivity of the wide field cameras to low surface brightness should not present a problem since the magnitude cutoff was substantially brighter than the limiting magnitudes of the 2MASS QSO images.
Apparent companions found within 25 projected kpc of the 2MASS QSOs are presented in Table LABEL:tbl_companions. Table LABEL:tbl_companions_ulirgs provides complimentary information for the QDOT ULIRGs in addition to their redshifts. Further discussion of these companions is deferred to §5 where a third sample will be considered.
3.6 Polarization
The optical broadband linear polarization of 70 2MASS QSOs (including all 29 objects addressed by this paper) has been measured, and a detailed discussion of their properties can be found in Smith et al. (2002). More than 10% of 2MASS QSOs show high polarization (), ranging up to . Lower polarization values were generally observed for lower luminosity AGN, a trend that can be understood in part by dilution of polarized light by unpolarized light from the host galaxy.
The PSF fitting in §2.4 provides a measure of the polarization dilution via starlight. If the linear polarization, , is measured with an uncertainty , and the total flux, , has nuclear contribution with uncertainty , then the nuclear polarization, , and uncertainty, , are given by
| (4) | |||||
| (5) |
Columns 2 and 4 of Table LABEL:tbl_pol list the measured and derived values. No adjustment for statistical bias has been made.
Table LABEL:tbl_pol
Polarization corrections for starlight dilution
Object
aaLinear polarization measurements (not corrected for statistical bias) from Smith et al. (2002).
bbFractional contribution of AGN to total light (within radius aperture) in HST filter F814W.
(2MASSI J)
000810.8+135452
0.79
0.47
0.01
0.001
78.83
47.70
005055.7+293328
2.47
0.49
0.18
0.009
13.42
2.74
010607.7+260334
6.03
0.54
1.00
0.020
6.03
0.55
015721.0+171248
1.44
0.47
0.40
0.015
3.64
1.20
022150.6+132741
0.39
0.24
0.08
0.002
4.60
2.83
023430.6+243835
2.57
0.46
0.90
0.003
2.85
0.51
032458.2+174849
1.23
0.38
0.76
0.009
1.62
0.50
034857.6+125547
2.23
0.73
0.12
0.014
19.36
6.74
092049.0+190320
1.15
0.52
0.23
0.014
5.07
2.31
125807.4+232921
1.22
0.13
0.87
0.006
1.40
0.15
130700.6+233805
2.45
0.63
0.07
0.006
36.10
9.80
145331.5+135358
0.81
0.29
0.07
0.005
10.80
3.94
151621.1+225944
1.02
0.28
0.55
0.022
1.85
0.51
152151.0+225120
1.02
0.48
0.07
0.003
14.18
6.71
154307.7+193751
1.33
0.26
0.49
0.020
2.72
0.54
163700.2+222114
2.34
0.40
0.35
0.002
6.70
1.15
163736.5+254302
0.42
0.28
0.25
0.019
1.65
1.11
165939.7+183436
6.30
0.73
0.56
0.016
11.21
1.34
170003.0+211823
11.11
0.80
1.00
0.015
11.11
0.82
171442.7+260248
0.86
0.33
0.57
0.036
1.50
0.58
171559.7+280717
6.08
1.28
0.56
0.011
10.81
2.29
222202.2+195231
7.19
1.14
0.99
0.003
7.26
1.15
222221.1+195947
0.95
0.23
0.76
0.009
1.25
0.30
222554.2+195837
1.38
0.56
0.01
0.001
98.82
40.65
225902.5+124646
1.03
0.78
0.49
0.016
2.09
1.59
230304.3+162440
0.24
0.51
0.02
0.003
10.85
23.09
230442.4+270616
0.24
0.55
0.26
0.016
0.94
2.15
232745.6+162434
1.08
0.57
0.06
0.002
18.89
10.00
234449.5+122143
1.01
0.24
0.69
0.002
1.46
0.35
Figure LABEL:fig_pol3 shows the range of polarization corrections () with error bars for the sample of 2MASS QSOs. The error-weighted mean correction is 1.46, although 52% (15/29) of the corrections are at least a factor of two, and 28% (8/29) are ten or greater even with consideration of the margin of error. Clearly, the flux contribution from host galaxies represents an important correction for the polarization of many 2MASS QSOs. Without this correction, 17% (5/29) of the sample had measured polarizations in excess of , all significant at greater than the level. With the correction, 62% (18/29) have though only 24% (7/29) have both and . The AGN is likely more obscured in the -band (approximately where the polarization measurements were made) than in the -band (where the starlight dilution was measured), so the correction factors may be even larger than stated.
The 2MASS QSOs reflect the full range of AGN types from type 1 to type 2 (Table LABEL:tbl_sample). Using the spectral classification adopted by Cutri et al. (2001), type “1.x” refers to objects that exhibit broad emission lines but have no detected . Objects that show broad but whose spectral coverage does not include are labeled “1.b”. Classification of 2M232745+1624 is ambiguous. A relationship is evident between AGN type and the degree of dilution due to host galaxy starlight (Figure LABEL:fig_pol3). Type 1 and 1.2 AGN have the smallest ratios while type 1.8-2 are dominated by the host galaxy. This result is consistent with the assertion by Smith et al. (2002) and the findings of Schmidt et al. (2002) and Smith et al. (2003) that the low polarization of type 1.8-2 objects is largely caused by the contribution of unpolarized starlight.
4 Comparison Studies
The aim of this snapshot survey was to characterize the host galaxies and environments in which the red 2MASS QSOs are found. Directly comparing these properties to those of previously investigated samples offers insight into the nature of the 2MASS QSOs and allows us to address the questions raised in §1. Three samples of ULIRGs were selected from the literature, as well as five studies of QSOs and their host galaxies. They were primarily chosen on grounds of suitability for useful comparison and are, therefore, a representative selection rather than an exhaustive one.
Surace et al. (1998) used HST to study nine ULIRGs, employing the same instrumental setup as this 2MASS QSO snapshot survey (WFPC2/PC/F814W). Color information allowed these authors to investigate a number of issues which are beyond the scope of discussion in this paper. However, they do report the incidence of interaction among their sample.
Farrah et al. (2001) imaged 23 QDOT ULIRGs with HST’s F606W filter (V-band) and the PC chip of WFPC2. They present observed properties including morphology and interaction. Only twelve of their objects have , a necessary condition for fairly comparing their surrounding environoments to those of the 2MASS QSOs. For this reason, apparent companions were identified for a different (but overlapping) sample of ULIRGs as was discussed in §2.5.
Kim, Veilleux, & Sanders (2002) recently obtained ground-based optical (-band) and near-infrared (-band) imaging of the IRAS 1-Jy sample of 118 ULIRGs. The analysis of these images is presented in Veilleux, Kim, & Sanders (2002). Among other things, these authors address morphology and the incidence of interaction.
The five QSO samples were constructed with varying selection criteria and include significant overlap. To ensure a homogeneous data set, only the radio-quiet PG QSOs were considered. We briefly describe each study before discussing the aggregate PG QSO sample.
McLeod & McLeod (2001) observed sixteen radio-quiet QSOs in the -band with the Near-Infrared Camera and Multi-Object Spectrometer (NICMOS) on HST. Ten of these objects were originally part of a sample of 26 high-luminosity QSOs ( and ) selected from the Bright Quasar Survey (Schmidt & Green, 1983) and studied by McLeod & Rieke (1994b). The additional six objects were drawn from a slightly larger redshift range ().
Percival et al. (2001) obtained deep -band ground-based imaging for a sample of 14 high luminosity, radio-quiet QSOs. The observations were made with the UK Infrared Telescope (UKIRT) equipped with the IRCAM3 camera. Their sample has total absolute magnitudes of and span the redshift range .
Surace, Sanders, & Evans (2001) carried out a ground-based optical and near-infrared study of 17 “infrared-excess” PG QSOs (all PG QSOs with and 666As described in Surace, Sanders, & Evans (2001), and is the “big blue bump” luminosity at 3200-8400 Å.) in order to investigate whether ULIRGs represent the progenitors of optically selected QSOs (Sanders et al., 1988). With regard to the properties addressed in our comparison study, these PG QSOs are indistinguishable from the others and respresent a significant contribution to host galaxy studies of radio-quiet PG QSOs.
McLure et al. (1999) conducted an optical imaging study of six radio-loud QSOs, nine radio-quiet QSOs and four radio galaxies. These objects were selected from a slightly larger sample () previously imaged in the near-IR (Dunlop et al., 1993). Observations were made with HST/WFPC2, and targets were centered on the Wide-Field 2 (WF2) chip. The F675W filter, which is roughly equivalent to the standard -band, was used.
Bahcall et al. (1997) pointed HST at the 14 most luminous QSOs () in the Véron-Cetty & Véron (1991) catalogue as well as six additional objects () satisfying the same luminosity and galactic latitude criteria ( and ). Observations were centered on the WF3 camera of WFPC2 and used filter F606W. In addition to addressing host morphology and luminosity, the authors carried out a simple analysis of the host environment by identifying all apparent companions777“Companions” were defined as extended objects with , assuming the same redshift as the host galaxy. within 25 projected kpc. Magnitudes and separations are presented for 13 such objects.
As a whole, these five studies contain 38 radio-quiet PG QSOs (Table LABEL:tbl_rqq). In those cases where an object is included in multiple samples, the measured luminosities and morphologies are generally in good agreement. There are three ocurrences where a host galaxy was called an elliptical by one study and given no morphological classification by another. In two cases, investigators disagree whether a host is a spiral or an elliptical. Thus, between 17 and 19 of the radio-quiet PG QSOs are reported to lie in elliptical galaxies, 13 to 15 are found in spirals and six hosts could not be classified.
The redshift distribution of this PG sample is comparable to that of the 2MASS QSOs. However, observations were made at a variety of wavelengths, and differing cosmologies were considered. Before comparisons could be made, luminosities first had to be translated to a common frame of reference. The -band was chosen because it corresponds closely to the F814W filter, minimizing the degree of alteration to the 2MASS QSO data. This is especially important for the nuclear components, as their SED is not well known.
Absolute -band magnitudes were calculated for the various samples by first accounting for differing and values using a form of Equation 1. If primed values denote the originally preferred cosmology, and absolute magnitudes are given in the
Table LABEL:tbl_rqq
PG QSOs from literature
Object
z
Host
Inter-
(PG)
action?**Determined by authors of this paper based on published imaging. The same criteria
applied to the 2MASS sample were used (double-nuclei, merging galaxies or disturbed morphologies
such as tidal debris and obvious asymmetry).
0026+129
0.142
Ea
22.0
23.9
N
0043+039
0.384
Sb
22.7
24.1
0052+251
0.155
Se
23.1
23.7
N
0054+144
0.171
Ed
23.5
23.8
N
Ee
23.4
23.5
N
0157+001
0.163
?d
24.1
23.0
Y
Ec
0838+770
0.131
Sc
22.6
23.0
N
0923+201
0.190
Ed
23.1
23.9
N
Ee
23.1
23.8
N
0947+396
0.206
Sa
22.5
23.3
N
0953+415
0.239
Ed
22.7
24.8
N
?e
22.3
25.0
Y
1001+054
0.161
?c
21.0
23.5
N
1012+008
0.185
Ed
23.6
23.2
Y
?e
23.9
23.6
Y
1029140
0.086
Ee
22.7
24.0
N
1048+342
0.167
Ea
22.5
23.4
Y
1114+445
0.144
Sc
21.6
24.0
Y
1116+215
0.177
Ee
23.6
24.8
N
1121+422
0.224
Ea
21.2
23.4
N
1126041
0.060
Sc
22.3
22.9
Y
1151+117
0.176
?a
21.7
23.8
N
1202+281
0.165
Ee
22.7
23.8
N
Ec
1216+069
0.334
Eb
22.3
24.4
1229+204
0.064
Sc
22.6
22.0
Y
1307+085
0.155
Ee
22.5
24.1
N
1309+355
0.184
Se
23.1
23.9
N
1322+659
0.168
Sa
21.8
23.4
N
1351+640
0.088
?c
22.4
23.9
N
1352+183
0.158
Ea
22.3
23.4
N
1354+213
0.300
Ea
22.8
24.7
N
Sb
22.3
23.2
1402+261
0.164
Sc
21.7
24.1
N
Se
22.4
23.8
N
1411+442
0.090
?c
22.1
23.7
Y
1415+451
0.114
?c
22.1
23.7
N
1427+480
0.221
Ea
22.1
23.5
Y
1440+356
0.079
Sc
22.3
23.4
N
1444+407
0.267
Ee
22.8
24.7
N
1543+489
0.400
Sb
22.4
24.8
1613+658
0.129
Ea
23.7
23.2
Y
?c
23.6
24.1
Y
2112+059
0.466
?b
22.1
25.4
2130+099
0.062
Sc
22.5
23.0
N
2233+134
0.325
Ea
22.3
24.4
N
Sb
21.2
23.7
eefootnotetext: Bahcall et al. (1997)
-band, then,
| (6) |
The conversion from -band to -band is then given by,
| (7) |
where refers to the flux of an A0V star in the band of interest (Bessel, 1979; Campins, Rieke & Lebofsky, 1985). Values for and were measured in the same way as the K-corrections described in §3.1. The SDSS composite QSO spectrum only extends to the rest -band and could not be used to transform the -band nuclear luminosities in Percival et al. (2001). The red-end spectral index of the composite SED was used in this case, .
The resulting host and nuclear -band luminosities are provided in Table LABEL:tbl_rqq. Of the eight objects included in more than one sample, five of them agree within half of a magnitude for both the host and the nucleus. Disagreement ( magnitudes) among the remaining three objects can be understood in part by disparate host galaxy morphologies resulting in different fitted luminosities. Adopting the first value listed for each object in Table LABEL:tbl_rqq, the absolute -band magnitudes of the radio-quiet PG host galaxies range from 0.3 L* to 5.2 L* with a mean of 1.5 L*. The corresponding nuclear values are and .
5 Discussion
The galaxies in which the 29 2MASS QSOs are found do not differ dramatically from those hosting classical PG QSOs. Imaging available to date suggests that the latter are both ellipticals and spirals in roughly equal proportion. The 2MASS QSO hosts also include both morphological types, though there is some evidence that they are spirals more often than not. As many as 26% of the radio-quiet PG QSO hosts were not assigned a morphology by at least one investigating team. The larger fraction of the 2MASS QSO hosts with ambiguous morphologies can be explained in part by the greater efforts invested by some of the comparison studies in modeling the host and assigning a morphology.
The 2MASS QSOs are not found in comparatively underluminous or unusually bright galaxies. The top panel of Figure LABEL:fig_agn_vs_gal plots nuclear versus host galaxy luminosity for the 2MASS and PG QSOs. The horizontal dashed line indicates the absolute -band magnitude of an L* galaxy. The 2MASS QSO host magnitudes are consistent with the locus formed by the comparison sample, and both groups have a mean value of 1.5 L*.
On the otherhand, the 2MASS nuclear luminosities are generally fainter, ranging over seven magnitudes. Several of the brightest objects are as bright as the PG QSOs. The remaining majority do not satisfy the traditional criterion for QSO classification as indicated by the vertical dashed line in Figure LABEL:fig_agn_vs_gal. Recall from Figure LABEL:fig_pg that 2MASS QSOs are all as bright as PG QSOs in the -band. If the 2MASS and PG QSOs also share similar intrinsic nuclear -band luminosities, then between zero and seven () magnitudes of extinction in the -band are required to shift their luminosities to the average of the PG sample, .
f15.eps
The bottom panel of Figure LABEL:fig_agn_vs_gal plots the 2MASS QSO nuclear luminosities versus their colors. A Spearman’s rank correlation test () confirms the correlation suggested by the linear fit (dotted line). Some of the scatter is due to the fact that the values plotted are total magnitudes including both nuclear light and light from the host galaxy. The fact that dimmer 2MASS QSO nuclei are also redder is consistent with dust obscuration causing the large range in nuclear luminosities. There appears to be no relationship between morphology and or , suggesting that any obscuring material is local to the nucleus and not dependent on the host galaxy. Where suitable color information was available, PG QSO data points have been included on the plot.
Various studies in recent years have suggested that more luminous nuclei are preferentially found in elliptical hosts. Among the samples considered in this paper, this claim is supported by the results of McLure et al. (1999) and contradicted by those of Percival et al. (2001). We find no correlation between host galaxy morphology and the luminosity of the nucleus for the 38 radio-quiet PG QSOs, nor for the 2MASS QSOs (-band).
Galaxy interaction, a possible fueling mechanism for AGN, is an important parameter to consider when comparing QSO samples. However, visual inspection of a host galaxy’s dynamical state is subject to a number of problems. Increased star formation triggered by minor and major mergers is more highly contrasted in bluer filters, complicating comparisons of studies made at different wavelengths. Additionally, the sensitivity and resolution of the instrument used for observations affects whether or not faint tidal tails are detected or multiple nuclei are distinguished. Of course, the subjectivity of assessing degrees of interaction is also sensitive to both the investigator and the investigator’s working definition of “interaction”.
Tables LABEL:tbl_properties and LABEL:tbl_rqq list both the 2MASS QSOs and radio-quiet PG QSOs as exhibiting or not exhibiting evidence of interaction. This sometimes uncertain distinction was made by a single individual to remove some degree of subjectivity. Criteria for interaction include multiple nuclei, obviously merging galaxies, remnant debris such as tidal tails, and clear asymmetry. Ten of the 2MASS QSOs (34%) were classified as past or present interacting systems, as were ten of the radio-quiet PG QSOs (29%). Considering the inhomogeneity of the PG imaging, rough agreement between the two samples seems reasonable.
A more generic indicator of the host galaxy environment is the number of companion galaxies within a fixed physical distance. In the absence of known redshifts, all apparent companions (extended objects with small projected separations) can be considered for comparative purposes. The methodology described in §3.5 was chosen in order to duplicate the Bahcall et al. (1997) study of apparent companions around a sample of radio-quiet PG QSOs. Only those objects with projected separations of 25 h-1 kpc or less are presented by those authors. However, this coincides with the maximum distance at which apparent companion information is complete for both the 2MASS QSOs and the QDOT ULIRGs drawn from the HST archive. Thus, a fair comparison is possible between these three samples.
f16.eps
Table LABEL:tbl_ks
Kolmogorov-Smirnov statistics**The KS test is a two-sided non-parametric statistic which returns the normally-distributed probability that two samples were drawn from the same parent population. Values in this table are presented as percentages.
Apparent Companion Frequencies
B97aaMcLeod & McLeod (2001)
ULIRGbbPercival et al. (2001)
2MASSccSurace, Sanders, & Evans (2001)
B97
Apparent Companion Separations
B97
ULIRG
RNDddMcLure et al. (1999)
2MASS
B97
ULIRG
aafootnotetext: Bahcall et al. (1997)
bbfootnotetext: QDOT ULIRGs (this paper)
ccfootnotetext: 2MASS QSOs (this paper)
ddfootnotetext: random distribution
Figure LABEL:fig_companionsa shows the apparent companion frequencies for each sample. The number of 2MASS QSOs, radio-quiet PG QSOs and ULIRGs with no apparent companions is (), (), and (), respectively. Not shown on this plot is one ULIRG with five such objects. Table LABEL:tbl_ks lists results of KS tests applied to the frequency distributions as well as the projected separations. These values indicate the probability (in percentage form) that two samples are drawn from the same parent distribution. The number of apparent companions around the 2MASS QSOs is not statistically different than the number around the radio-quiet PG QSOs. However, the 2MASS QSO and ULIRG distributions differ at the 99.97% confidence level.
Figure LABEL:fig_companionsb shows the positions of apparent companions relative to the central object in both the 2MASS QSO and ULIRG samples. The former are indicated by filled circles. Given the similar samples sizes (29 and 30), the far greater number of apparent companions in the ULIRG images is clear.
The projected separations are binned and plotted as cumulative histograms for all three samples in Figure LABEL:fig_companionsc. Additionally, the profile expected for objects that are randomly distributed in the plane of the sky is shown. Both the 2MASS QSOs and the ULIRGs show an excess over random at close separations. The cumulative distribution rises sooner for the latter, reflecting smaller projected separations of the closest extended objects. The probability of being randomly distributed in the plane of the sky is and for the ULIRG and the 2MASS QSO apparent companions, respectively. The apparent companions identified by Bahcall et al. (1997), for their subset of radio-quiet PG QSOs, cannot be distinguished from the random expectation (with respect to radial distribution only, not total number).
Interpretation of the comparative apparent companion results is not clear-cut. The radial distribution implies a similarity between the 2MASS QSO and the ULIRG environments. However, if 2MASS QSOs represent evolved ULIRGs, one might expect to find more closely separated companions around the former. The opposite is in fact seen. The random radial distribution of apparent companions around the PG QSOs may or may not indicate that previously close companions have already been swallowed by the host galaxies. What is clear is that the ULIRGs studied have many more apparent companions at all separations (within 25 kpc) than either the 2MASS QSOs or the radio-quiet PG QSOs, and unlike the other two samples, the ULIRGs nearly universally have at least one apparent companion.
The immediate environments of the ULIRGs and 2MASS QSOs are significantly different. Farrah et al. (2001) were able to classify morphologies for only two of 23 ULIRGs (both ellipticals). All but one of the objects in their sample are obviously interacting systems. Similarly, Surace et al. (1998) found that eight of the nine objects in their sample exhibit evidence that they are advanced merger systems. These results are consistent with those of Veilleux, Kim, & Sanders (2002) who found that of their ULIRGs could be adequately fit with a de Vaucouleurs profile and all but one of the 118 ULIRGs show signs of strong interation. The remains of rapid star formation and universal tidal debris that one might expect to see if the red QSOs found by 2MASS represent an intermediate stage of evolution between ULIRGs and PG QSOs do not appear to be present. Clearly, many of the 2MASS QSOs have undergone or are undergoing interaction events. However, many others appear to be isolated, undisturbed galaxies.
There is growing evidence that 2MASS QSOs may simply be explained by some form of the proposed unified model for AGN. In that scenario, these objects are normal QSOs that are heavily obscured along our line of sight. Smith et al. (2002) found the sample as a whole to be more highly polarized than other QSO samples. We have shown by properly accounting for starlight dilution, that the polarization of the nuclear region is significantly underestimated by broad-band polarimetry in many cases. Furthermore, the magnitude of the corrections is correlated to AGN type, with the nucleus to galaxy flux ratio generally smaller for narrow-line objects. All of this combined with the lack of narrow polarized emission lines in many of the highly polarized objects (Smith et al., 2000, 2003; Schmidt et al., 2002) is consistent with dust obscuration near the nucleus. If obscuring dust were generally located further away, as in a galactic disk, one might expect to correlate with morphology. We see no evidence of this.
The fact that the 2MASS QSOs have similar absolute -band magnitudes and that their host galaxies do not distinguish themselves significantly from those of PG QSOs in the -band implies that the red colors observed are a property of the nucleus alone. The 2MASS AGN are dominated by type 1 objects, and edge-on host galaxies seem to be under-represented. Therefore, even the 2MASS AGN sample is probably missing extremely obscured objects like those identified by IRAS. In these putative highly obscured objects, the AGN may not contribute significantly in the -band. In that case, the -band flux will reach a minimum consistent with the host galaxy flux, and these objects will not have easily distinguishable colors. The AGN might become slightly visible in , but may still not distinguish itself.
Chandra observations show that many 2MASS AGN are faint (probably absorbed) in x-rays (Wilkes et al., 2002), hindering the identification of highly obscured AGN in the nearby universe. The presence of extinguishing dust very near the nucleus, as the evidence suggests for the 2MASS QSOs, should make these objects bright in the mid-to-far infrared compared with their optical/near-IR emission. While this question will be examined for a large number of 2MASS AGN with SIRTF, identification of many highly obscured QSOs in the local universe may have to wait for future, deep all sky surveys at wavelengths longer than two microns.
6 Conclusions
We have observed and analyzed a sample of 29 red QSOs selected from the 2MASS near-infrared survey. HST/WFPC2 -band images were used to model the PSF and subtract nuclear light to study the host galaxies. We find that 2MASS QSOs live in a variety of galaxy types with luminosities ranging between 0.3 and 4.2 L*. Of the 26 objects with obvious hosts, 9 were found in spiral galaxies and 4 in ellipticals. The remaining sixteen could not be classified with confidence. It was argued that at least half of these may be spirals based on the distribution of measured eccentricities. Roughly a third of the sample exhibit evidence of interaction, predominantly those with ambiguous morphologies.
The immediate environments of the 2MASS QSOs were inspected by identifying apparent companions with projected separations less than 25 kpc. Less than half the sample has one or more apparent companions, with one having two and another three. When compared to a sample of radio-quiet PG QSOs, no statistically significant difference was found. This is in contrast to the same analysis performed on a sample of ULIRGs for which all but one object had at least one apparent companion. The projected radial distributions suggest that companion galaxies lie closer, on average, to the 2MASS QSOs and ULIRGs than the PG QSOs, though data is available for fewer objects in the latter sample.
The 2MASS QSOs were already known to be a relatively highly polarized sample. The amount of unpolarized starlight from host galaxies was measured and used to estimate polarization corrections. The resulting increase is substantial and depends on AGN type, with type 2s generally having the largest corrections.
Absolute -band magnitudes of the AGN span the range to . A strong correlation between and color was noted, with redder objects appearing fainter. Neither nuclear luminosity nor was found to correlate with morphology.
No indication was seen that the red 2MASS QSOs represent an intermediate evolutionary step between ULIRGs and classical QSOs. In light of the similarities between host galaxies and environments, the results of this study suggest that the relatively faint 2MASS QSO -band nuclear luminosities are caused by obscuration local to the nucleus and that the 2MASS QSOs differ from radio-quiet PG QSOs only by their orientation with respect to the observer. Thus, the red QSOs being identified by 2MASS are likely the missing QSO population predicted to exist by x-ray and radio surveys. However, the range of properties observed leaves open the possibility that more than one phenomenon is responsible for the nature of the large number of QSOs discovered by 2MASS.
References
- Antonucci (1993) Antonucci R. 1993, ARA&A, 31, 473
- Bahcall & Chokshi (1991) Bahcall, N. A., & Chokshi A. 1991, ApJ, 380, L9
- Bahcall et al. (1997) Bahcall, J. N., Kirhakos, S., Saxe, D. H., & Schneider, D. P. 1997, ApJ, 479, 642
- Beichman et al. (1986) Beichman, C.A., Soifer, B. T., Helou, G., Chester, T. J., Neugebauer, G., Gillett, F. C., & Low, F. J. 1986, ApJ, 308, L1
- Beichman et al. (1998) Beichman, C. A., Chester, T. J., Cutri, R., Lonsdale, C. J., Kirkpatrick, D., Smith, H. E., & Skrutskie, M. 1998, PASP, 110, 367
- Benn et al. (1998) Benn, C. R., Vigotti, M., Carballo, R., Gonzalez-Serrano, J. I., & Sánchez, S. F. 1998, MNRAS, 295, 451
- Berriman et al. (1990) Berriman, G., Schmidt, G. D., West, S. C., & Stockman, H. S. 1990, ApJS, 74, 869
- Bessel (1979) Bessel, M. S. 1979, PASP, 91, 589
- Biretta et al. (2002) Biretta, L., et al. 2002, WFPC2 Instrument Handbook, Version 7.0 (Baltimore: STScI)
- Blanton et al. (2003) Blanton, M. R., et al. 2003, ApJ, submitted
- Borne, Bushouse, Lucas, & Colina (2000) Borne, K. D., Bushouse, H., Lucas, R. A., & Colina, L. 2000, ApJ, 529, L77
- Boyle & di Matteo (1995) Boyle, B. J., & di Matteo, T. 1995, MNRAS, 277, L63
- Buote & Canizares (1994) Buote D. A., & Canizares C. R. 1994, ApJ, 427, 86
- Bushouse et al. (2002) Bushouse, H. A., et al. 2002, ApJS, 138, 1
- Campins, Rieke & Lebofsky (1985) Campins, H., Rieke, G. H., & Lebofsky, M. J. 1985, AJ, 90, 896
- Comastri et al. (1995) Comastri, A., Setti, G., Zamorani, G., & Hasinger, G. 1995, A&A, 296, 1
- Cutri et al. (1994) Cutri, R. M., Huchra, J. P., Low, F. J., Brown, R. L., & vanden Bout, P. A. 1994, ApJ, 424, L65
- Cutri et al. (2001) Cutri, R. M., Nelson, B. O., Kirkpatrick, J. D., Huchra, J. P., & Smith, P. S. 2001, in ASP Conf. Ser. 232, The New Era of Wide Field Astronomy, ed. R. Clowes, A. Adamson, & G. Bromage (San Francisco: ASP), 78
- Cutri et al. (2002) Cutri, R. M., Nelson, B. O., Francis, P. J., & Smith, P. S. 2002, in ASP Conf. Ser. 284, AGN Surveys, ed. R.F. Green, E.Ye. Khachikian, & D.B. Sanders (San Francisco: ASP), 127
- de Vaucouleurs et al. (1995) de Vaucouleurs, G., de Vaucouleurs, A., Corwin, H. G., Buta, R. J., Paturel, G., & Fouque, P. 1995, VizieR Online Data Catalog, 7155
- Dunlop et al. (1993) Dunlop, J. S., Taylor, G. S., Hughes, D. H., & Robson, E. I. 1993, MNRAS, 264, 455
- Farrah et al. (2001) Farrah, D., et al. 2001, MNRAS, 326, 1333
- Fisher et al. (1996) Fisher, K. B., Bahcall, J. N., Kirhakos, S., & Schneider, D. P. 1996, ApJ, 468, 469
- Fukugita, Shimasaku, & Ichikawa (1995) Fukugita, M., Shimasaku, K., & Ichikawa, T. 1995, PASP, 107, 945
- Goodrich et al. (1996) Goodrich, R. W., Miller, J. S., Martel, A., Cohen, M. H., Tran, H. D., Ogle, P. M., & Vermeulen, R. C. 1996, ApJ, 456, L9
- Hartwick & Schade (1990) Hartwick, F. D. A., & Schade, D. 1990, ARA&A, 28, 437
- Heckman, Armus & Miley (1990) Heckman T. M., Armus L., & Miley G. K. 1990, ApJS, 74, 833
- Hines & Wills (1993) Hines, D. C., & Wills, B. J. 1993, ApJ, 415, 82
- Hines et al. (1995) Hines, D. C., Schmidt, G. D., Smith, P. S., Cutri, R. M., Low, F. J. 1995, ApJ, 450, L1
- Hines et al. (1999a) Hines, D. C., Low, F. J., Thompson, R. I., Weymann, R. J., & Storrie-Lombardi, L. J. 1999a, ApJ, 512, 140
- Hines et al. (1999b) Hines, D. C., Schmidt, G. D., Wills, B. J., Smith, P. S., Sowinski, L. G. 1999b, ApJ, 512, 145
- Holmberg (1958) Holmberg, E. B. 1958, Lund Medd. Astron. Obs. Ser. II, 136, 1
- Holtzman et al. (1995) Holtzman, J. A., Burrows, C. J., Casertano, S., Hester, J. J., Trauger, J. T., Watson, A. M., & Worthey, G. 1995, PASP, 107, 1065
- Hubble (1926) Hubble, E. 1926, ApJ, 64, 321
- Karkoshka & Biretta (2001) Karkoshka, E., & Biretta, J. 2001, Instrument Science Report WFPC2 2001-07
- Kim, Veilleux, & Sanders (2002) Kim, D. C., Veilleux, S., & Sanders, D. B. 2002, ApJS, 143, 277
- Kleinmann & Low (1970a) Kleinmann, D. E., & Low, F. J. 1970a, ApJ, 159, L165
- Kleinmann & Low (1970b) Kleinmann, D. E., & Low, F. J. 1970b, ApJ, 161, L203
- Krist & Hook (2001) Krist, J., & Hook, R. 1996, Tiny Tim User’s Manual, v6.0 (Baltimore: STScI)
- Lawrence et al. (1999) Lawrence, A., et al. 1999, MNRAS, 308, 897
- Low & Kleinmann (1968) Low, F. J., & Kleinmann, D. E. 1968, AJ, 73, 868
- Low et al. (1988) Low, F. J., Cutri, R. M., Huchra, J. P., & Kleinmann, S. G. 1988, ApJ, 327, L41
- Maiolino & Rieke (1995) Maiolino, R., & Rieke, G. H. 1995, ApJ, 454, 95
- McLeod & McLeod (2001) McLeod, K. K., & McLeod, B. A. 2001, ApJ, 546, 782
- McLeod & Rieke (1994a) McLeod, K. K., & Rieke, G. H. 1994, ApJ, 420, 58
- McLeod & Rieke (1994b) McLeod, K. K., & Rieke, G. H. 1994, ApJ, 431, 137
- McLeod & Rieke (1995a) McLeod, K. K., & Rieke, G. H. 1995, ApJ, 441, 96
- McLeod & Rieke (1995b) McLeod, K. K., & Rieke, G. H. 1995, ApJ, 454, L77
- McLeod, Rieke & Storrie-Lombardi (1999) McLeod, K. K., Rieke, G. H., & Storrie-Lombardi, L. J. 1999, ApJ, 511, L67
- McLure et al. (1999) McLure, R. J., Kukula, M. J., Dunlop, J. S., Baum, S. A., O’Dea, C. P., & Hughes, D. H. 1999, MNRAS, 308, 377
- Neugebauer et al. (1987) Neugebauer, G., Green, R. F., Matthews, K., Schmidt, M., Soifer, B. T., & Bennett, J. 1987, ApJS, 63, 615
- Norberg et al. (2002) Norberg, P., et al. 2002, MNRAS, 336, 907
- Peebles (1993) Peebles, P. J. E. 1993, “Principles of Physical Cosmology”. Princeton University Press: Princeton, NJ, 330
- Percival et al. (2001) Percival, W.J., Miller, L., McLure, R. J., & Dunlop, J. S. 2001, MNRAS, 32, 843
- Rieke & Lebofsky (1985) Rieke, G. H., & Lebofsky, M. J. 1985, ApJ, 288, 618
- Rieke & Low (1972) Rieke, G. H., & Low, F. J. 1972, ApJ, 176, L95
- Sanders et al. (1988) Sanders, D. B., Soifer, B. T., Elias, J. H., Madore, B. F., Matthews, K., Neugebauer, G., & Scoville, N. Z. 1988, ApJ, 325, 74
- Schmidt & Green (1983) Schmidt, M., & Green, R. F. 1983, ApJ, 269, 352
- Schmidt & Hines (1999) Schmidt, G. D., & Hines, D. C. 1999, ApJ, 512, 125
- Schmidt et al. (2002) Schmidt, G. D., Smith, P. S., Foltz, C. B., & Hines, D. C. 2002, ApJ, 578, L99
- Simcoe et al. (1997) Simcoe, R., McLeod, K. K., Schachter, J., & Elvis, M. 1997, ApJ, 489, 615
- Skrutskie et al. (1997) Skrutskie, M. F., et al. 1997, Proc. Workshop “The Impact of Large Scale Near-IR Sky Surveys”, ed. Garzón F. et al. (Dordrecht: Kluwer), 25
- Smith et al. (2000) Smith, P. S., Schmidt, G. D., Hines, D. C., Cutri, R. M., & Nelson, B. O. 2000, ApJ, 545, L19
- Smith et al. (2002) Smith, P. S., Schmidt, G. D., Hines, D. C., Cutri, R. M., & Nelson, B. O. 2002, ApJ, 569, 23
- Smith et al. (2003) Smith, P. S., et al. 2003, ApJ, submitted
- Surace, Sanders, & Evans (2001) Surace, J. A., Sanders, D. B., & Evans, A. S. 2001, AJ, 122, 2791
- Surace et al. (1998) Surace, J. A., Sanders, D. B., Vacca, W. D., Veilleux, S., & Mazzarella, J. M. 1998, ApJ, 492, 116
- Tran (1995) Tran, H. D., 1995, ApJ, 440, 597
- Tran (2001) Tran, Q. D., et al. 2001, ApJ, 552, 527
- Vanden Berk et al. (2001) Vanden Berk, D. E., et al. 2001, AJ, 122, 549
- Veilleux, Kim, & Sanders (2002) Veilleux, S., Kim, D. C., & Sanders, D. B. 2002, ApJS, 143, 315
- Véron-Cetty & Véron (1991) Véron, M. P., & Véron, P. 1991, “A Catalogue of Quasars and Active Nuclei” (ESO Sci. Rept. No. 10) (5th ed.; Garching: ESO)
- Webster et al. (1995) Webster, R. L., Francis, P. J., Peterson, B. A., Drinkwater, M. J., & Masci, F. J. 1995, Nature, 375, 469
- Whitmore & Heyer (1997) Whitmore, B., & Heyer, I. 1997, ISR WFPC2 97-08
- Wills & Hines (1997) Wills, B. J., & Hines, D. C. 1997, in ASP Conf. Ser. 128, Mass Ejection from AGN, ed. Arav, N., Shlosman, I., & Weymann, R. J. (Sa Francisco: ASP), 99
- Wilkes et al. (2002) Wilkes, B. J., Schmidt, G. D., Cutri, R. M., Ghosh, H., Hines, D. C., Nelson, B., & Smith, P. S. 2002, ApJ, 564, L65
A Comments on Individual Objects
2M000810+1354Seemingly isolated spiral galaxy with only 1% of total observed light coming from the nucleus.
2M005055+2933Either a modestly inclined barred spiral galaxy with visible dust obscuration or an atypical edge-on warped disk. Observed light is dominated by host galaxy, and the corrected polarization exceeds 13%.
2M010607+2603Highly polarized object with very little relative light contribution from the morphologically ambiguous host galaxy (). The surface brightness profile is very poorly determined; however, the host must either be a highly inclined spiral or an interacting system. The polarization angle is closely aligned in either case.
2M015721+1712Asymmetrical host galaxy responsible for roughly half of the total light. An extended feature in southeast corner is present both before and after PSF-subtraction. A possible faint companion or tidal debris is seen within 6 projected kpc below the object.
2M022150+1327Although not visible in Figure LABEL:fig_hosts1, an apparent tidal arm (exceeding 20 kpc in length) extends from the bottom of the host image and arcs to the north. Also, there is marginal visual evidence that the host galaxy is in fact two merging galaxies of equal size.
2M023430+2438Residual image and surface brightness profile yield essentially no information about the 2 L* host galaxy at .
2M032458+1748Smoothly distributed emission from host galaxy with majority of total observed light originating from the nucleus.
2M034857+1255Shares the distinction (with 2M130700+2338) of having reddest near-IR color () and clearly comprises two merging galaxies.
2M092049+1903Apparently isolated spiral galaxy in relatively highly populated field. Only one apparent companion meets the adopted magnitude cutoff, although six additional extended objects have projected separations of 25 kpc or less.
2M125807+2329Very faint elongated host galaxy centered roughly on the QSO nucleus.
2M130700+2338Elliptical galaxy with a very red near-IR color ( for AGN+host).
2M145331+1353Clear spiral structure with large observed light contribution from host galaxy.
2M151621+2259Very faint spiral arms emerging from a possible bar.
2M152151+2251Disturbed host showing asymmetry and a luminous knot of unknown nature.
2M154307+1937Although fairly well described by a profile, residual flux exhibits obvious asymmetry. There is a possible alignment of the polarization angle and the fitted isophotes, however the degree of polarization is very low.
2M163700+2221Host galaxy possesses a disk with multiple luminous knots within 5 kpc of nucleus. Not evident in Figure LABEL:fig_hosts1 is possible tidal debris extending from the host in the northwest direction. The corrected polarization is 7% and the polarization angle is closely aligned with the disk.
2M163736+2543An apparently merging system with the majority of observed emission from the galaxies. Close inspection of the inner region reveals multiple nuclei.
2M165939+1834Inner region clearly resolved into two distinct components. Slightly more than half of the observed luminosity comes from the nucleus which has a corrected polarization of 11%. Interestingly, the polarization angle is rotated almost exactly from the axis through the two components, perhaps suggesting scattering of nuclear light by a close companion.
2M170003+2118No residual flux is visible to reveal the nature of the L* galaxy hosting the highest redshift QSO in the sample (). The corrected polarization is 11%.
2M171442+2602Grand design spiral with three apparent companions. The anomalous light trail is identically present in both 400 second integrations.
2M171559+2807Remarkable asymmetry present in PSF-subtracted image. The high polarization and orientation of the polarization angle are consistent with the extended feature being an ionization cone.
2M222202+1952Point-like object used for construction of the PSF (this explains the odd appearance of the PSF-subtracted image in Figure LABEL:fig_hosts1).
2M222221+1959Faint, smoothly distributed residual flux with disturbed surface brightness profile.
2M222554+1958Inner portion of spiral arms seen in Figure LABEL:fig_hosts1. Not visible is faint extension of these arms. Only 1% of the total observed light is from the nucleus.
2M225902+1246Excellent agreement with profile and smooth visual appearance. Recent observations have established that this object’s color barely falls short of the 2MASS AGN criterion, though it was included in the full analysis.
2M230304+1624Clearly an interacting system. In addition to the extremely close projected separation of the two galaxies, a faint luminous tail extends towards the northeast corner of the image in Figure LABEL:fig_hosts1.
2M230442+2706Surface brightness profile described well by law despite interference beyond 2.5 kpc by apparent companion with 5 kpc projected separation.
2M232745+1624Faint apparent spiral arms. Inclination may have been overestimated if host galaxy is in fact a barred spiral.
2M234449+1221Very little visible residual flux around PSF-subtracted nucleus. Well behaved surface brightness profile is misleading as it probes different objects at different radii. The system appears to be interacting. A common envelope seems to include the QSO and the extremely close companion object. The polarization angle is rotated nearly from the axis connecting the two bright spots.