Chapter 1 Low Statistics of EHECRs
Abstract
The nature of the unknown sources of ultra-high energy cosmic rays can be revealed through the detection of the GZK feature in the cosmic ray spectrum. The only two experiments that have probed this energy range, AGASA and HiRes, have apparently conflicting results. HiRes measured a flux consistent with the GZK feature while AGASA reported a larger than expected flux of so-called Super-GZK particles. Here we emphasize that neither experiment has gathered the statistics necessary for making a definitive measurement of the GZK cutoff. The photo-pion production responsible for the GZK feature is stochastic for energies around the cutoff leading to large fluctuations of the spectrum for low statistics measurements. We show that the results from AGASA and HiRes results are within about of one another by simulating 400 spectra for a range of input spectral indices normalized to the number of events above eV for each experiment. If a 15% systematic correction in energy is applied to both experiments, the agreement between the experiments improves considerably and the best fit input spectral index becomes for both data sets. Our results clearly show the need for much larger experiments such as Auger and EUSO, that can increase the number of detected events by 2 orders of magnitude. Only large statistics experiments can finally prove or disprove the existence of the GZK feature in the cosmic ray spectrum.
1. Introduction
The most extreme accelerators in the universe remain a mystery. Particles with energies above eV have been observed to arrive on Earth from directions in space that are not clearly associated with any particular source. The mystery of the origin and nature of these particles should be resolved once we have a statistically significant measurement of the spectrum and angular distribution of these particles. Next generation experiments such as the Pierre Auger Project and the EUSO experiment should be able to finally resolve this mystery.
Presently available data show a number of interesting hints of possible resolutions to this mystery. The High Resolution Fly’s Eye fluorescence experiment has reported hints of a flux decrease around the Greisen-Zatsepin-Kuzmin (GZK) feature. A significant decrease in the flux of ultra-high energy extragalactic protons was predicted by Greisen [1] and Zatsepin and Kuzmin [2] following the discovery of the cosmic microwave background (CMB). Protons with energies above eV lose a significant fraction of their energy through the photo-pion production off the CMB as they traverse tens of Mpc in the universe. If the HiRes result is confirmed with much better statistics the nature of the highest energy cosmic rays are most likely to be extragalactic protons.
The giant airshower ground array, AGASA, does not see the suppression expected at the GZK feature. They reported about 11 events above eV implying a flux above the expected level due to photo-pion production. The excess flux seems incompatible with extragalactic protons and a number of alternatives have been proposed to address this discrepancy [3]. In addition, the distribution in the sky of arrival directions reported by AGASA shows hints of clustering in small scales. These may be the first hints of point sources.
Here I discuss the significance of the apparent inconsistencies between the two experiments and re-emphasize the lack of sufficient statistics in both experiments to address the very important question of the origin of the highest energy particles ever observed. This presentation is based on results reported in the recent work of DeMarco, Blasi, and Olinto (2003)[4] (see also [5]).
2. AGASA versus HiResI
The two largest experiments to measure the flux of UHECRs, AGASA [6] and HiResI [7], reported apparently conflicting results shown in Fig. LABEL:ehecr:fig:agasahires
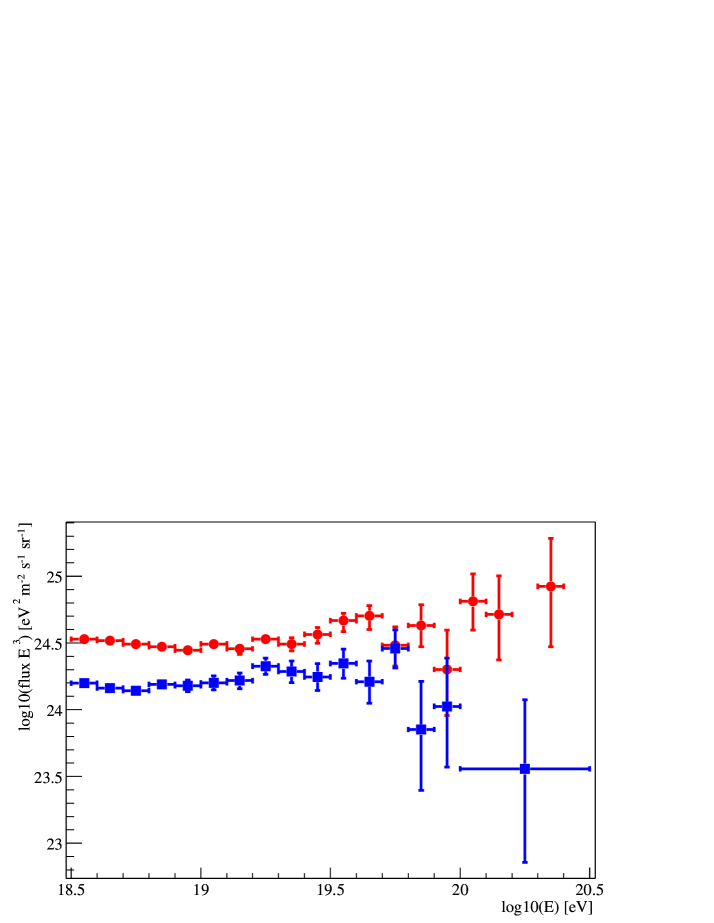
The figure shows that the HiResI data are systematically below AGASA data and that HiResI sees a suppression at eV that resembles the GZK feature while AGASA does not. The number of events above eV, eV and eV for AGASA and HiResI are shown in Table LABEL:ehecr:tab:data_shifted We also show in the same table the number of events above the same energy thresholds, when a systematic energy decrease of 15% is applied to the AGASA data while a systematic energy increase of is applied to the HiResI data. These systematic energy shifts are within the reported uncertainties in energy measurements in both experiments. (See this proceedings for a discussion of energy errors in AGASA [8] and HiRes [9].)
| AGASA | HiResI | |||
|---|---|---|---|---|
| data | -15% | data | +15% | |
| 19 | 866 | 651 | 300 | 367 |
| 19.6 | 72 | 48 | 27 | 39 |
| 20 | 11 | 7 | 1 | 2.2 |
In order to understand the difference between AGASA and HiRes data, we first determine the best fit injection spectrum for each data set separately by running 400 simulations of extragalactic proton propagation normalizing to the data column in Table LABEL:ehecr:tab:data_shifted The injection spectrum is taken to be a power law with index between 2.3 and 2.9 with steps of 0.1. For each injection spectrum we calculated the indicator (averaged over 400 realizations for each injection spectrum). The errors used for the evaluation of the are due to the square roots of the number of observed events. As reported in Table LABEL:ehecr:tab:chiq, the best fit injection spectrum can change appreciably depending on the minimum energy above which the fit is calculated. In these tables we give , where is the number of degrees of freedom, while the subscript, , is the logarithm of (in eV), the energy above which the fit has been calculated. The numbers in bold-face correspond to the best fit injection spectrum. These fits are dominated by the low energy data rather than by the poorer statistics at the higher energies.
| AGASA | HiResI | |||||
|---|---|---|---|---|---|---|
| 2.3 | 1694 | 34 | 17 | 145 | 29 | 23 |
| 2.4 | 1215 | 24 | 12 | 80 | 19 | 15 |
| 2.5 | 724 | 19 | 10 | 36 | 14 | 11 |
| 2.6 | 248 | 16 | 10 | 14 | 9 | 7 |
| 2.7 | 82 | 17 | 11 | 33 | 7 | 5 |
| 2.8 | 80 | 21 | 13 | 126 | 7 | 4 |
| 2.9 | 316 | 27 | 15 | 257 | 9 | 4 |
For energies above eV, the best fit spectra are for AGASA and for HiRes. If the data at energies above eV are used for the fit, the best fit injection spectrum is for AGASA and between and for HiRes. If the fit is carried out on the highest energy data ( eV), AGASA requires an injection spectrum between and , while or fits the HiRes data in the same energy region. Note that the two sets of data uncorrected for any possible systematic errors require different injection spectra that change with .
In order to quantify the significance of the detection or lack of the GZK flux suppression, in Tables LABEL:ehecr:tab:discrepanza_agasa and LABEL:ehecr:tab:discrepanza_hires we report the expected (namely simulated) number of events above the energy threshold indicated for different injection specta and the discrepancy between the simulations and the data in Table LABEL:ehecr:tab:data_shifted (in parenthesis) in numbers of standard deviations, , after comparison with the data. From Tables LABEL:ehecr:tab:discrepanza_agasa and LABEL:ehecr:tab:discrepanza_hires we can see that while HiResI is consistent with the existence of the GZK feature in the spectrum of UHECRs, AGASA fails to detect the same feature, but only at the level for the best fit injection spectra.
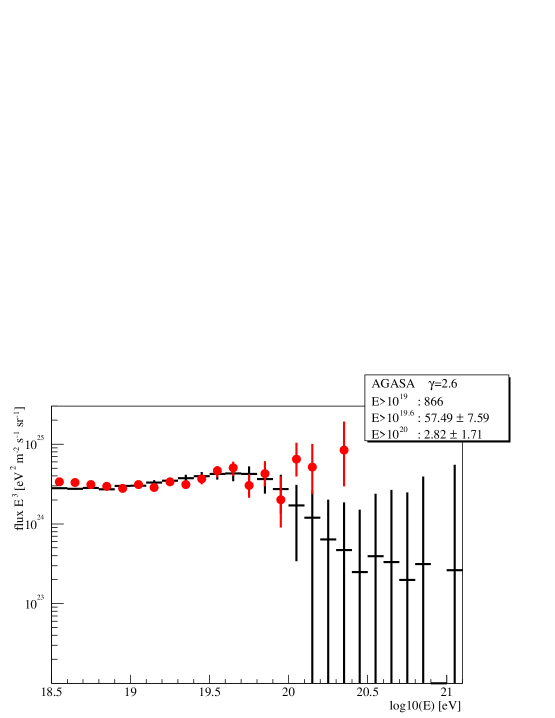
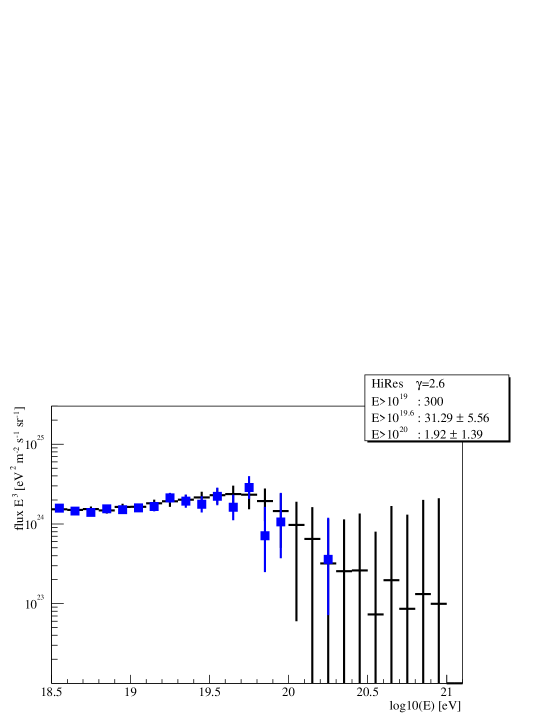
In Figs. LABEL:ehecr:fig:agasa_2627 and LABEL:ehecr:fig:hires_2528 we show the uncertainties in the predicted fluxes for AGASA and HiRes respectively, for a injection spectrum with spectral index 2.6. These plots show clearly the low level of significance that the detections above have with low statistics. The large error bars that are generated by our simulations at the high energy end of the spectrum are mainly due to the stochastic nature of the process of photo-pion production: in some realizations some energy bins are populated by a few events, while in others the few particles in the same energy bin do not produce a pion and get to the observer unaffected. The large fluctuations are unavoidable with the extremely small statistics available with present experiments. On the other hand, the error bars at lower energies are minuscule, so that the two data sets (AGASA and HiResI) cannot be considered to be two different realizations of the same phenomenon. The discrepancies at the lower energy range must be due to systematic errors in at least one if not both experiments.
Taking into account the (theoretical) error bars determined by the simulations, we report in Tables LABEL:ehecr:tab:discrepanza_agasa and LABEL:ehecr:tab:discrepanza_hires the standard deviations due to the low statistics (). The observed number of events above the same threshold also has a observational error bar associated with that enregy range. The combined error can be estimated by . We show in Tables LABEL:ehecr:tab:discrepanza_agasa for AGASA and LABEL:ehecr:tab:discrepanza_hires for HiRes the standard deviations in the simulations () in parenthesis and the standard deviation with the combined error in units of in square brackets. The effective discrepancy between predictions and the AGASA data is at the level of . A definitive answer to the question of whether the GZK feature is there or not awaits a significant improvement in statistics at high energies.
As seen in Fig. LABEL:ehecr:fig:agasahires, the difference between the AGASA and HiResI spectra is not only in the presence or absence of the GZK feature: the two spectra, when multiplied by , are systematically shifted by about a factor of two. This shift suggests that there may be a systematic errors either in the energy or the flux determination of at least one of the two experiments. Possible systematic effects are discussed in [8] and [10] for the AGASA collaboration and in [9] and [7] for HiResI. At the lower end of the energy range the offset may be due to the notoriously difficult determination of the AGASA aperture at threshold while the discrepancies at the highest energies is unclear at the moment. In any case, a systematic error of in the energy determination is well within the limits of systematic errors reported by both collaborations.
In order to illustrate the difficulty in determining the existence of the GZK feature in the observed data in the presence of systematic errors, we split the energy gap by assuming that the energies as determined by the AGASA collaboration are overestimated by , while the HiRes energies are underestimated by the same amount. The number of events above an energy threshold is again reported in Table LABEL:ehecr:tab:data_shifted. The values of obtained in this case are reported in Table LABEL:ehecr:tab:chiq_shift.
| AGASA | HiResI | |||||
|---|---|---|---|---|---|---|
| 2.3 | 505 | 18 | 12 | 79 | 13 | 7 |
| 2.4 | 351 | 13 | 8.5 | 40 | 7 | 4 |
| 2.5 | 188 | 9 | 5.6 | 13 | 3.7 | 2.0 |
| 2.6 | 54 | 9 | 5.6 | 6 | 2.0 | 1.1 |
| 2.7 | 20 | 11 | 6.4 | 23 | 3.1 | 1.4 |
| 2.8 | 54 | 15 | 7.2 | 94 | 6 | 2.4 |
| 2.9 | 145 | 20 | 9.1 | 176 | 10 | 4 |
For AGASA, the best fit injection spectrum is now between and above eV and above eV (the values are identical). For the HiRes data, the best fit injection spectrum is for the whole set of data, independent of the threshold. It is interesting to note that the best fit injection spectrum appears much more stable after the correction of the systematics has been carried out. Moreover, the best fit injection spectra as derived for each experiment independently coincides for the corrected data unlike the uncorrected case. This suggests that combined systematic errors in the energy determination at the 30% level may in fact be present.
The expected numbers of events with energy above eV and above eV with the deviation from the data are reported in Tables LABEL:ehecr:tab:discrepanza_agasa085 and LABEL:ehecr:tab:discrepanza_hires115: while HiResI data remain in agreement with the prediction of a GZK feature, the AGASA data seem to depart from such prediction but only at the level of . The systematics in the energy determination further decreased the significance of the GZK feature, such that the AGASA and HiResI data are in fact only less than away from each other.
We can use the same procedure illustrated above to evaluate the effect of the error bars in the simulated data compared to the data corrected by 15%. The results are reported in square brackets in Tables LABEL:ehecr:tab:discrepanza_agasa085 (for AGASA) and LABEL:ehecr:tab:discrepanza_hires115 (for HiRes), showing that the effective discrepancy between expectations (with uncertainties due to discrete energy losses and cosmic variance) and AGASA data is even smaller, only at the level.
3. Conclusions
The statistical significance of the UHECR spectra measured by the two largest experiments in operation, AGASA and HiRes, is not sufficient to determine the nature and origin of these particles. The discrepancies between the two experiments is below 2.6 , but AGASA sees hints of a flux above the predicted GZK suppression and hints of point sources in arrival direction distribution while HiRes sees hints of the GZK feature. If confirmed by future experiments with much larger statistics, the increase in flux relative the GZK prediction hinted by AGASA would be of great interest. This may signal the presence of a new component at the highest energies that compensates for the expected suppression due to photo-pion production, or the effect of new physics in particle interactions.
Identifying the cause of the systematic energy and/or flux shift between the AGASA and the HiRes spectra is crucial for understanding the nature of UHECRs. This discrepancy has stimulated a number of efforts to search for the source of these systematic errors including the construction of hybrid detectors, such as Auger, that utilize both ground arrays and fluorescence detectors. If systematic errors of about 15% are present in both experiments the two spectra can be shifted into agreement with a best fit injection spectrum of with .
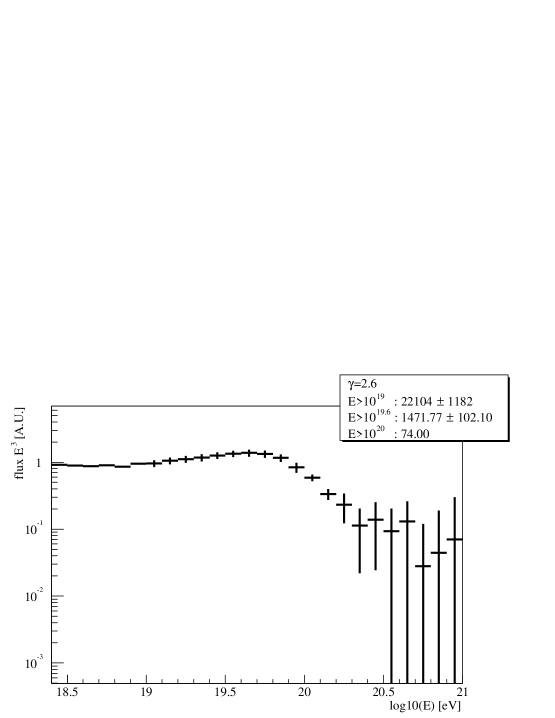
With the low statistical significance of the possible discrepancy between AGASA and the expected fluxes (or the HiResI data), it is inaccurate to claim either the detection of the GZK feature or the extension of the UHECR spectrum beyond at this point in time. A new generation of experiments is needed in order to finally give the proper answer to this question. In Fig. LABEL:ehecr:fig:newgen we report the simulated spectra that should be achieved in 3 years of operation of Auger (upper panel) and EUSO (lower panel). The error bars reflect the fluctuations about the mean spectrum with an injection spectrum . The energy region where statistical fluctuations dominate the spectrum is moved to eV for Auger [11], allowing a clear identification of the GZK feature. This fluctuations dominated region stands beyond eV for EUSO [12].

Acknowledgements
We thank the organizers of the International workshop on Extremely High Energy Cosmic Rays for a great workshop and hospitality. This work was supported in part by the NSF through grant AST-0071235 and DOE grant DE-FG0291-ER40606 at the University of Chicago.
Bibliography
- [1] K. Greisen, Phys. Rev. Lett. 16 (1966) 748
- [2] G. T. Zatsepin and V. A. Kuzmin, Sov. Phys. JETP Lett. 4 (1966) 78
- [3] V. S. Berezinsky, S.V. Bulanov, V. A. Dogiel, V. L. Ginzburg, and V. S. Ptuskin, Astrophysics of Cosmic Rays, (Amsterdam: North Holland, 1990); V.S. Berezinsky, P.Blasi and A. Vilenkin, 58 (1998) 103515; P. Bhattacharjee and G. Sigl, Phys. Rept. 327 (2000) 109; A. Olinto, Phys. Rep. 333 (2000) 329; A.A. Watson, Phys. Rep., 333 (2000) 309
- [4] D. DeMarco, P. Blasi, and A. V. Olinto, Astropart. Physics (2003).
- [5] M. Blanton, P. Blasi and A. V. Olinto, Astropart. Phys. 15 (2001) 275
- [6] M. Takeda et al., Phys. Rev. Lett. 81 (1998) 1163; M. Takeda et al. preprint astro-ph/9902239 N. Hayashida et al. Phys. Rev. Lett. 73 (1994) 3491.
- [7] T. Abu-Zayyad, et al., preprint astro-ph/0208243
- [8] N. Nagano, in this proceedings.
- [9] K. Martins, in this proceedings.
- [10] M. Takeda et al., preprint astro-ph/0209422
- [11] J. W. Cronin, Proceedings of ICRC 2001 (2001).
- [12] see http://www.euso-mission.org