A Rapid Microlensing Event in the Q0957+561 A,B Gravitational Lens System
Abstract
We re-analyze brightness data sampled intensively over 5 nights at two epochs separated by the quasar lens time delay, to examine the nature of the observed microlensing. We find strong evidence for a microlensing event with an amplitude of 1% and a time scale of twelve hours. The existence of such rapid microlensing, albeit at low amplitude, imposes constraints on the nature of the quasar and of the baryonic dark matter.
1 Introduction
The claimed existence of rapid microlensing in the Q0957+561 A,B gravitational lens system has continued to challenge astrophysics. Observationally, the low amplitude of the effect, measured to be approximately only 0.01 magnitudes on a timescale of days (Schild 1999, Table 3; Schild & Thomson 1993) requires careful photometry for detection and study of the effect. Theoretically, such rapid microlensing is not accommodated by existing models with accretion discs having dimensions of approximately (Schmidt & Wambsganss 1999, Refsdal et al. 2000) although the new double-ring model of Schild and Vakulik (2003) offers such rapid microlensing as a possibility provided the baryonic dark matter is a network of planetary mass objects. Alternatives such as orbiting dark clouds (Schechter et al. 2003; Wyithe & Loeb 2003) or bright points (Gould & Miralde-Escude 1997) in the accretion disc have not been advanced with detailed models or simulations because they would produce strong periodic effects not observed and because they do not produce the equal positive and negative events found in the data (Schild 1999).
Because such rapid microlensing, albeit at low amplitude, imposes such severe constraints on models of the quasar and the baryonic matter distribution in the halo of the lens galaxy G1, a determined effort to confirm it with a sustained surveillance of the system for a 10-day campaign by observatories circling the globe has been undertaken (Colley et al. 2002, 2003). Unfortunately the system was relatively quiescent during the campaign period, and no convincing microlensing event was detected, although a significantly improved time delay value of 417.07 days was measured. The campaign also demonstrated convincingly that precise brightness measurements could be made for the system with available photometric techniques. This conclusion has also been confirmed by other authors (Colley & Schild, 1999; Ovaldsen 2002; Ovaldsen et al. 2003). Other photometries have been undertaken, but have lacked the precision or intensive time sampling to detect the microlensing (Gil-Merino et al. 2001; Schmidt and Wambsganss, 1998)
The purpose of the present report is to present evidence for a significant microlensing effect in published data (Colley & Schild 1999). The data were previously analyzed for time delay, but because data for a single observatory can only cover a fraction of a day and produce systematic effects known to bias the delay calculation, full analysis of the data required an independent time delay determination; it was this dataset that spawned the ’round-the-clock monitoring program mentioned previously. With the improved time delay value now available, we return to the earlier data set and find evidence for a microlensing event having a time scale of half a day and an amplitude of 0.01 magnitudes (one percent).
2 Return to a High Precision Data Set
In an earlier report, Colley & Schild (1999) showed reductions of all-night Q0957 brightness monitoring with the 1.2m Mt Hopkins reflector, for datasets taken at two epochs (December 1994 and February 1996) separated by the quasar time delay of 417 days. Possible systematic errors in the photometric procedure have been exhaustively discussed in Colley & Schild (1998, 1999) who found that the statistical errors of photometric detection dominated over the extremely small systematic errors. This has been confirmed in our monitoring program and reduction of CCD photometry from 12 observatories (Colley et al. 2002, 2003). In the discussion of the data from Colley & Schild (1999) to follow, we adopt error estimates from the original report.
Colley & Schild (1999) measured a time-delay of days from the 1994 and 1996 datasets alone; in their Fig. 7 they applied that delay to the image B record and overlayed it on top of the image A record to produce a combined brightness record that exhibited nearly continuous fluctuations with an amplitude of order 30 mmag over the 6 day observation window. However, on night , an apparently significant discrepancy was noted, which would imply microlensing on a time scale of approximately a day. This did not spawn a detailed statistical treatment as important a discovery as it might be, because the known systematic effects in the time delay determination could too easily be responsible in some unknowable way. It did, however, spawn the 10-night QuOC-Around-The Clock monitoring campaign which did not find comparable events but did produce an unbiased value of the time delay and also produced confidence in the ability to convert astronomical CCD images into photometry with accuracy sufficient to define the photometric behavior to the required precision.
We show in Fig. 1 a new plot of the same data for our improved 417.07 time delay value. For such a nearly integral time delay, the data now overlap sufficiently to allow a firm microlensing conclusion. We consider that the data for show a compelling disagreement between the first arriving A image brightness and the second arriving B brightness. Note that for no time delay value near 417 days would the data be in agreement, and only for time delays near 417.5 days would there be a problem because of course the data then do not actually overlap, but even in this case a probable microlensing would be implied.
In re-plotting the Fig. 1 data for the new time delay, we have again used the PRH method (Press et al. 1991) but with a small caveat. Because the data set indicate the significant microlensing event as already noted, we have excluded the data for night 2449706 in determining the optimum brightness offset between the two images. In other words, for observing dates fixed by the measured time delay, we use the data for the first four nights only, to determine the magnitude difference that minimizes the difference of the two brightness records. A much more detailed statistical treatment follows in the next section.
3 The profile of an observed microlensing event
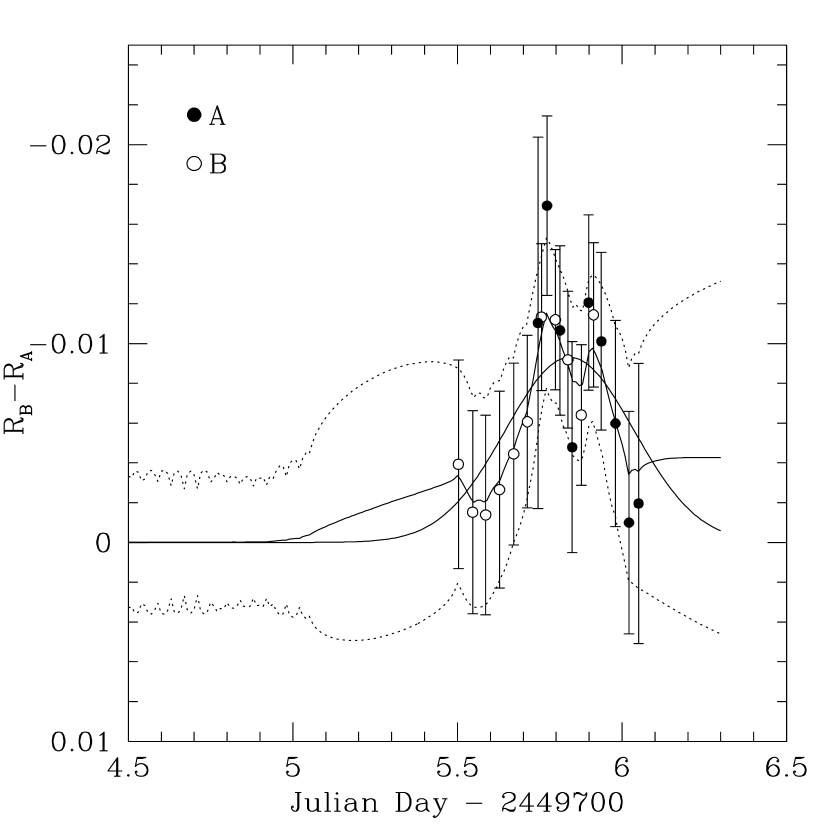
In Fig. 1 (bottom) we adopt standard precepts and determine the microlensing profile by subtracting from the 1994.9 A image brightness the 1996.1 B image brightness, using the PRH method to define the acceptable 1-sigma allowed brightness interval from the observed brightness and the measured structure function. In this way we are able to determine the outer limits to allowed brightness to be compared with the measured brightness of the other image. Thus in Fig. 1 (bottom) we show the time delay corrected brightness difference which is interpreted as a microlensing signal. Whether the event is a brightening of image B or dimming of image A is debatable. Perhaps it is slightly more conservative to guess that image A has become fainter, which would allow image B to remain fairly constant between nights 4.5 and 5.5 without invoking a cancelling QSO fluctuation and microlensing event.
In this illustration we see that the measured brightness differences is significantly greater than that permitted by the errorbars and a no-microlensing hypothesis—all data points exceed the permitted error limits significantly. Moreover, the brightness departures are in the expected form of an “event” where the microlensing causes first a nearly monotonic decrease in the image A brightness (or increase in the image B brightness), and then an increase (or decrease in B) back into agreement with the other image. The amplitude and duration of the event were approximately one percent in half a day.
We show in Fig. 2 a close-up of the event with a fiducial Gaussian curve fitted to the event. The Gaussian fit has an amplitude of 0.93% (0.0093 mag) and a FWHM of 0.46 days. We have overplotted points which reflect the differences between the image A and B -magnitudes, using the PRH snake as an interpolation method, so the filled symbols are , and the open symbols are . Each errorbar reflects the intrinsic photometric error of the un-interpolated quantity, added in quadrature to the error reported from the PRH method for the interpolated quantity. There are 20 points in all, (11 B points and 9 A points), and they have a combined relative to the zero-line of 80.4 (for 20 d.o.f), inconsistent with the zero-line at 3 parts in a billion. Looking only at the 12 points where there is direct overlap of data (), the value (for 12 d.o.f.) relative to the zero-line is 77.0, inconsistent with the zero-line at 1 part in a billion. So, most of the significance lies in points which directly overlap. For the simple Gaussian curve fit to the points, those values decrease to 9.2 and 7.4 for all points, and overlapping points, respectively.
We may further test the significance of the event by testing whether or not removing the last night was really more sensible than, for instance, removing any of the other nights. We carry this out by computing the PRH- (with optimum magnitude offset for image B), leaving each of the 5 nights in turn. The PRH- for the whole data set is 94.8 for 94 degrees of freedom (d.o.f). Leaving out nights {1, 2, 3, 4, 5} yields values of {72.0, 80.3, 76.8, 78.3, 64.5}, with d.o.f. {75, 79, 74, 74, 74}. One way to look at this by considering the change in the of the fit relative to the change in d.o.f., . That statistic for each night is = {1.20, 0.965, 0.903, 0.826, 1.52}. The last night’s value is the highest of all, showing greater significance for removing the last night than removing any of the other nights. The -test significances of leaving out each night, relative to leaving out none are {58.5%, 48.2%, 44.6%, 41.1%, 74.3%}. Removing any of the first four nights yields very little improvement or actually some degradation in the quality of the fit, but removing the last night significantly improves the fit.
4 Conclusion and Discussion
Previously published data have been combined with our new Q0957 time delay value (Colley et al. 2003) to uncover an important rapid microlensing event. Previously this topic has been mired in a logical conundrum; because rapid microlensing is observed, it is extremely difficult to determine an accurate time delay, but an accurate time delay is needed to obtain convincing microlensing evidence. This conundrum has now been broken with the Colley et al. (2003) intensive monitoring campaign, which has sufficiently low microlensing to produce a credible time delay with sub-day precision.
We have found convincing evidence for a low amplitude (1 percent) rapid event with half-day duration. We provide an analytical approximation for this event, with the view that this profile might be useful for other analyses of the rapid microlensing. Note that Schild (1999) had previously shown from wavelet analysis that brightness fluctuations in both images of the Q0957 system have characteristic amplitudes of a percent on time scales of a day or two. That analysis did not prove that such events were predominantly microlensing; the present data suggest that the Q0957 system shows both microlensing and intrinsic quasar brightness fluctuations of 1% amplitude on day time scales.
The existence of both the rapid quasar fluctuations and the rapid microlensing fluctuations are challenging to astrophysics. For such intrinsic quasar brightness fluctuations to exist, the quasar should have structure on scales of half a light day (), whereas accretion disc sizes estimated for this quasar have been (6 – 10) (Refsdal et al. 2000), and Schmidt and Wambsganss (1999) have ruled out sizes smaller than if the baryonic dark matter has planetary mass. The diameter of the innermost stable orbit for an accretion disc around a black hole has been given by Colley et al. (2003) as , or approximately 3 light days. Converting all the diameter measurements to light days, and noting that the observed times should all be increased by a () factor of 2.4 to allow for the cosmological redshift, we conclude that quasar structure modeled as a simple accretion disc cannot easily accommodate the rapid brightness fluctuations observed.
If rapid microlensing fluctuations such as this one are common, as suggested by Schild & Thomson (1993), they place strong constraints on lensing models, because not only must the quasar structure be smaller than implied in the models above, but also, the microlensing cusp pattern must be sufficiently fine to produce such rapid events. Attempts to explain rapid fluctuations with (only) stellar mass deflectors in the lens galaxy include QSO models with orbital bright blobs (Gould and Miralde-Escude, 1997) or dark clouds (Schechter et al. 2002, Wyithe & Loeb 2002), but fail because strong periodicity, and asymmetrical profiles with preponderantly positive (brightening) or negative profiles would result. However a double-ring model of quasar structure advanced by Schild and Vakulik (2003) has been demonstrated which can produce rapid microlensing fluctuations without orbiting structures. The simulations available with microlensing by a star and 90% baryonic dark matter objects of planetary mass produces microlensing events of 10-day duration. Reducing the dark matter population in the simulation from to and sharpening the inner ring structure of the model would probably produce events of the duration observed.
We conclude that the detection of a rapid, low amplitude microlensing event in the Q0957 dataset implies strong constraints on the nature of the quasar’s structure, and on the nature of the baryonic dark matter. Because of the high optical depth of the Q0957 quasar to microlensing, exceeding one, study of low amplitude microlensing fluctuations promises to impose severe constraints on quasar structure and the nature of the baryonic dark matter.
References
- (1)
- (2) Colley, W. & Schild, R. 1999, ApJ, 518, 153
- (3)
- (4) Colley, W. N. et al., 2002, ApJ, 565, 105
- (5)
- (6) Colley, W.N., et al., 2003, ApJ, 587, in press
- (7)
- (8) Gil-Merino, R. et al., 2001, MNRAS, 322, 397
- (9)
- (10) Gould, A. & Escude-Miralde, J., 1997, ApJ, 483, L13
- (11)
- (12) Ovaldsen, J.E., 2002, Master’s Thesis, Institute of Theoretical Astrophysics, University of Oslo, Norway
- (13)
- (14) Ovaldsen, J., et al., 2003, A&A, accepted for publication
- (15)
- (16) Press, W. H., Rybicki, G. B., & Hewitt, J. N. 1992b, ApJ, 385, 404
- (17)
- (18) Refsdal, S., et al., 2000, A&A, 360, 10
- (19)
- (20) Schechter et al., 2002, astro-ph/0206263
- (21)
- (22) Schild, R. E. 1999, ApJ, 514, 598
- (23)
- (24) Schild, R. E. 1996, ApJ, 464, 125
- (25)
- (26) Schild, R. E., & Cholfin, B. 1986, ApJ, 300, 209
- (27)
- (28) Schild, R. E., & Thomson, D. J. 1993, in Gravitational Lenses in the Universe - Proceedings of the 31’st Liege International Astrophysics Colloquium, ed J. Surdej et al. [Liege: Universite de Liege], p. 415
- (29)
- (30) Schmidt, R., & Wambsganss, J. 1999, A&A, 335, 379
- (31)
- (32) Wyithe, S. & Loeb, A., 2002, astro-ph/0204529
- (33)