theDOIsuffix \Volume324 \IssueS1 \CopyrightissueS1 \Month01 \Year2003 \pagespan3 \Receiveddate15 November 2002 \Reviseddate30 November 2002 \Accepteddate2 December 2002 \Dateposted3 December 2002
Full Three Dimensional Orbits For Multiple Stars on Close Approaches to the Central Supermassive Black Hole
Abstract.
With the advent of adaptive optics on the W. M. Keck 10m telescope, two significant steps forward have been taken in building the case for a supermassive black hole at the center of the Milky Way and understanding the black hole’s effect on its environment. Using adaptive optics and speckle imaging to study the motions of stars in the plane of sky with 2 mas precision over the past 7 years, we have obtained the first simultaneous orbital solution for multiple stars. Among the included stars, three are newly identified (S0-16, S0-19, S0-20). The most dramatic orbit is that of the newly identified star S0-16, which passed a mere 60 AU from the central dark mass at a velocity of 9,000 km/s in 1999. The orbital analysis results in a new central dark mass estimate of . This dramatically strengthens the case for a black hole at the center of our Galaxy, by confining the dark matter to within a radius of 0.0003 pc or 1,000 Rsh and thereby increasing the inferred dark mass density by four orders of magnitude compared to earlier estimates.
With the introduction of an adaptive-optics-fed spectrometer, we have obtained the first detection of spectral absorption lines in one of the high-velocity stars, S0-2, one month after its closest approach to the Galaxy’s central supermassive black hole. Both Br (2.1661 m) and He I (2.1126 m) are seen in absorption with equivalent widths and an inferred stellar rotational velocity that are consistent with that of an O8-B0 dwarf, which suggests that S0-2 is a massive (15 ), young (10 Myr) main sequence star. Similarly, the lack of CO detected in our first AO spectra suggest that several other of the high-velocity stars are also young. This presents a major challenge to star formation theories, given the strong tidal forces that prevail over all distances reached by these stars in their current orbits and the difficulty in migrating these stars inward during their lifetime from further out where tidal forces should no longer preclude star formation.
keywords:
Black hole, Orbits, Adaptive Optics, Proper Motions, Spectroscopypacs Mathematics Subject Classification:
04A251. Introduction
While the Milky Way was neither the first nor the most obvious place to search for a supermassive black hole, the case for one at the center of the Galaxy is quickly becoming the most iron clad. The first hint of a central concentration of dark matter came from radial velocity measurements of ionized gas located in a three-armed structure known as the mini-spiral, which extends from the center out to about 1-2 pc (Lacy et al. 1980). Concerns that the gases’ motion are not tracing the gravitational potential were quickly allayed by radial velocity measurements of stars, which are not susceptible to non-gravitational forces (McGinn et al. 1989; Haller et al. 1996; Genzel et al. 1997). These early dynamical measurements of the gas and stars suggested the presence of of dark matter and confined it to within a radius of 0.1 pc; the implied dark matter density was not sufficiently high to definitively claim this as evidence for a single supermassive black hole, since the measurements only imposed a lifetime for clusters of dark objects of , which is not significantly shorter than the age of the Galaxy (Maoz et al. 1998). To make further progress in understanding the underlying source of dark matter at the center of the Galaxy, it was necessary to use techniques that compensated for the distorting effects of the Earth’s atmosphere, which had restricted the earlier studies of the dark matter distribution to radii of 0.1 pc or larger.
In the early- to mid-1990’s, two independent groups initiated 2 high spatial resolution imaging studies of the central stellar cluster to measure the motions of stars in the plane of the sky. While the ESO team began their program using speckle imaging at the 3.6 m NTT and this year have moved to the adaptive optics system on the 8 m VLT, the Keck team initiated their program using speckle imaging on the 10 m Keck I telescope and began using adaptive optics on the 10 m Keck II telescope in 1999. The first phase of these experiments yielded proper motion velocities, which increased the implied dark matter density by 3 orders of magnitude to (Eckart & Genzel 1997; Ghez et al. 1998). This eliminated a cluster of dark objects, such as neutron stars or stellar mass black holes, as a possible explanation of the Galaxy’s central dark mass concentration (Maoz et al. 1998) and left only the fermion ball hypothesis (e.g., Tsiklauri & Viollier 1998, Munyaneza & Viollier 2002) as an alternative to a single supermassive black hole. The velocity dispersion measurements also localized the dark matter to 100 mas (4 milli-pc) at a position consistent with the nominal location of the unusual radio source Sgr A* (Ghez et al. 1998), whose emission is posited to arise from accretion onto a central supermassive black hole (e.g., Lo et al. 1985). The proper motion experiments proceeded to strengthen both the case for a supermassive black hole and its association with Sgr A* with the detection of acceleration for three stars - S0-1, S0-2, and S0-4, which increased the dark matter density to and positional accuracy to 30 mas (Ghez et al. 2000; Eckart et al. 2002). These experiments also revealed that the orbital periods for S0-2 and S0-1 could be as short as 15 and 35 years, respectively, which would open a new arena for dynamical studies of the central stellar cluster.
This paper summarizes the recent progress that has been made in this field on two fronts with the W. M. Keck telescope. The first, with approximately a decade of proper motion measurements, is the derivation of complete 3-dimensional orbits for multiple stars that are making close approaches to the supermassive black hole at the center of the Milky Way Galaxy. The second is the measurement of spectral lines in one of these high velocity stars. These two steps forward make the strongest case yet for the presence of a supermassive black hole at the center of the Galaxy and, for the first time, allow us to take an in-depth look at the question of where these stars formed.
2. Observations & Results
2.1. Proper Motions
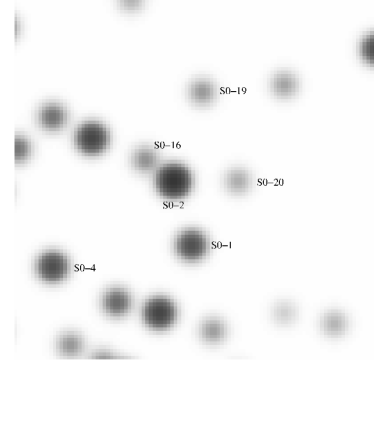
Beginning in 1995, K[2.2 ]-band diffraction-limited images have been obtained with the W. M. Keck I 10 m telescope to achieve an angular resolution of 50 milli-arcsec and a positional accuracy of 2 milli-arcsec on stars located in the central 55′′ of our Galaxy. Since our original reporting of stars in this region (Ghez et al. 1998), the sensitivity to high-velocity stars has been significantly improved. Two primary factors contribute to the increased number of recognized stars in this region. First, the original approach was conservative in an effort to avoid falsely identifying high velocity stars on the basis of the three maps separated by a full year. With multiple observations each year beginning in 1998, it was clear that many real sources were not being identified, leading to a decrease in the threshold used to identify sources. Second, in 1998 it became possible to calibrate the alignment of the Keck telescope’s mirror segments on NIRC, the Keck I facility infrared camera, allowing the telescope to be calibrated during the observing run at the elevation of the Galactic Center, thereby significantly improving the image quality of our speckle maps. Figure 1 shows the three new proper motion stars (S0-16, S0-19, S0-20) and the one original proper motion star (S0-1, S0-2, S0-4) whose motions can now be modeled with Keplerian orbits.
Of particular note among the new sources (those with a label larger than 15) is S0-19. Its high proper motion has caused it to be misidentified in earlier papers. While it was detected by us in 1995 as a K=14.0 source, two possible counterparts were identified in 1996. With limited time coverage, it was not possible to definitively identify either as the correct counterpart and it was not included in the proper motion sample (see discussion in Ghez et al. 1998). The same source was reported as S3 (K=15) moving Westward by Eckart & Genzel (1997) and Genzel et al. (2000). Genzel et al. (1997) report the detection of a new source, S12 (K15), in their 1996.43, located 0.′′1 of a source labeled S3 and proposed it as the best candidate for the infrared counterpart of the compact radio source Sgr A*. This has been used in several recent papers to constrain models of Sgr A*’s flared state (e.g., Narayan et al. 2002). In our analysis, it is now clear that S12 is simply a high velocity star that was coincident with Sgr A* in 1996. It is labeled S0-19 in this paper and it should be associated with the 1992-1995 detection of S3. The discrepancy in magnitudes arises from the difficulties of carrying out accurate photometry in such a crowded region. This source illustrates the challenges associated with making a definitive detection of infrared emission associated with Sgr A*, given the high stellar densities and velocities and modest stellar intensity variations in this region.

2.2. Spectral Lines
In 2002, the high proper motion star, S0-2, was observed with NIRC2, the facility near-infrared adaptive optics instrument (Matthews et al. 2003) in a mode that achieved a spectral resolution of R4000 (75 km/s). The resulting spectrum of S0-2, shown in Figure 2, has two identifiable spectral lines. These are both seen in absorption and are identified as the H I (4-7) or Br line at 2.166 m and the He I triplet at 2.1126 m (), which is a blend of three transitions at 2.11274, 2.11267, and 2.11258 m. The detailed properties of these two lines, which are obtained by fitting the background continuum over the whole spectrum with a low-order polynomial and fitting the lines with a Gaussian profile are reported in Ghez et al. (2003a).

3. Discussion & Conclusions
3.1. Dynamics
The strong deviations from linear motions on the plane of the sky for stars within 0.2 of Sgr A* along with the radial velocity measurements for S0-2 provide new and powerful constraints on their orbital parameters, which are presented in Ghez et al. (2003a, b) and Ghez (2003). In the orbital fits, we assume that (1) the stellar masses are insignificant compared to a central point source, (2) the central point source has no significant velocity with respect to the Galaxy, which is supported by the lack of motion detected for Sgr A* by Reid et al. (1999) and Reid (2003), and (3) the central point source has a distance of 8.0 kpc (Reid 1993). This leaves the following 9 unknowns: Center of Attraction (, ), Period (P), Semi-Major Axis (A), Eccentricity (e), Time of periapse passage (To), Angle of nodes to periapse (), Angle of the line of nodes (), and Inclination ( i). We begin by fitting each star independently. Each of these stars has recently gone through periapse (1999 - 2002). In the most extreme case, S0-16 passed within a mere 60 AU of the central dark mass, while traveling at a velocity of 9,000 km/sec. The solution for S0-2 is consistent with that reported by Schödel et al. (2002) and, despite the two additional free parameters introduced by fitting for the center of attraction, the uncertainties on the orbital parameters are reduced by a factor of 2-3. Since the independent centers of attraction are consistent with one another, we proceed to fit the orbital motion for all the stars simultaneously with a common center of attraction. This first orbital estimate of the Galaxy’s dynamical center is not only consistent with the nominal infrared position of Sgr A* to within the uncertainties on the latter (Reid et al. 2003), but is also a factor of 7 more precise ( 1.5 milli-arcsec). Furthermore, the agreement between the masses inferred from the simultaneous Keplerian orbit fits for multiple stars (see Figure 3 and Table 1) suggests that the central dark mass potential is well modeled by a point source with mass , consistent at the 2 level with earlier estimates based on velocity dispersion measurements. These measurement increase the dark mass density by four orders of magnitude, ruling out Fermion balls as an alternative hypothesis for all supermassive black holes (Viollier 2003).

table Star Mass () S0-2 4.1 0.6 S0-16 3.0 0.7 S0-19 3.4 0.9 Average 3.6 0.4
For S0-2, the addition of radial velocity measurements also breaks the ambiguity in the inclination angle, i. With the proper motion data alone, only the absolute value of the inclination angle can be determined, leaving the questions of the direction of revolution and whether the star is located behind the black hole at periapse (closest approach) unresolved. Our radial velocity measurements indicate a negative inclination angle and consequently that S0-2 is both counter-revolving against the Galaxy and behind the black hole at the time of periapse. The improved location of the center of attraction from the orbital analysis results in a minimum offset of S0-2 from the black hole in the plane of the sky of 14 2 milli-arsec, which is significantly larger than the expected Einstein radius (RE = 0.42 milli-arcsec for an assumed distance behind the black hole of 100 AU) and therefore makes gravitational lensing a negligible effect (Wardle & Yusef-Zadeh 1992; Alexander & Loeb 2001).
In principle, the addition of radial velocities to the study of S0-2’s dynamics allows the distance to the Galactic Center, , to be a free parameter in the orbital fits (Salim & Gould 1999). The measurements, however, were obtained just 30 days after the star’s closest approach to the black hole when the radial velocity was changing very rapidly (see Figure 4). While the current radial velocity and proper motion data set constrains very effectively (15% uncertainty), it does not yet produce a meaningful measurement of . Nonetheless, as Figure 4 shows, the radial velocities from the currently allowed orbits quickly diverge, producing a spread of a few hundred km/s in one year. Within the next few years, the orbital fits based on both proper motions and additional radial velocity measurements should provide the most direct and precise estimate of the distance to the Galactic Center, making it a fundamental rung in the cosmic distance ladder.
[htb]
![[Uncaptioned image]](/html/astro-ph/0303151/assets/x5.png) \vchcaption
The measured radial velocity along with the predicted
radial velocities. The solid curve comes from the best fit orbit and the
dotted curves display the range for the orbital solutions
allowed with the present data sets. Adapted from Ghez et al. (2003a)
\vchcaption
The measured radial velocity along with the predicted
radial velocities. The solid curve comes from the best fit orbit and the
dotted curves display the range for the orbital solutions
allowed with the present data sets. Adapted from Ghez et al. (2003a)
3.2. Stellar Astrophysics
The detection of absorption lines in S0-2 allows us to sort out the spectral classification ambiguities present when only photometric information is available and to determine if this star’s photosphere has been altered as a result of its close proximity to the central black hole (Ghez et al. 2003a). The average brightness at 2.2 m for S0-2 is K 13.9 mag and there is no evidence of brightening after periapse passage (Ghez et al. 2003b). With a distance of 8.0 kpc and K-band extinction of 3.3 mag (Rieke, Rieke, & Paul 1989), the 2.2 m brightness of S0-2 implies that, if it is an ordinary star unaltered by its environment, it could either be an O9 main-sequence star or a K5 giant star; all supergiants are ruled out as they are too bright by at least 2 magnitudes in the K bandpass. Kleinmann and Hall (1986) provide a 2.0 - 2.5 m spectral atlas of late-type stars that demonstrates that if S0-2 is a K5 giant star, then it should have deep CO absorption lines, which definitively were not detected in either this experiment or our earlier experiment reported by Gezari et al. (2002). In contrast, the spectral atlas of 180 O and B stars constructed by Hanson, Conti and Rieke (1996) shows that an O9 main sequence star both lacks the CO absorption and has Br and He I (2.1126 m) consistent with the observed values. Furthermore, stars earlier than O8 in this comparison sample show NIII (2.115 m) in emission and He II (2.1885 m) in absorption above our 3 thresholds; the lack of photospheric He I (2.058 m) absorption does not provide any additional constraints. Similarly, dwarf B-type stars later than B0 have absorption-line equivalent widths that are too large. Together, the photometry and absorption line-equivalent widths permit dwarf spectral types ranging from O8 to B0. Likewise, the rotational velocity of 224 km/s is reasonable for this range (Gatheier, Lamers, & Snow 1981). S0-2, therefore, appears to have a spectral type, and hence effective temperature (30,000 K), as well as luminosity (103 ) that are consistent with a main sequence star having a mass of 15 and an age 10 Myr.
It is challenging to explain the presence of such a young star in close proximity to a supermassive black hole. Assuming that the black hole has not significantly affected S0-2’s appearance or evolution, S0-2 must be younger than 10 Myr and thus formed relatively recently. If it has not experienced significant orbital evolution, its apoapse distance of 1900 AU implies that star formation is possible in spite of the tremendous tidal forces presented by the black hole, which is highly unlikely. If the star formed at larger distances from the black hole and migrated inward, then the migration would have to be through a very efficient process. Current understanding of the distribution of stars, however, does not permit such efficient migration. This problem is similar to that raised by the He I emission-line stars (e.g., Sanders 1992,1998; Morris 1993, Morris et al. 1999; Gerhard 2001; Kim & Morris 2002), which are also counter-revolving against the Galaxy (Genzel et al. 1997), but amplifies it with a distance from the black hole that is an order of magnitude smaller. An alternative explanation for S0-2’s hot photosphere is that it may be significantly altered by its environment. While its periapse passage is too large for it to be tidally heated by the black hole as explored by Alexander & Morris (2003), it may be affected by the high stellar densities found in this region. On the one hand, the high stellar densities might allow S0-2 to be an older giant star that has had its outer atmosphere stripped through collisions; however, to generate the necessary luminosity, significant external heating is required (Alexander 1999). On the other hand, high stellar densities might lead an unlikely capture of a component in a massive binary star system (Gould & Quillen 2003) or a cascade of merger events (Lee 1996), which which would allow S0-2’s formation process to have begun more than 10 Myr ago. However a large number of collisions would have had to occur to provide the necessary lifetime to bring it in from sufficiently large radii. More exotically, it could be a ”reborn” star, which occurs as the product of a merger of a stellar remnant with a normal star. None of these possibilities is altogether satisfactory, leaving the Sgr A* cluster stars as a paradox of apparent youth in the vicinity of a supermassive black hole.
This work has been supported by the National Science Foundation through the individual grant AST99-88397 and the Science and Technology Center for Adaptive Optics, managed by the University of California at Santa Cruz under Cooperative Agreement No. AST - 9876783. The W.M. Keck Observatory is operated as a scientific partnership among the California Institute of Technology, the University of California and the National Aeronautics and Space Administration. The Observatory was made possible by the generous financial support of the W.M. Keck Foundation.
References
- [1] Alexander, T. 1999, ApJ, 527, 835
- [2] Alexander, T., & Loeb, A. 2001, ApJ, 551, 223
- [3] Alexander, T., & Morris, M. 2002, in prep
- [4] Eckart, A., & Genzel, R. 1997, MNRAS, 284, 576
- [5] Eckart, A., Genzel, R., Ott, T., & Schödel, R. 2002, MNRAS, 331, 917
- [6] Genzel, R., Eckart, A., Ott, T., & Eisenhauer, F. 1997, MNRAS, 291, 219
- [7] Genzel, R., Pichon, C., Eckart, A., Gerhard, O. E., Ott, T., 2000, MRAS, 317, 348
- [8] Gerhard, O. 2001, ApJ, 546, L39
- [9] Gezari, S., Ghez, A. M., Becklin, E. E., Larkin, J., McLean, I. S., Morris, M. 2002, ApJ, 576, 790
- [10] Ghez, A. M. 2003, Carnegie Observatories Astrophysics Series, Vol. 1: Coevolution of Black Holes and Galaxies, ed. L. C. Ho (Cambridge: Cambridge Univ. Press)
- [11] Ghez, A. M. et al. 2003a, ApJLett, in press (astro-ph/030229).
- [12] Ghez, A. M., Hornstein, S., Salim, S., Tanner, A., Morris, M., and Becklin, E. E. 2003b, in prep
- [13] Ghez, A. M., Klein, B. C., Morris, M., & Becklin, E. E. 1998, ApJ, 509, 678
- [14] Ghez, A. M., Morris, M., Becklin, E. E., Tanner, A., & Kremenek, T. 2000, Nature, 407, 349
- [15] Gould, A., & Quillen, A. 2003, ApJ, submitted (astro-ph/0302437)
- [16] Hanson, M. M., Conti, P. S., & Rieke, M. J. 1996, ApJS, 107, 281
- [17] Kim, S. S., & Morris, M. 2002, ApJ, in press
- [18] Kleinmann, S. G., & Hall, D. N. B 1986, ApJS, 62, 501
- [19] Lee, H. M., 1996, IAU 169, 215
- [20] Lo, K. Y., Backer, D. C., Ekers, R. D., Kellermann, K. I., Reid, M., & Moran, J. M. 1985, Nature, 315, 124
- [21] Maoz, E. 1998, ApJ, 494, 181L
- [22] Matthews, K. et al. 2003, PASP, in prep
- [23] Morris, M., 1993, ApJ, 408, 496
- [24] Morris, M., Ghez, A. M., Becklin, E. E. 1999, Adv. Spa. Res., 23, 959
- [25] Munyaneza, F., Viollier, R. D. 2002, ApJ, 564, 274.
- [26] Reid, M. J. 1993, ARA&A, 31, 345
- [27] Ried, M. J. 2003, this proceedings
- [28] Reid, M. J., Readhead, A. C. S., Vermeulen, R. C., Treuhaft, R. N. 1999, ApJ, 524, 816
- [29] Reid, M. J., Menten, K. M., Genzel, R., Ott, T., Schödel, R., & Eckart, A. 2003, ApJ, submitted
- [30] Rieke, G. H., Rieke, M. J., & Paul, A. E. 1989, ApJ, 336, 752
- [31] Salim, S., & Gould, A. 1999, ApJ, 523, 633
- [32] Sanders, R. H. 1992, Nature, 359, 131
- [33] Sanders, R. H. 1998, MNRAS, 294, 35
- [34] Schödel, R. et al. 2002, Nature, 419, 694
- [35] Tsiklauri, D., Viollier, R. D. 1998, ApJ, 500, 591
- [36] Wardle, M. & Yusef-Zadeh, F. 1992, ApJ, 387, L65.