The Physics of Supernova Blast Waves. I. Kinematics of DEM L 71 in the Large Magellanic Cloud
Abstract
We present the results from Fabry-Perot imaging spectroscopy of the Balmer-dominated supernova remnant DEM L 71 (050567.9 ) in the LMC. Spectra extracted from the entire circumference of the blast wave reveal the broad and narrow component H line emission characteristic of non-radiative shocks in partially neutral gas. The new spectra of DEM L 71 include portions of the rim that have not been previously observed. We find that the broad component width varies azimuthally along the edge of DEM L 71 , ranging from 45060 km s-1 along the eastern edge to values as high as 985 km s-1 along the faint western edge. The latter width is nearly 60% larger than the value determined by earlier spectroscopy of the brightest Balmer-dominated filaments. In part of the faint northern rim the broad component is not detected, possibly indicating a lower density in these regions and/or a broad component width in excess of 1000 km s-1 . Between the limits of zero and full electron-ion temperature equilibration at the shock front, the allowed range of shock velocities is 430560 km s-1 along the east rim and 7001250 km s-1 along other parts of the blast wave. The H broad-to-narrow flux ratios vary considerably around the remnant, ranging from 0.4 to 0.8. These ratios lie below the values predicted by our shock models. We find that narrow component H emission from a cosmic ray precursor may be the cause of the discrepancy. The least decelerated portions of the blast wave (i.e., regions excluding the brightest filaments) are well characterized by Sedov models with a kinetic energy = (0.370.06) , where is the LMC distance in units of 50 kpc. The corresponding age for DEM L 71 is (4360290) yr. This is the first time that velocity information from the entire blast wave has been utilized to study the global kinematics of a non-radiative SNR at a known distance.
Subject headings:
ISM: supernova remnants: individual (050567.9 , DEM L 71 )–ISM: kinematics and dynamics, shock waves1. INTRODUCTION
One distinctive property of non-radiative supernova remnants (SNRs) in partially neutral gas is the presence of optical line emission which allows us to trace the precise positions of their blast waves. The optical spectra of these SNRs (termed non-radiative because postshock cooling losses are negligible) are dominated by Balmer line emission, produced by collisional excitation when neutral hydrogen is overrun by the blast wave (Chevalier & Raymond 1978, Bychkov & Lebedev 1979). Each emission line consists of two components: (1) a narrow velocity component produced when cold, ambient H I overrun by the shock is excited by electron and proton collisions, and (2) a broad velocity component produced when fast neutrals created by postshock charge exchange are collisionally excited (Chevalier, Kirshner & Raymond 1980). Since the optical emission arises in a very thin (1016 cm) ionization zone, measuring the width of the broad Balmer line yields the proton temperature immediately behind the shock. The broad-to-narrow flux ratio, on the other hand, is sensitive to both the initial electron-ion temperature equilibration at the shock front and the neutral fraction of the preshock gas (Chevalier, Kirshner & Raymond 1980, Smith et al. 1991, hereafter SKBW91). Together, the broad-to-narrow ratio and broad component width are highly useful tools for estimating the shock velocity, degree of electron-ion equilibration and even the preshock neutral fraction in SNRs (SKBW91, Ghavamian 1999, Ghavamian et al. 2001; hereafter GRSH01, Ghavamian et al. 2002; hereafter GRHB00).
One of four known Balmer-dominated SNRs in the LMC, DEM L 71 was originally discovered as an unresolved X-ray source by Einstein (Long, Helfand & Grabelsky 1981). The remnant appears as a limb brightened shell, tear-drop shaped and approximately 1.4′ 1.2′ in size. Since its discovery, DEM L 71 has been studied in the optical via narrow band imagery (Tuohy et al. 1982) and low and high resolution longslit spectroscopy (SKBW91, Smith et al. 1994, hereafter SRL94). At X-ray energies, the remnant has been studied spectroscopically with ASCA SIS (Hughes, Hayashi & Koyama 1998; hereafter HHK98) and Chandra ACIS-S (Hughes et al. 2002, hereafter HGRS03; Rakowski et al. 2002, hereafter RGH03). In their analysis of the global X-ray spectrum, HHK98 assumed a Sedov dynamical evolution and applied self-consistent non-equilibrium ionization models to derive physical parameters for DEM L 71 and six other remnants in the LMC. They found that the Fe abundance in DEM L 71 was twice as high as that of the other remnants in the sample, leading them to conclude that DEM L 71 is the remnant of a Type Ia explosion. In a more recent Chandra analysis of spatially resolved ejecta material, HGRS03 again measured a highly elevated abundance of Fe and other Si-group elements, making an even stronger case for a Type Ia origin of DEM L 71 .
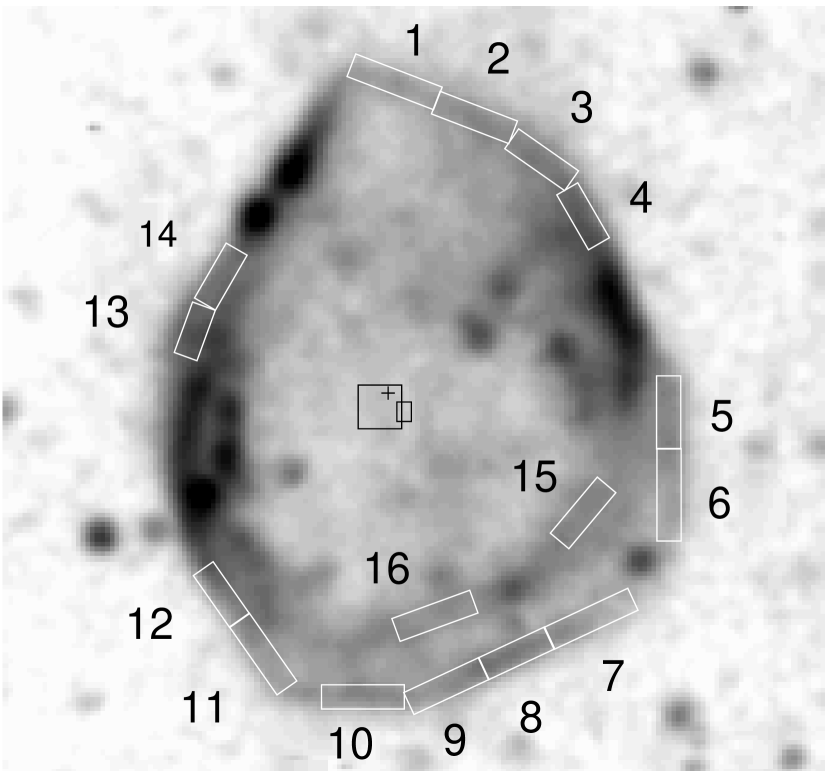
While X-ray analyses have allowed us to build a global picture of DEM L 71 , optical spectroscopy has thus far been limited to longslit observations passing through the bright east/west limbs of the SNR (see Figure 1). In these cases the slit was oriented east/west along the diameter of the remnant, resulting in detections of broad (600 km s-1 FWHM) and narrow H emission from the brightest optical filaments and some of the fainter emission between them (SKBW91, SRL94). However, both Tuohy et al. (1982) and SKBW91 noted that the broad and narrow H emission from the bright filaments was accompanied by moderate [S II], [N II] emission, a sign that the gas behind these shocks has begun to cool. In this case, since the narrow component H emission is produced both by collisional excitation at the shock front and recombination of the cooling gas, the broad-to-narrow ratios of the bright filaments cannot be used to infer the shock parameters.
Not all of the bright H in DEM L 71 is confined to filaments. Prominent, localized lumps of emission can also be seen in the interior. Three particularly bright patches around 5″in size are located 10″20″ inside the west rim. (Figure 1). These patches are also visible in narrow band [S II] images of DEM L 71 . At least half a dozen other lumps can also be seen scattered throughout the interior of DEM L 71 . Interestingly, a comparison of our narrowband H images with Chandra images of DEM L 71 reveals that the brightest of the interior patches have no X-ray counterparts (RGH03). The optical emission from these clouds may be produced by clumpy neutral gas which has been photoionized by He II 304 emission from the blast wave (GRHB00).
Given the difficulty of separating radiative from non-radiative shocks in prior optical spectra of DEM L 71 , we undertook a new spectroscopic study to investigate the more widely distributed optical emission around this remnant. While considerably fainter than the prominent E/W filaments, the fainter emission extends unbroken over a larger portion of the circumference and traces pure Balmer-dominated shocks, as evidenced by the lack of [S II] and [O III] emission from these shocks in the images of Tuohy et al. (1982) (and our own unpublished imagery). Assuming that variations in H surface brightness reflect density variations in the surrounding ISM, the fainter emission should trace portions of the blast wave that have suffered the least deceleration. To investigate the entire network of Balmer-dominated shocks in DEM L 71 , we observed the remnant with the Rutgers Fabry-Perot imaging spectrometer (RFP), centered on the narrow component H line at the velocity of the LMC. Since the entire SNR (1.4′ 1.2′) lay within the RFP field of view, we were able to extract spectra from the entire blast wave rim while simultaneously measuring the radius of each extraction point from the center of DEM L 71 . This was invaluable for correlating the variation of shock speed with both radius and position angle along the blast wave rim.
Combined with the recent observation of DEM L 71 by Chandra (HGRS03, RGH03) the RFP spectra present us with an unprecedented opportunity to probe the underlying physics of high Mach number, collisionless shocks. Thanks to its 0.5″ resolution, Chandra has revealed a strikingly detailed correlation between the X-ray and optical morphologies of the blast wave, suggesting a common origin for both sources of emission (HGRS03, RGH03). As shown by RGH03, the postshock proton temperatures and shock velocities measured from Balmer-dominated spectra can be combined with the postshock electron temperatures of the blast wave measured from Chandra spectra to measure the equilibration fraction immediately behind the shock (()0 ) as a function of shock speed. As we will show in this paper, the RFP and Chandra data probe shock speeds that vary by a factor 3 along the rim of DEM L 71 , therefore we can use our multiwavelength study of this SNR to probe the (poorly known) degree of collisionless heating over a large sample of shock speeds, in a model-independent manner.
2. SPECTROSCOPIC OBSERVATIONS
Our observations of DEM L 71 were performed with the RFP spectrometer at the 1.5 m telescope of Cerro Tololo Inter-American Observatory on 1998 February 18 and February 21 (UT). The Tek1024 CCD and 200 mm camera lens were used with the f/7.5 secondary focus, giving an image scale of 065 pixel-1. The field of view was a circle 7.8′ in diameter, centered on coordinates 05h05m428, 67∘52′359 (2000). The scans were centered on the LMC systemic velocity = +278 km s-1 and sampled the H line profile at 14 velocity slices = (704, 617, 480, 347, 210, 155, 128, 77, 18, +87, +192, +330, +471, +791) km s-1 . All scans except for those at 704 and +791 km s-1 were performed on the first night of the observing run. One image was acquired at each etalon setting, with an exposure time of 750s at 704 km s-1 and +791 km s-1 and 500s at all other settings. The average seeing during the first night was 22 FWHM; the worst seeing occurred during the scans centered redward of the H narrow component. During the second night, the average seeing was 28 FWHM. In our observations we used the CTIO H filter 6563/75 ( = 75 Å) to isolate emission from a single spectral order.
We reduced the Fabry-Perot images using IRAF111IRAF is distributed by the National Optical Astronomy Observatories, which is operated by the AURA, Inc. under cooperative agreement with the National Science Foundation and our own custom software. We applied overscan and bias subtraction to all images in the standard way. Separate flat field images of the telescope dome white spot were obtained at each observed wavelength, and were used to correct the detector pixel-to-pixel response variations and to remove the H filter transmission response. The wavelength scale was calibrated using a series of comparison exposures of H and nearby Neon lines. The zero-point drift of the wavelength solution was determined from H calibration exposures interspersed with the object frames during the observations. We estimate that the resulting wavelength calibration is accurate to better than 0.1 Å. The RFP instrumental spectral profile measured from the calibration exposures is well fit by a Voigt function with a Gaussian width of 44 km s-1 and Lorentzian width of 52 km s-1 . The resulting instrumental FWHM is 117 km s-1 . We removed cosmic rays from the images by interpolating over neighboring pixels and used foreground stars to register all the images to the one at the central velocity, V = 18 km s-1 . We scaled the transmission of the RFP scans to a common airmass using the CTIO mean extinction tables, then applied a Gaussian smoothing kernel to each image to produce a common effective seeing of 28 FWHM. Finally we computed a coordinate solution (accurate to within 02) for each image using USNOA2.0 Catalogue stars in the field.
3. SPECTRAL EXTRACTION AND BACKGROUND SUBTRACTION
The RFP datacube enables us to extract spectra from any desired point along the blast wave of DEM L 71 . Using snapshots of DEM L 71 at different velocity intervals, we can decide on appropriate locations, sizes and orientations for spectral extraction apertures. This is particularly advantageous in the case of DEM L 71 , where the mixture of non-radiative and partially radiative shock emission around the remnant (Tuohy et al. 1982, SKBW91, SRL94) forces us to exercise caution when selecting regions for spectral analysis.
In addition to having H narrow components contaminated by radiative recombination, most of the bright lumps and filaments exhibit [N II] 6548, 6583 emission lines in their spectra. The broad component widths are large enough to overlap with these lines, complicating the task of fitting the H profiles. Therefore, we focused our spectroscopic analysis on parts of the SNR which have suffered less deceleration than those studied earlier by SKBW91 and SRL94.
After trying various aperture selection schemes, we decided that the best option would be to preserve a constant number of integrated counts for all of the spectra. This results in H line profiles with similar signal-to-noise and facilitates the inter-comparison of their broad-to-narrow ratios. Since the thickness of the blast wave filaments is nearly constant throughout the remnant, we chose apertures with constant widths and varying lengths. While selecting spectral extraction apertures for DEM L 71 , we were careful to avoid the aforementioned regions showing signs of radiative cooling, namely the bright filaments seen in the eastern, northern and western portions of the remnant. We also excluded regions where stars were present. The final selection of 14 apertures is marked in Figure 1 and listed in Table 1. Each aperture contains approximately 13,000500 counts over the entire line profile, before sky subtraction. The aperture sizes, locations and position angles were chosen to cover as much of the blast wave emission as possible while preserving a constant number of counts per aperture and avoiding the brighter filaments on the east-west sides of DEM L 71 .
The RFP spectral extraction consisted of summing the emission within each defined aperture, for each frame of the datacube. Although the wavelength varies with position in each FP image, the variation over each aperture is 0.01 Å, negligible compared to the spectral resolution. To perform the sky subtraction, we selected a ring of pixels in each frame of the datacube, centered on the optical axis and passing through the middle of each extraction aperture. This ensured that the sky fluxes were extracted at the same wavelength as the emission within each blast wave aperture. The ring included all the sky lying off the supernova remnant which did not fall onto stars or other detectable discrete sources. We summed the sky emission along the ring, rejecting pixels deviating more than 4 from the mean value. We then multiplied the resulting sky spectrum by to obtain a scaled sky spectrum for each of the blast wave apertures. Subtracting this spectrum from that of our object yielded the final object spectrum for each aperture (Figs. 2a2d). The sky subtraction removes large scale sources of background emission in the RFP data bandpass, namely night sky H, galactic H and [N II] 6583, and the LMC H and [N II] 6548.
4. LINE PROFILE FITS
The intrinsic SNR Balmer line profiles are well described by the sum of two Gaussian shapes (Ghavamian 1999) with different widths, velocities and strengths. These are convolved with the instrumental response function of the Fabry-Perot, a Voigt profile. Therefore, the resulting line shape is the sum of two Voigt profiles. Since the narrow component line is unresolved, it is characterized by two parameters: its central wavelength and flux. The broad component, on the other hand, is described by three parameters: its central wavelength, Gaussian width and flux. In fitting the sky-subtracted profiles we leave the five listed parameters free, while fixing the baseline level to zero.
Due to the presence of Lorentzian wings in the extracted line profiles, it is not always obvious from the data whether the wings of an H profile are caused by a second (broad) component or whether they are simply the Lorentzian tail of a single, narrow component. Since the broad-to-narrow flux ratio can vary significantly from point to point along the rim of DEM L 71 , we required a method for quantitatively measuring the likelihood of a broad component detection in each extracted spectrum. We used the following approach. First, we fit each H profile with a single, narrow Voigt function. Using parameters output from a -minimized fit, we then added a second Voigt function and re-computed the best fit. The initial guesses for the broad component parameters were to take = 0.5 and to assume an unresolved broad component profile, .
To statistically evaluate the influence of a second Voigt component on the profile fits, we computed an F-statistic for each profile using the definition of F and the goodness-of-fit parameter from Martin (1971) and Band et al. (1996). In this procedure a large value of and small value of would indicate that it is unlikely the superior two-component fit resulted from a random statistical fluctuation. As Table 2 shows, is on the order of 5% for all blast wave apertures other than apertures 1 and 2, indicating that a second, broad component is detected in each H profile.
5. BLAST WAVE SPECTRA
Most of the blast wave around DEM L 71 follows a ‘faceted’ morphology, where relatively straight sections of the shock front appear joined together at abrupt breaks in orientation angle. This is most strikingly seen in the northern, southwestern and southeastern edges of the remnant. The size of each section reflects the length scale for variations in ambient density around DEM L 71 .
The H profile fits in Figures 2a2d show that the H broad component is detected in 14 of the 16 spectra. The fitting results are summarized in Table 2. The broad component widths and broad-to-narrow ratios vary considerably with position along the rim. The faintest blast wave filaments tend to exhibit the largest broad component widths (with the notable exception of aperture 10), while sections of the blast wave lying adjacent to filaments of intermediate brightness (such as apertures 4, 13 and 14) tend to exhibit smaller broad component widths.
Spectra from apertures 1 and 2 at the northern rim are well fit by a single narrow H emission line, indicating that the broad component emission either lies beneath the detection threshold or is entirely absent at these locations. Interestingly, a broad component is detected in the aperture 3 spectrum, even though it is part of the same straight, faint filament as apertures 1 and 2 (Figure 1). This is likely due to a gradient in preshock neutral density which causes the surface brightness to increase by nearly 70% from aperture 1 to aperture 3. A density gradient is also apparent in the X-ray surface brightness of the Chandra data (RGH03), indicating that the total preshock density also rises between apertures 1 and 3. The broad component widths of apertures 3 and 4 and their corresponding errorbars are consistent with a single broad component width of 840 km s-1 , nearly 40% larger than the widths measured by SKBW91 from the brighter east/west filaments.
Progressing along the western side of DEM L 71 , we find that the spectra of apertures 5 and 6 exhibit the largest broad component widths (1000 km s-1 ) seen to date in this SNR. The faint blast wave bulges out beyond the brightest western filament (Figure 1). Since the Balmer emission is produced very close to the blast wave, the radial separation between two filaments is entirely due to geometric projection. This suggests that the brightest western emission marks the location where the forward shock has slowed due to an encounter with denser material. This is confirmed by both longslit spectra (SKBW91) and our RFP profiles, which indicate that the broad component width of the bright western filament is only half that of apertures 5 and 6. The broad component profiles of apertures 5 and 6 are consistent with a single FWHM of 985 km s-1 and = 0.540.09. These are the largest broad component widths reported so far in DEM L 71 .
The southern edge of DEM L 71 reveals some of the best examples of the ‘faceted’ rim morphology mentioned above. A noticeable brightening occurs in the filament covered by apertures 79. The Chandra image of DEM L 71 shows that the enhanced H is accompanied by a sharp rise in X-ray emission (RGH03, HGRS03). This indicates a higher total preshock density at the regions covered by apertures 79. All three apertures show similar broad component widths and broad-to-narrow ratios (Table 2). Combining the spectra from the three apertures, we obtain a broad FWHM of 805 km s-1 and = 0.49, similar to values seen in apertures 3 and 4. The broad-to-narrow ratio and broad component width vary considerably from aperture 9 to 12, suggesting substantial variations in shock velocity, preshock density and possibly preshock neutral fraction. The component widths of the aperture 13 and 14 spectra are nearly equal to the values reported by SKBW91 for the bright, partially radiative eastern filament.
Unlike the other shocks in our study, the aperture 15 and 16 filaments are seen well inside the blast wave rim (Figure 1). The filaments sampled by these apertures are of similar surface brightness, yet the broad component width and broad-to-narrow ratio of the aperture 15 spectrum are more than twice as large as the aperture 16 values. The broad component shift in aperture 16 is 160 km s-1 relative to the narrow component, suggesting that the H emission in this aperture is dominated by partially face-on shocks. The Chandra image of DEM L 71 shows that there are in fact three nested blast wave shocks in the southwest region (RGH03). By comparing the optical images with the Chandra image we have determined that two of these nested shocks are sampled by aperture 15. In that case, variations in the line-of-sight bulk velocity from inter-filament emission could contribute substantially to the broad component width of the aperture 15 spectrum.
6. SHOCK MODELS
To model the Balmer line profiles, we used the one-dimensional, plane-parallel shock code described in Ghavamian (1999) and GRSH01 to compute a grid of numerical models. The code calculates the density and temperature of electrons, protons and hot neutrals behind a Balmer-dominated shock. Broad-to-narrow flux ratios are computed by a Monte Carlo simulation which follows the excitation of H photons in the broad and narrow components. The radiative conversion of Ly photons into H (Ly trapping) is also followed in the simulation. At the shock speeds relevant to DEM L 71 (1500 km s-1 ) the protonH ionization and excitation rates are 1% of the electron rates. Therefore, all direct collisional ionization/excitation processes are dominated by the electrons. The shock velocity, fractional electron-ion equilibration ()0 at the shock front by plasma turbulence, and preshock neutral fraction of H are taken as free parameters. The quantity ()0 varies from ( 0) for zero equilibration at the shock front to ()0 = 1 for full, prompt equilibration at the shock front. (In this work we have chosen to describe our results in terms of ()0 rather than the related quantity used in earlier works (GRSH01, Ghavamian et al. 2002), to maintain a consistent notation between this paper and the companion work by RGH03).
In addition to the shock code improvements listed in Ghavamian et al. (2002), we have included the energy lost by electrons to collisional excitation and ionization. Loss terms are included for collisional ionization of H and He, and for Ly and two-photon continuum excitation of H and He. Clearly, ionization losses are most important at the lowest shock speeds, lowest equilibrations and highest preshock neutral fractions, where the electron temperature close to the shock front is lowest. In these cases can initially decline with position behind the shock as excitation and ionization losses exceed energy gain by Coulomb collisions. Subsequently as the ionization fraction rises, also rises over a length scale comparable to the thickness of the H ionization layer as Coulomb collisions come to dominate the energy balance. In models with shock speeds 500 km s-1 , ()0 0.4 and preshock neutral fractions 0.9, we estimate that ionization losses produce a 5%7% increase in the broad-to-narrow ratios relative to models that neglect these losses.
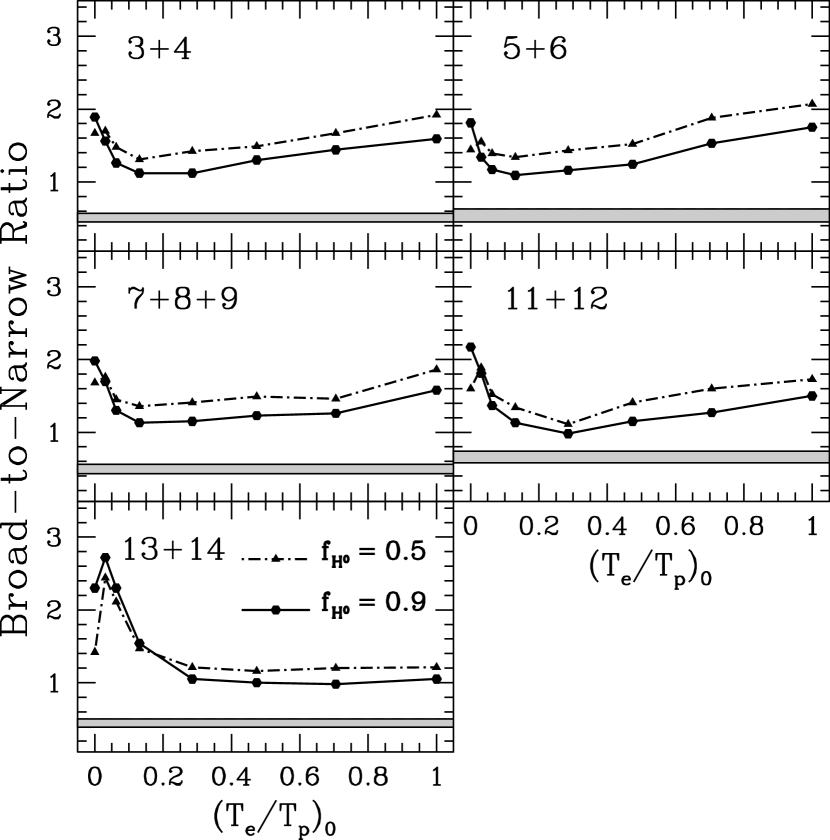
Using the method outlined in GRSH01, we computed a grid of shock models for spectra extracted from the blast wave rim. We matched each grid point in ()0 with the shock velocity required to match the observed FWHM of the broad component line. Using this set of parameters ( , ()0 ), we calculated for a range of assumed preshock neutral fractions , then compared the results with the observed . However, before producing the grid we decided to combine spectra of regions exhibiting consistent broad-to-narrow ratios and broad component widths (to within the errors). The main purpose of combining the spectra was to define large enough apertures along the blast wave to obtain adequate statistics in our parallel analysis of Chandra data (RGH03). The five combined regions are labeled 3+4, 5+6, 7+8+9, 11+12 and 13+14 in reference to the original 14 apertures (c.f. Table 2). The combined apertures correspond to X-ray spectral extraction regions X1X5 from RGH03. After combining the spectra, we re-fit the line profiles in the manner described earlier to estimate the broad component FWHM and broad-to-narrow ratios (Table 3). The limits on implied by the combined aperture broad component widths are listed in Table 4 for the cases ()0 = and ()0 = 1.
7. COMPARISON BETWEEN OBSERVATIONS AND SHOCK MODEL PREDICTIONS
From Figure 3 it is obvious that there is a major discrepancy between the observed and predicted broad-to-narrow ratios: the observed ratios lie as much as 50% below the smallest modeled values. Clearly, some aspect of the shock physics is not included in the models. It seems likely that our models overpredict the broad-to-narrow ratios because they underpredict the narrow component H emission. Narrow component H emission can be enhanced by processes not included in our Balmer-dominated shock models. Although our calculations include the enhancement of narrow component H from Ly trapping within the shock, other possible sources of narrow Ly, such as other shocks in the SNR, are ignored. In addition, if the preshock gas is heated in a precursor it may produce enough collisionally excited H to lower the observed broad-to-narrow ratios.
One way of bringing the model broad-to-narrow ratios into agreement with the observations would be to forgo the Monte Carlo simulation altogether and simply compute the integrated H flux assuming a negligible Ly optical depth in the broad component (case A conditions) and a high Ly optical depth in the narrow component (case B conditions) (Chevalier, Kirshner & Raymond 1980, SKBW91, Ghavamian 1999). However, we find that although the Ly optical depth can be large enough at line center to make case B a valid approximation for the narrow component, it is generally not small enough at broad component line center to allow a case A approximation for the broad component. For example, 7 and 0.2 for 1000 km s-1 and = 0.9. Smaller neutral fractions can lower , but not enough to ignore Ly trapping in the broad component. Therefore, usage of the case A/case B approximations in the computation of broad-to-narrow ratios requires physical conditions not met in practice.
The limiting assumptions from above can be made more plausible if we include absorption of narrow Ly photons produced in other parts of the remnant. For a given shock, this would effectively increase . Absorption of nonlocally produced Ly is more important for a remnant like DEM L 71 which is completely surrounded by Balmer filaments than remnants with only partial shells of Balmer emission. A Ly photon may propagate all the way to the far side of the remnant without being absorbed. Once the photon enters the shock structure on the far side of the remnant, it will most likely be converted into narrow H as it propagates upstream. From the Monte Carlo shock models we estimate that for shock speeds between 600 and 1000 km s-1 , preshock neutral fractions greater than 0.1 and all values of ()0 , less than 8% of all narrow component Ly photons excited behind the DEM L 71 blast wave escape downstream. If all of these photons are absorbed in other parts of the blast wave and are converted into narrow H, the broad-to-narrow ratios be lowered by at most 20% from their intrinsic values. This is less than half the amount required to match most of the observed broad-to-narrow ratios with the smallest model values. Although the Ly luminosity of the partially radiative shocks in DEM L 71 is nearly twice as large as that of the fainter, pure non-radiative shocks, their narrow Ly flux is offset by the significantly smaller surface area of the remnant covered by the partially radiative shocks. Therefore, we now consider the possibility that most of the excess narrow component H is produced ahead of the blast wave, in a precursor.
8. EXPLAINING THE BROAD-TO-NARROW RATIOS
When ionizing photons or energetic particles produced behind a non-radiative shock (such as cosmic rays or fast neutrals) cross upstream, they generate a layer of heated preshock gas known as a precursor. The characteristic size of the precursor depends on the mean free path traveled by the photon or particle before depositing its energy into the upstream gas. This energy is shared between electrons and ions via Coulomb collisions, which for the preshock temperatures inferred from spectroscopic observations (12,000 K40,000 K, Hester, Raymond & Blair 1994, SRL94, GRHB00) leads to ahead of the shock. Collisional excitation by electrons within the precursor can produce observable line emission (Fesen & Itoh 1985, GRHB00). The detectability of such emission depends on the thickness, temperature and ionization structure of the precursor. Therefore, we must constrain these parameters in order to investigate the influence of precursor emission on the observed broad-to-narrow ratios.
A constraint on the precursor thickness can be obtained from the optical images of DEM L 71 . If the precursor is spatially resolved, it should appear as a layer of diffuse H emission extending ahead of the Balmer-dominated filaments (GRHB00). Since the shock front continually overruns the heated ambient gas, the diffuse precursor emission should drop sharply behind the Balmer filaments. A narrow band image of DEM L 71 acquired before the RFP observations does show marginal evidence for diffuse emission above the local background, extending a few arcseconds ahead of the northern limb. However, elsewhere in the remnant the surrounding sky does not show any obvious diffuse emission above the background LMC level. There is also no clear evidence of diffuse emission ahead of most of the filaments in the RFP scans, aside from the emission mentioned earlier ahead of the northern rim.
The remaining possibility is that the precursor emission is produced on small scales, comparable to or less than the Balmer filament thickness. One method of constraining the thickness of such a layer is to examine the RFP images for radial stratification between shocks observed at pure broad component velocities and shocks observed at narrow component velocities (e.g., less than the instrumental width of 117 km s-1 ). If pure broad component filaments appear inside of pure narrow component filaments, this would be nominal evidence for emission ahead of the blast wave on scales slightly larger than the Balmer filament thickness. Performing this test with the RFP images, we find no obvious spatial shift between the narrow and broad emission. Therefore, the layer of excess narrow component emission is restricted to a thickness 3″ (the seeing FWHM). This restriction is important because it allows us to constrain the type of precursor producing the excess H emission.
Before examining the various precursor mechanisms in detail, we must consider the relationship between the spatial resolution of the detector and the relative contributions of the shock and precursor emission from the Balmer-dominated filaments. At a given pixel scale, the spatial resolution of a detector imaging an LMC remnant is over an order of magnitude worse than that of a detector imaging a Galactic remnant. This can make the spatial separation of the precursor and shock emission much more difficult for an LMC remnant like DEM L 71 . If the thickness of the precursor and the thickness of the postshock H ionization zone are both smaller than the projected size of the seeing FWHM, it will be nearly impossible to subtract the precursor emission from that of the shock in a Balmer-dominated filament. Furthermore, the ratio of precursor to shock surface brightness depends on the viewing angle to the shock. If , but both are smaller than the projected size of the seeing FWHM, can become significant for edge-on filaments, even if the ratio is small at face-on positions.
Assuming a spherical geometry and that the radius R of the remnant extends from the remnant center to the blast wave shock front, the edge-on emission is related to the face-on emission through a factor , where is the depth of emission viewed edge-on and is the larger of the layer thickness and the projected size of the atmospheric seeing. If and are both smaller than the projected seeing, the ratio is
| (1) |
where we have used , to simplify the expression. The ratio of precursor to shock emission for the face-on position is
| (2) |
where qHα is the H collisional excitation rate in the precursor, is the electron temperature in the precursor, 0.2 is the number of H photons excited per H atom, is the shock speed and is the preshock electron density. Using Equations 1 and 2 and our limits on the shock parameters, we can first calculate , then use Equation 1 to find , the ratio expected for the filaments. Although some spatial variation of and is expected within the precursor (Boulares & Cox 1988, GRHB00), we take these quantities to be constant for the crude estimates in this section.
The amount of precursor emission required to match the observed broad-to-narrow ratios depends on the assumed shock parameters. For an observed broad-to-narrow ratio ( )o and specified model broad-to-narrow ratio ( )m, the implied ratio of precursor to shock emission is
| (3) |
where we have assumed that the observed narrow component flux is given by the sum of fluxes from the shock and the precursor. From Figure 3, the smallest broad-to-narrow ratios predicted by our models lie in the range 0.91.1. The observed broad-to-narrow ratios lie in the range 0.40.75. Therefore, using Equation 3, the edge-on ratio of precursor to shock emission must lie in the range 0.1 0.9 to resolve the broad-to-narrow ratio discrepancy. Therefore, matching the smallest ( )o with ( )m can require nearly equal contributions to the H flux from the precursor and shock.
For the purpose of obtaining order-of-magnitude estimates of , the main distinction between the precursor scenarios lies in the estimated values of and . We consider three scenarios below:
(1) Photoionization Precursor The gas behind all non-radiative shocks produces ionizing radiation which propagates far upstream and heats the preshock gas (Draine & McKee 1993, SRL94, GRHB00). The dominant source of ionizing photons is He II 304 (Ly ) line emission, which can heat the preshock gas enough to produce observable optical emission (12,000 K20,000 K, GRHB00) but not enough to establish ionization equilibrium. The characteristic size of the photoionization precursor is one mean free path of a He II 304 photon, )-1 (SRL94, GRHB00). Assuming a total preshock density 0.5 cm-3 (as constrained by Chandra spectral fits of RGH03) and neutral fractions lower than 0.9, we obtain an angular size of 7″ for the precursor, sufficiently large to be resolved in the RFP images. However, as mentioned earlier, there is no clear evidence of such emission ahead of the Balmer filaments and above the LMC background. Therefore, we conclude that although a He II 304 is undoubtedly present, it does not contribute enough to the H filament emission to account for the anomalously low broad-to-narrow ratios.
(2) Fast Neutral Precursor Fast neutrals on the tail of the distribution can cross upstream and deposit energy into the preshock medium via elastic collisions and charge exchange with the preshock ions (Hester, Raymond & Blair 1994, SRL94, Lim & Raga 1996). Although there is considerable uncertainty regarding the energy transfer, existing studies suggest that heating in the precursor can be substantial (SRL94, Lim & Raga 1996), with temperatures in excess of 20,000 K easily attained. However, the thickness of the fast neutral precursor is on the order of the charge exchange mean free path, 1021015 cm for the deduced preshock parameters. We estimate the electron temperature in the precursor from measured narrow component widths of SRL94. Assuming purely thermal line broadening and ()0 = 1 in the preshock gas, the 30 km s-1 45 km s-1 narrow component widths quoted by SRL94 imply an electron temperature of 20,000 K40,000 K for the precursor. The collisional excitation rate coefficient rises steeply with over this temperature range. From the Case B calculation of Aggarwal (1983), we estimate (0.13.5)10-10 cm-3 s-1. We adopt 0.5 cm-3 and take the preshock ionization fraction to lie between 0.2 and 0.9. Photoionization by He II 304 and X-ray photons from the reverse shock would make ionization fractions smaller than 0.2 unlikely, while fractions larger than 0.9 would make the Balmer filaments too faint to observe. We assume 900 km s-1 using the average speed listed in Table 4 for the least decelerated portions of the blast wave.
Inserting the estimates from above into Equation 2, and assuming that , we obtain 0.1. Therefore, explaining the full range of broad-to-narrow ratios measured in the filaments remnant would require 10. However, for the shock speeds found in DEM L 71 , , so there is little enhancement in the ratio of precursor to shock emission at edge-on viewing angles, . Therefore, narrow H emission from a fast neutral precursor might contribute to the blast wave spectra of DEM L 71 , but not enough to resolve the discrepancy in all the broad-to-narrow ratios.
(3) Cosmic Ray Precursor Cosmic rays are accelerated by the shock when they scatter from self-generated Alfven turbulence upstream. Since the size of the cosmic ray precursor depends on the poorly known diffusion coefficient of cosmic ray ions, we can only place an upper limit on its size by requiring that the precursor layer be thin enough to avoid ionization equilibrium (otherwise no neutral H would remain to produce the Balmer-dominated emission). This requires , where is the ionization rate coefficient in the precursor (Hester, Raymond & Blair 1994, SRL94). Using 310-10 cm3 s-1 (Janev et al. 1987), we obtain 610. For 0.2, is smaller than the projected size of the seeing FWHM. Inserting this upper limit into Equation 2 and using 10 (the thickness of the H ionization zone behind the shock), we find that can reach values as large as 5.8. According to Equation 1, this ratio is enhanced by another factor 25 at edge-on viewing angles. Therefore, even if were several orders of magnitude smaller than the value set by the ionization length argument, the narrow H emission from a cosmic ray precursor would still be able to lower the intrinsic broad-to-narrow ratios down to the observed levels.
If a cosmic ray precursor exists in DEM L 71 , it should generate optical forbidden line emission. Using the precursor density, temperature and size from above, we can place an upper limit on the [S II] and [N II] surface brightness. If the preshock ionization fraction is 0.2 0.9, and 1 and log(S/H) + 12 = 6.87 (Russell & Dopita 1990), then using the collision strengths of Cai & Pradhan (1993) and assuming the low density limit, we find that the ratio of precursor [S II] (6716 + 6731) to precursor H is 510-3, too faint for detection. Similarly, if we take and use log(N/H) + 12 = 6.55 (Russell & Dopita 1990), the ratio of [N II] (6548+6583) to H is 310-4 in the precursor. At a temperature of 40,000 K, the H collisional excitation rate is more than an order of magnitude larger than the rate at lower temperatures (12,000 K15,000 K, as found in a photoionization precursor, GRHB00). On the other hand, the forbidden line excitation rates do not increase as rapidly between 12,000 K and 40,000 K. Therefore, the Balmer line emission dominates over forbidden line emission in the precursor. This is consistent with the lack of detection of [S II] emission from the pure Balmer-dominated filaments in our narrow band images of DEM L 71 .
Given the uncertain contribution of precursor emission to the narrow component in DEM L 71 , we refrain from further attempts to use the observed broad-to-narrow ratios to estimate ()0 and . Instead, we have combined the proton temperatures and range of shock speeds implied by broad component widths around the rim with electron temperature measurements from Chandra data to estimate ()0 and (RGH03). In the rest of this paper, we use these estimates to draw conclusions regarding the age and explosion energy of DEM L 71 .
9. Evolutionary Models of DEM L 71
The large radius (10 pc) and moderate blast wave speed (4001000 km s-1 ) of DEM L 71 suggest that this remnant is well into the Sedov stage of evolution. One way to test this conclusion is to compare scale quantities predicted by Sedov models, such as the characteristic radius, with the observed radius of the supernova remnant. In the case of a SNR in a uniform density medium and an exponential ejecta profile (as expected for Type Ia explosions; see Dwarkadas & Chevalier 1998, Wang & Chevalier 2001), the blast wave initially evolves through an ejecta-dominated phase. It then enters the Sedov stage when its radius has grown to a characteristic size , given by
| (4) |
(Wang & Chevalier 2001), where is the ejected mass, is the Chandrasekhar mass (1.4 ) and is the density of the ambient medium. Taking a range 0.3 1.4 from fits to the combined aperture Chandra blast wave spectra (RGH03; also see Table 4) and assuming , we find 3.3 pc. This is less than half the average blast wave radius of DEM L 71 ; therefore the remnant should be well into the Sedov-Taylor phase of evolution.
Two fundamental parameters of interest in DEM L 71 are the age and explosion kinetic energy . We assume that azimuthal variation in and result from azimuthal variations in ambient density. A reasonable first approximation for modeling this dependence is to describe the blast wave evolution in each spectral extraction aperture in terms of its own Sedov solution. In that case, and are identical everywhere along the blast wave rim, with varying from section to section. In that case, the equations governing the evolution of the remnant predict R, where . Furthermore, inverting the Sedov-Taylor relation (Sedov 1959) for R(t) yields
| (5) |
where n0 is the preshock H density and is measured in years. Here, the total preshock density in the Sedov equation is related to the preshock H density (measured from the X-ray spectra) by a factor of 1.4. Fitting and (R) to the data yields and . To perform these fits, we utilized the values of ()0 determined by RGH03 to calculate the appropriate shock speeds consistent with the broad component widths found in the combined aperture regions (see Table 4). We also used determined from the X-ray models of RGH03. Since GRSH01 and RGH03 found evidence that ()0 and are inversely related, the faster shocks in DEM L 71 will have shock speeds closer to the ()0 = 0 predictions, while the slower shocks will have speeds closer to the ()0 = 1 predictions. The assumption that the combined aperture shocks are either all unequilibrated or fully equilibrated is not strictly valid; however, the results of our fits to (R) and do not change significantly if ()0 is set to either extreme for all the shocks.
The analysis outlined above requires an estimate of R for each aperture, which in turn requires an estimate of the expansion center. Therefore, the following procedure was implemented: first we used a range of expansion center coordinates to calculate a grid of fits for (R). After choosing the expansion center coordinates which yielded the smallest in the grid, we then computed the 1 error box about that best fit center (see Figure 1). Next, we independently performed the same procedure for n0(R), obtaining an independent estimate of the expansion center and a 1 error box on that fit (also marked on Figure 1). We chose the central pixel from the overlap region between the (R) and (R) error boxes and designated the coordinates of that pixel (, ) to be the expansion center of the remnant. Finally, returning to the grids in and (R), we use the fits at the expansion center (, ) to estimate and .
In Figure 4 we show the fitted blast wave speeds vs. radii, derived using our best estimate for the expansion center (located at 05h05m423, 67∘52′413). Here we have ignored the uncertainty in blast wave radius in our images. Since the distance to the LMC is uncertain by as much as 13% (Gibson 2000), we have included a factor (the distance in units of 50 kpc) when quoting the fitted parameters. The slope of the fit is (89.65.9) km s-1 pc-1, which yields = (4360290) years for DEM L 71 . This age is less than half the value quoted by SKBW91, whose analysis was based on broad component width measurements of the slower, brighter Balmer-dominated shocks. We also note that an age of (4360290) years is in good agreement with the age of 4700 years calculated from fits to ASCA data by HHK98.
Using an expansion center fixed at (, ) and our estimated remnant age, the fit to n0(R) (shown in Figure 5) yields an explosion kinetic energy of = (0.370.06) . The two main sources of uncertainty lie in the distance to the LMC and the FWHM measurement of the broad component width (which affects through ). Allowing for the distance uncertainty to the LMC and the statistical error, lies between 0.2 and 0.6, less than half the value computed by HHK98. The main reasons for the difference are that HHK98 approximated DEM L 71 as a sphere 10.4 pc in radius (despite the sizable variation of R with azimuth) and fit the global X-ray spectrum of both the blast wave and metal rich ejecta to generate Sedov models for the remnant. Our optical study utilizes velocities, densities and radii from multiple sections of the blast wave; therefore, it provides a much more direct and accurate estimate of the explosion energy than the models of HHK98. However, our derived explosion energy for DEM L 71 is low compared to values predicted by 1-dimensional (Höflich & Khokhlov 1996) and 3-dimensional (Reinecke et al. 2002) hydrodynamical models of Type Ia SNe. The reason for the difference is not clear; one possible explanation is that some of the kinetic energy imparted to the ejecta in DEM L 71 was lost during an earlier epoch when, unlike now, cosmic ray acceleration was efficient.
The expansion center overlap region in Figure 1 is shifted slightly to the east of the apparent center. This is consistent with a supernova explosion in a medium with an azimuthal density gradient. A higher than average density has decelerated the blast wave on the entire east side of the remnant, while recent encounters with H I clouds on the east and west sides have caused a strong brightening in the optical emission. The presence of forbidden line emission in these filaments indicates that these shocks are becoming radiative. In contrast, the blast wave is expanding most rapidly along the north and southwest rims of the remnant, where the density is lower than average. The fact that the preshock densities follow an R-5 relation so well implies that despite the large differences in shock speed between the east rim of DEM L 71 and the rest of the remnant, the kinematics of the blast wave are consistent with Sedov evolution.
One interesting property of DEM L 71 is that although the partially radiative filaments on the east rim are nearly twice as bright as the filaments covered by apertures 13 and 14, they all lie at the nearly the same radius and have similar broad component widths (as verified by our own data and that of SKBW91). The preshock gas in these partially radiative, [N II]- and [S II]-emitting clouds is nearly twice as dense as that of the shocks in apertures 11+12 and 13+14. If the densities of these clouds were plotted on Figure 5, they would lie well above the fitted curve for . This would reflect a significant departure from the Sedov description in the brightest filaments, and would suggest that while the shocks in apertures 11+12 and 13+14 are moving through a moderate, large scale density gradient, the brightest filaments are shocks driven recently by the blast wave into stronger, more discontinuous jumps in ambient density.
In the above analysis we have assumed that the blast wave contained within each combined aperture has propagated through a constant density ISM during the course of the remnant’s evolution. This is a reasonable assumption since the accumulated weight of evidence suggests that DEM L 71 was produced by an exploding white dwarf (Type Ia SN). However, we can also determine the age and explosion energy of DEM L 71 under the assumption that the remnant was produced by a Type Ib or Type II SN inside of a low density cavity. In that case, the bubble would have been evacuated by a strong wind from a massive (8 M⊙) prognitor star. The density profile of the cavity would follow a power law , where 0 (Cox & Franco 1981, Franco et al. 1991). Taking = 2 (Franco et al. 1991), the relationship between and R becomes = . Using Equation (14) of Cox & Franco (1981), the coefficient of R-5 in Equation 5 is multiplied by (1 0.239 )/(3 ). The R-5 proportionality in Equation 5 remains unchanged because the R2 dependence of is already contained in our measurement of the current density from the X-ray data.
Taking the fitted slopes for and quoted in the previous subsection, we estimate that for the case = 2 the age of DEM L 71 is = (3100200) yr and = (0.330.05). Thus both the implied explosion energy and the estimated age of the remnant are slightly lower when the blast wave propagates through a cavity. This result is understandable because less energy and less time is required to expand the SNR to its current radius if the blast wave has only recently encountered the walls of the cavity. Although steepening the density profile to 2 would lower the blast wave energy still further, an asymptotic limit is quickly reached where 0.27 as .
The assumption that each section of the DEM L 71 blast wave follows its own Sedov evolution may be questioned on the grounds that pressure gradients transverse to the blast wave could cause one section to affect the evolution of another section. In the general case, the blast wave should be modeled using a multidimensional hydrodynamic description. However, as indicated in Table 4, only the shock parameters and radii from region 13+14 differ significantly from those of the remaining regions. Therefore, the strongest pressure differences should arise between regions on opposite sides of DEM L 71 . The relevant question, then, is to determine how the time required for a sound wave to travel across the remnant interior compares to the age of the remnant. Using the self-similar relations of Cox & Franco (1981) to compute the sound travel time as a function of average interior temperature, we then integrate the relation over radius to obtain . Taking the current blast wave speed to be 1000 km s-1 and the diameter of the remnant to be 20 pc, we find that for a remnant age 4000 years (consistent with the diameter of DEM L 71 and that the ejecta have all passed through the reverse shock as found by HGRS03), 3. This suggests that during the current epoch at least, it is possible for parts of the blast wave on opposite sides of the remnant to evolve independently in the manner we have assumed.
10. LIMITS ON COSMIC RAY ACCELERATION PARAMETERS
We can use our derived limits on the precursor thickness, preshock density, shock speed and explosion energy to constrain cosmic ray acceleration parameters for DEM L 71 . These parameters are the cosmic ray diffusion coefficient, , the maximum cosmic ray energy and the roll-off frequency of the synchrotron emission spectrum. In the limit where scales linearly with particle energy (the Bohm limit), the maximum cosmic ray energy is 1.1 (G) ( /)1/3 (Draine & McKee 1993), where is the preshock magnetic field strength and is in km s-1 . Using our shock parameter estimates from the previous section, we find 11.3 (/3 G). The roll-off frequency, defined as the frequency where the synchrotron power law emission from cosmic rays begins to exponentially decline, is given by 1.41013 (/3 G) Hz (Reynolds 1998). Inserting our estimate for , we obtain 1.81015 (/3 G) Hz, corresponding to a wavelength 1700 (3 G/) Å. Furthermore, the cosmic ray diffusion coefficient is related to the precursor thickness via = / (Draine & McKee 1993). This gives an upper limit 5.410 cm2 s-1 for cosmic rays in DEM L 71 .
In an independent study of DEM L 71 , Hendrick & Reynolds (2001) extrapolated the observed radio synchrotron flux of DEM L 71 to the X-ray regime in order to estimate the maximum cosmic ray energy allowed by the data. They found 80, where is the postshock magnetic field strength. If we assume that 12G, then we find that our estimated maximum energy and roll-off frequency lie well within the limit allowed by the estimate of Hendrick & Reynolds (2001).
In a study of 25 LMC supernova remnants by Mathewson et al. (1983), DEM L 71 was found to exhibit the lowest radio flux density in the sample ( 0.02 Jy at 408 MHz). This suggests that although DEM L 71 accelerates cosmic rays to TeV energies, the density of these particles is significantly lower than that found in the other LMC SNRs. Therefore, it seems unlikely that the blast wave structure of DEM L 71 is significantly altered by nonlinear feedback from cosmic ray acceleration. Further evidence against efficient cosmic ray acceleration in DEM L 71 may be found in our optical and Chandra data. The detailed correlation between the optical and X-ray morphologies (HGRS03, RGH03) suggests that the blast wave emission is predominantly thermal in origin. In addition, the shock models of Boulares & Cox (1988) predict precursor temperatures 106 K for non-radiative shocks dominated by cosmic ray pressure. This is clearly ruled out by the H narrow component width measurements of SRL94 and the presence of Balmer line emission from behind the shock.
11. SUMMARY AND DISCUSSION
We have conducted a thorough spectral imaging study of the supernova remnant DEM L 71 in H. Spectra extracted from the blast wave show the broad and narrow component emission lines characteristic of non-radiative shocks in partially neutral gas. The H broad component width ranges from 450 km s-1 along the eastern edge to values 1000 km s-1 along the faint western edge. No broad component is detected in spectra of the faint northern rim, indicating a very low density in these regions and probably a broad component width in excess of 1000 km s-1 . The range of shock velocities is 500 km s-1 along the eastern rim, 700800 km s-1 along the southeastern and southern rims and 8001000 km s-1 along the western and northwestern rims. other parts of the blast wave. The H broad-to-narrow ratios range from around 0.4 to 0.8, falling significantly below the values predicted by our shock models. The most likely explanation for the discrepancy is extra narrow component emission from a cosmic ray precursor, although a fast neutral precursor may also contribute some emission.
If collisional excitation in a 40,000 K cosmic ray precursor produces narrow line emission, the steep Balmer decrement of the precursor should affect the H broad-to-narrow ratio far less than the H broad-to-narrow ratio. Therefore, a measurement of the H broad-to-narrow ratio in the future would be highly desirable. Among the other studied Balmer-dominated remnants, Tycho also exhibits an anomalously low H broad-to-narrow ratio (SKBW91, Ghavamian 1999, Ghavamian et al. 2001). In that case, where both H and H broad-to-narrow ratios were measured, the former ratios were found to lie 40% below the lowest predicted values, while the latter ratios were found to agree with the lowest predicted values. This is consistent with detection of superimposed precursor and shock emission. Note that the high inferred preshock neutral fraction for Tycho’s SNR (GRHB00) would make the precursor emission more detectable there than remnants like SN 1006, where the inferred preshock neutral fraction is only 10% (Ghavamian et al. 2002). A high preshock neutral fraction and large size for DEM L 71 (over twice that of Tycho) would certainly elevate the role of a precursor in understanding the blast wave emission.
Our ability to map the shock velocity along the entire rim of DEM L 71 has enabled us to estimate the age and explosion energy of this remnant entirely from the blast wave kinematics. Assuming the blast wave propagates into a radially uniform ISM, the derived age for DEM L 71 is 35005000 years, less than half the value calculated from previous observations (SKBW91). The explosion kinetic energy is (26) 1050 ergs, less than half the canonical value assumed for Type Ia SNe. One possible explanation for the difference may be the loss of energy during an earlier phase of evolution, when DEM L 71 experienced efficient cosmic ray acceleration. However, the lack of evidence for nonthermal emission in Chandra X-ray spectra of the blast wave (RGH03), the strong similarity between the optical and X-ray morphologies of the blast wave and the faintness of the radio emission (Mills 1984) suggest that blast wave energy loss to cosmic ray acceleration is not significant in the current epoch.
The presence of significantly neutral gas around the entire blast wave of DEM L 71 places a strong limit on the amount of photoionizing radiation emitted by the accreting white dwarf progenitor. SuperSoft X-ray Sources (SSS) are believed to be one class of these progenitors (van den Heuvel et al. 1992, Rappaport, Di Stefano & Smith 1994). In their detailed calculations of ionization conditions surrounding SSS, Rappaport et al. (1994) found that H is entirely ionized inside a radius of 28 pc for a source with standard parameters Teff = 4105 K, L = 1038 ergs s-1 in a medium with n1 cm-3. This is clearly larger than the current blast wave radius of DEM L 71 (R 9.5 pc) and limits the luminosity of an SSS progenitor to values 1037 ergs s-1. Note that due to the low ambient density, the recombination time per H atom is 105 yr, so that little neutral gas should re-form within the ionized bubble created by an SSS progenitor. Moreover, it is worth noting that SSS progenitors with L 1037 ergs sm-1 also appeared to be ruled out in younger Balmer-dominated remnants of Type Ia SNe, such as SN 1006 and Tycho’s SNR. This limit is especially stringent in the latter remnant, where the blast wave encounters significantly neutral gas only 23 pc from the center of the explosion.
There are at least 4 other SNRs with nearly complete Balmer-dominated rims, namely RCW 86 (Long & Blair 1990, Smith 1997) in our galaxy and 050967.5, 051969.0 and 054870.4 (Tuohy et al. 1982) in the LMC. Of these remnants, 050967.5 shows no evidence of a broad component (Tuohy et al. 1982, SKBW91), probably due to its very high shock speed. On the other hand, although spectra of RCW 86 have revealed strong broad component emission (Long & Blair 1990, Ghavamian et al. 2001), it is nearly 40′ in size (Smith 1997). This is larger than the FOV of most Fabry-Perot spectrometers, making a detailed FP study of this SNR more time consuming and challenging. Only 051969.0 and 054870.4 appear to be small enough ( 1′) with small enough broad component widths (750-1300 km s-1 , SKBW91) to be amenable to the type of study we have undertaken of DEM L 71 . By applying the blast wave kinematic analysis described in this paper to 051969.0 and 054870.4, we would be able to enlarge our sample of SNRs with well determined ages and explosion energies. Such a study would be invaluable in testing evolutionary models of young SNRs and in the interpretation of existing data from the infrared to the X-ray regimes.
P. G. would like to thank John Raymond for helpful discussions on the shock physics presented in this work. The authors also thank the referee for helpful suggestions on improving the paper. This work was partially supported by Chandra Grants GO0-1035X and GO1-2052X, and NSF grant AST 9619510. C. E. R. acknowledges support from a NASA Graduate Student Research Program Fellowship. J. P. H. and T. B. W. would like to thank the staff of CTIO for their hospitality and support during the Fabry-Perot observations.
References
- (1)
- (2) Aggarwal, K. M. 1983, MNRAS 202, 15
- (3) Band, D. L. et al. 1996, ApJ 458, 746
- (4) Blandford, R. D. & Eichler, D. 1987, Phys. Rep., 154, 1
- (5) Boulares, A. & Cox, D. P. 1988, ApJ, 333, 198
- (6) Bychkov, K. V. & Lebedev, V. S. 1979, å, 80, 167
- (7) Cai, W. & Pradhan, A. K. 1993, ApJS, 88, 329
- (8) Chevalier, R. A. & Raymond, J. C. 1978, ApJ, 225, L27
- (9) Chevalier, R. A., Kirshner, R. P. & Raymond, J. C. 1980, ApJ, 235, 186
- (10) Chevalier, R. A. 1982, ApJ, 258, 790
- (11) Cox, D. P. & Franco, J. 1981, ApJ, 251, 687
- (12) Draine, B. T. & McKee, C. F. 1993, ARA&A, 31, 373 (p 410)
- (13) Dwarkadas, V. V. & Chevalier, R. A. 1998, ApJ, 497, 807
- (14) Fesen, R. A. & Itoh, H. 1985, ApJ, 295, 43
- (15) Franco, J., Tenorio-Tagle, G., Bodenheimer, P. & Róz̀yczka, M. 1991, PASP, 103, 803
- (16) Ghavamian, P. 1999, PhD Thesis, Rice University
- (17) Ghavamian, P., Raymond, J., Hartigan, P. & Blair, W. P. 2000, ApJ, 535, 266 (GRHB00)
- (18) Ghavamian, P., Raymond, J., Smith, R. C. & Hartigan, P. 2001, ApJ, 547, 995 (GRSH01)
- (19) Ghavamian, P., Winkler, P. F., Raymond, J. C. & Long, K. S. 2002, ApJ, 572, 888
- (20) Gibson, B. K. 2000, Mem. Soc. Astron. Ital. 71, 693
- (21) Hendrick, S. P. & Reynolds, S. P. 2001, ApJ, 559, 903
- (22) Hester, J. J., Raymond, J. C. & Blair, W. P. 1994, ApJ, 420, 721
- (23) Höflich, P, & Khokhlov, A. 1996, ApJ, 457, 500
- (24) Hughes, J. P., Hayashi, I. H. & Koyama, K. 1998, ApJ, 505, 732
- (25) Hughes, J. P., Ghavamian, P., Rakowski, C. & Slane, P. O. 2003, ApJ, 582, L95 (HGRS03)
- (26) Lim, A. J. & Raga, A. C. 1996, MNRAS, 280, 103
- (27) Long, K. S., Helfand, D. J. & Grabelsky, D. A. 1981, ApJ, 248, 925
- (28) Long, K. S. & Blair, W. P. 1990, ApJ, 358, L13
- (29) Martin, B. R. 1971, Statistics for Physicists, London: Academic
- (30) Mathewson, D. S., et al. 1983, ApJS, 51, 345
- (31) Rakowski, C. E., Ghavamian, P., & Hughes, J. P. 2003, ApJ, submitted (RGH03)
- (32) Rappaport, S., Chiang, E., Kallman, T. & Malina, R. 1994, ApJ, 426, 692
- (33) Rappaport, S., Di Stefano, R. & Smith, J. D. 1994, ApJ, 426, 692
- (34) Reinecke, M., Hillebrandt, W. & Niemeyer, J. C. 2002, å, 391, 1167
- (35) Remillard, R. A., Rappaport, S. & Macri, L. M. 1995, ApJ, 439, 646
- (36) Reynolds, S. P. 1998, ApJ, 493, 375
- (37) Russell, S. C. & Dopita, M. A. 1990, ApJS, 74, 93
- (38) Sedov, L. I. 1959, Similarity and Dimensional Methods in Mechanics, New York: Academic Press
- (39) Smith, R. C., Kirshner, R. P., Blair, W. P. & Winkler, P. F. 1991, ApJ, 375, 652 (SKBW91)
- (40) Smith, R. C., Raymond, J. C. & Laming, J. M. 1994, ApJ, 420, 286 (SRL94)
- (41) Smith, R. C. 1997, AJ, 114, 266
- (42) Tuohy, I. R., et al. 1982, ApJ, 261, 473
- (43) van den Heuvel, E. P. J., Bhattacharya, D., Nomoto, K. & Rappaport, S. A. 1992, å, 262, 97
- (44) Wang, C.-Y. & Chevalier, R. A. 2001, ApJ, 549, 1119
- (45) Winkler, P. F. & Long, K. S. 1997, ApJ, 491, 829
- (46)


| Aperture | (2000) | (2000) | Size () | Position Angle () aaMeasured E of N |
|---|---|---|---|---|
| 1 | 05:05:42.0 | 67:51:57.5 | 3.212.3 | 69 |
| 2 | 05:05:40.2 | 67:52:02.6 | 3.211.0 | 69 |
| 3 | 05:05:38.6 | 67:52:08.5 | 3.29.7 | 55 |
| 4 | 05:05:37.7 | 67:52:16.2 | 3.28.4 | 30 |
| 5 | 05:05:35.8 | 67:52:42.8 | 3.29.7 | 0 |
| 6 | 05:05:35.8 | 67:52:53.8 | 3.212.3 | 0 |
| 7 | 05:05:37.7 | 67:53:10.1 | 3.212.3 | 115 |
| 8 | 05:05:39.5 | 67:53:14.4 | 3.29.7 | 115 |
| 9 | 05:05:41.2 | 67:53:18.5 | 3.211.0 | 115 |
| 10 | 05:05:43.2 | 67:53:19.7 | 3.211.0 | 90 |
| 11 | 05:05:45.5 | 67:53:13.5 | 3.211.0 | 35 |
| 12 | 05:05:46.4 | 67:53:05.4 | 3.28.4 | 35 |
| 13 | 05:05:46.9 | 67:52:30.1 | 3.27.1 | 340 |
| 14 | 05:05:46.3 | 67:52:22.9 | 3.28.4 | 330 |
| 15 | 05:05:37.9 | 67:52:55.9 | 3.29.7 | 320 |
| 16 | 05:05:41.4 | 67:53:09.1 | 3.211.0 | 110 |
| Aperture | / 9 d.o.f.aaThe quoted values are for one-component profile fits for apertures 1 and 2 and two-component profile fits for apertures 3-16. | P(F)bbP(F) denotes the F-test goodness-of-fit for inclusion of a broad component (see text for details). | VFWHM (km s-1 )ccThe Gaussian FWHM of the broad component. | IB/IN | ddThe shift of the broad component centroid from the narrow component centroid. |
|---|---|---|---|---|---|
| 1 | 1.17 | ||||
| 2 | 0.56 | ||||
| 3 | 0.92 | 0.05 | 855 | 0.500.08 | +85 |
| 4 | 2.59 | 0.05 | 700 | 0.510.06 | +27 |
| 5 | 1.10 | 0.04 | 1055 | 0.88 | 16 |
| 6 | 0.48 | 0.10 | 900 | 0.200.08 | 80 |
| 7 | 0.54 | 0.07 | 595 | 0.290.09 | 59 |
| 8 | 1.26 | 0.05 | 830 | 0.55 | +2 |
| 9 | 1.09 | 0.05 | 835 | 0.51 | 103 |
| 10 | 1.16 | 0.11 | 350 | 0.260.09 | +104 |
| 11 | 1.07 | 0.07 | 595 | 0.360.09 | 74 |
| 12 | 1.17 | 0.04 | 785 | 0.93 | 74 |
| 13 | 0.60 | 0.04 | 540 | 0.46 | +2 |
| 14 | 2.53 | 0.08 | 35590 | 0.45 | 13 |
| 15 | 0.81 | 0.06 | 490 | 0.280.07 | +160 |
| 16 | 0.31 | 0.04 | 865 | 0.670.11 | 48 |
| Aperture | /9 d.o.f. | P(F)aaP(F) denotes the F-test goodness-of-fit for inclusion of a broad component (see text for details). | VFWHM (km s-1 )bbThe Gaussian FWHM of the broad component. | IB/IN |
|---|---|---|---|---|
| 3+4 | 1.87 | 0.05 | 840 | 0.510.06 |
| 5+6 | 0.68 | 0.04 | 985 | 0.540.09 |
| 7+8+9 | 0.73 | 0.04 | 805 | 0.49 |
| 11+12 | 0.40 | 0.04 | 735 | 0.660.08 |
| 13+14 | 1.90 | 0.04 | 45060 | 0.44 |
| = | = 1 | Chandra Estimatesaa()0 is derived from X-ray spectral models of RGHW02. The appropriate shock speed for that equilibration is quoted in column 4. | |||||
|---|---|---|---|---|---|---|---|
| Aperture | VS (km s-1) | VS (km s-1) | VS (km s-1) | n0 (cm-3) | |||
| 3+4 (X1)bbNames of the corresponding X-ray spectral extraction regions used in the Chandra analysis of RGHW02. | 815 | 1055 | 855 | 0.45 | 0.24+0.12 | ||
| 5+6 (X2) | 960 | 1240 | 980 | 0.33 | 0.1+0.29 | ||
| 7+8+9 (X3) | 775 | 1005 | 775 | 0.48 | 0.01+0.03 | ||
| 11+12 (X4) | 710 | 915 | 785 | 0.47 | 0.46 | ||
| 13+14 (X5) | 430 | 555 | 555 | 1.30 | 1.0-0.16 |