,
Upper limits on neutrino masses from the 2dFGRS and WMAP: the role of priors
Abstract
Solar, atmospheric, and reactor neutrino experiments have confirmed neutrino oscillations, implying that neutrinos have non-zero mass, but without pinning down their absolute masses. While it is established that the effect of neutrinos on the evolution of cosmic structure is small, the upper limits derived from large-scale structure could help significantly to constrain the absolute scale of the neutrino masses. In a recent paper the 2dF Galaxy Redshift Survey (2dFGRS) team provided an upper limit , i.e. approximately 0.7 eV for each of the three neutrino flavours, or phrased in terms of their contribution to the matter density, . Here we discuss this analysis in greater detail, considering issues of assumed ‘priors’ like the matter density and the bias of the galaxy distribution with respect to the dark matter distribution. As the suppression of the power spectrum depends on the ratio , we find that the out-of-fashion Mixed Dark Matter model, with , and no cosmological constant, fits both the 2dFGRS power spectrum and the CMB data reasonably well, but only for a Hubble constant . As a consequence, excluding low values of the Hubble constant, e.g. with the HST Key Project, is important in order to get a strong upper limit on the neutrino masses. We also comment on the improved limit obtained by the WMAP team, and point out that the main neutrino signature comes from the 2dFGRS and the Lyman forest.
pacs:
95.35.+d, 14.60.Pq, 98.62.Py, 98.80.Es1 Introduction
The wealth of new data from e.g. the cosmic microwave background (CMB) and large-scale structure (LSS) in the last few years indicate that we live in a flat Universe where of the mass-energy density is in the form of dark energy, with matter making up the remaining 30 % . The WMAP data combined with other large-scale structure data [1] gives impressive support to this picture. Furthermore, the baryons contribute only a fraction ( and are, respectively, the contribution of baryons and of all matter to the total density in units of the critical density , where is the present value of the Hubble parameter) of this, so that most of the matter is dark. The exact nature of the dark matter in the Universe is still unknown. Relic neutrinos are abundant in the Universe, and from the observations of oscillations of solar and atmospheric neutrinos we know that neutrinos have a mass [2, 3, 4, 5, 6, 7, 8] and will make up a fraction of the dark matter. However, the oscillation experiments can only measure differences in the squared masses of the neutrinos, and not the absolute mass scale, so they cannot tell us how much of the dark matter is in neutrinos. From general arguments on structure formation in the Universe we know that most of the dark matter has to be cold, i.e. non-relativistic when it decoupled from the thermal background. Neutrinos with masses on the eV scale or below will be a hot component of the dark matter. If they were the dominant dark-matter component, structure in the Universe would have formed first at large scales, and smaller structures would form by fragmentation (the ‘top-down’ scenario). However, the combined observational and theoretical knowledge about large-scale structure gives strong evidence for the ‘bottom-up’ picture of structure formation, i.e. structure formed first at small scales. Hence, neutrinos cannot make up all of the dark matter (see [9] for a review). Neutrino experiments give some constraints on how much of the dark matter can be in the form of neutrinos. Studies of the energy spectrum in tritium decay [10] provide an upper limit on the electron neutrino mass of 2.2 eV (95 % confidence limit). For the effective neutrino mass scale involved in neutrinoless double beta decay an upper limit of 0.34 eV (90 % confidence) has been inferred [11] but then under the assumptions that neutrinos are Majorana particles (i.e. their own antiparticles), and the translation from the effective neutrino mass scale in neutrinoless double beta decay to neutrino mass eigenvalues requires assumptions about the neutrino mass hierarchy and the CP phases in the neutrino mixing matrix.
From cosmology, an analysis the 2dF Galaxy Redshift Survey [12] found as an upper limit on the sum of the (degenerate) mass eigenvalues. In [13] the 2dFGRS was combined with pre-WMAP CMB data to give an upper limit . The WMAP team [1] improved this result to (95 % confidence) from a combination of WMAP, ACBAR [14], CBI [15] for the CMB, and 2dFGRS and the power spectrum inferred from Lyman forest [16, 17] for large scale structure, a factor of roughly three better than the 2dFGRS limit (not an order of magnitude as stated in [1]). This limit is comparable to what the pioneering study in [19] predicted would be possible with the Sloan Digital Sky Survey [18] and WMAP [19], and have implications for neutrino oscillation experiments as it seems to call into question the Liquid Scintillator Neutrino Detector (LSND) result [20], where the mass-square difference involved was [21, 22]. (However, as pointed out in [23] it is premature to say that cosmology rules out the LSND results.) Note that neutrinos with eV masses are basically indistinguishable from cold dark matter at the epoch of last scattering, and therefore they have little effect on the CMB. The important role of the WMAP data in the cosmological neutrino mass limit is to break degeneracies in the parameter space that will otherwise limit the ability to constrain neutrino masses from the large-scale structure data.
In this paper we discuss in detail the recent cosmological neutrino mass limits, concentrating on the 2dFGRS and the WMAP + 2dFGRS limits and the various parameter degeneracies involved in the analysis. In particular we discuss the role of the bias of the galaxy distribution with respect to the mass distribution, non-linear effects, and the necessity of using independent information about cosmological parameters like and (‘priors’). We will throughout this paper work within the context of flat models, which are favoured by a wealth of observational data [1, 24, 13], however we also comment on Mixed Dark Matter (MDM) models in discussion of the analysis of the 2dFGRS data. In fact we find that an MDM model can still provide a reasonable fit to the 2dFGRS and WMAP data, although with a low Hubble constant, so that external constraints on the Hubble constant are important in order to get a strong upper limit on the neutrino masses.
The structure of this paper is as follows: in section 2 we give a brief overview of how neutrinos affect structure formation in the Universe. In section 3 we consider galaxy redshift surveys as a probe of neutrino masses, starting with a brief summary of the analysis in [12]. Since the exact relationship between the distribution of the galaxies and that of the dark matter is unknown, we discuss different ways of taking this uncertainty into account. We also discuss the role of priors on parameters degenerate with massive neutrinos. In section 4 we give a brief overview of other cosmological probes of neutrino masses before we summarize and conclude in section 5.
2 Massive neutrinos and structure formation
The relic abundance of neutrinos in the Universe today is straightforwardly found from the fact that they continue to follow the Fermi-Dirac distribution after freeze-out, and their temperature is given in terms of the CMB temperature today as ,
| (1) |
where , which gives at present. Neutrinos are so light that they were ultra-relativistic at freeze-out. Their present contribution to the mass density can therefore be found by multiplying with the total mass of the neutrinos , giving
| (2) |
for . Several effects could modify this simple relation. If any of the neutrino chemical potentials were initially non-zero, or there were a sizable neutrino-antineutrino asymmetry, this would increase the energy density in neutrinos and give an additional contribution to the radiation energy density. However, from Big Bang Nucleosynthesis (BBN) one gets a very tight limit on the electron neutrino chemical potential, since the electron neutrino is directly involved in the processes that set the neutron-to-proton ratio. Also, within the standard three-neutrino framework one can extend this limit to the other flavours as well. The recent results of the KamLAND experiment [25] confirmed the Large Mixing Angle (LMA) solution for the solar neutrino oscillations, and combined with the atmospheric data indicating maximal mixing in this sector, it has been shown that flavour equilibrium is established between all three neutrino species before the epoch of BBN [26, 27, 28], so that the BBN constraint on the electron neutrino asymmetry applies to all flavours, which in turn implies that the lepton asymmetry cannot be large enough to give a significant contribution to the radiation energy density. Recent analyses of WMAP and 2dFGRS data give independent, although not quite as strong, evidence for small lepton asymmetries [23, 29]. Within the standard picture, equation (1) should be accurate, and therefore any constraint on the cosmic mass density of neutrinos should translate straightforwardly into a constraint on the total neutrino mass, according to equation (2). If a fourth, light ‘sterile’ neutrino exists, sterile-active oscillations would modify this conclusion. No sterile neutrinos are required to explain the solar and atmospheric neutrino oscillation data [30], and the only hint so far comes from the possible detection of oscillations with a small mixing angle and a mass-square difference at the LSND [20]. Since there are only two independent mass-squared differences in the standard three-neutrino scenario, and they are orders of magnitude smaller, this hints at the existence of a fourth, light sterile neutrino. However, as said, this has little support in the solar and atmospheric data. The status of the LSND results will in the near future be clarified by the MiniBooNE experiment [31].
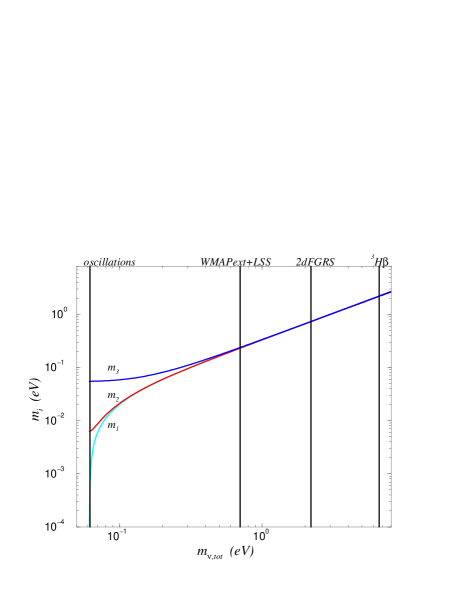
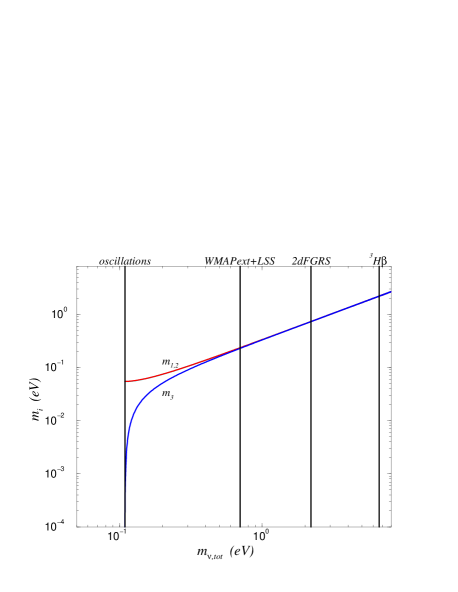
Finally, we assume that the neutrinos are nearly degenerate in mass. Current cosmological observations are sensitive to neutrino masses or greater. Since the mass-square differences are small, the assumption of a degenerate mass hierarchy is therefore justified. This is illustrated in figure 1, where we have plotted the mass eigenvalues as functions of for (solar) and (atmospheric), for the cases of a normal hierarchy (), and an inverted hierarchy (). As seen in the figure, for the mass eigenvalues are essentially degenerate.
We will in this paper look at cosmological models with four components: baryons, cold dark matter, massive neutrinos, and a cosmological constant. Furthermore, we restrict ourselves to adiabatic, linear perturbations. The basic physics is then fairly simple. A perturbation mode of a given wavelength can grow if it is greater than the Jeans wavelength determined by the balance of gravitation and pressure, or rms velocity in the case of massless particles. Above the Jeans scale, perturbations grow at the same rate independently of the scale. Long after matter-radiation equality, all interesting scales are above and grow at the same rate, and in models where all the dark matter is cold, the time and scale dependence of the power spectrum can therefore be separated at low redshifts. Light, massive neutrinos can, however, move unhindered out regions below a certain limiting length scale, and will therefore tend to damp a density perturbation at a rate which depends on their rms velocity. The presence of massive neutrinos therefore introduces a new length scale, given by the size of the co-moving Jeans length when the neutrinos became non-relativistic. In terms of the comoving wavenumber, this is given by
| (3) |
for three equal-mass neutrinos. The growth of Fourier modes with will be suppressed because of neutrino free-streaming. The free-streaming scale varies with the cosmological epoch, and the scale and time dependence of the power spectrum cannot be separated, in contrast to the situation for models with cold dark matter only.
The transfer functions of the perturbations in the various components provide a convenient way of describing their evolution on different scales. Using the redshift to measure time, the transfer function is formally defined as
| (4) |
where is the density perturbation with wavenumber at redshift , and is the linear growth factor. The normalization redshift corresponds to a time long before the scales of interested have entered the horizon. The transfer function thus gives the amplitude of a given mode at redshift relative to its initial value, and is normalized so that . The power spectrum of the matter fluctuations can be written as
| (5) |
where is the primordial spectrum of matter fluctuations, commonly assumed to be a simple power law , where is the amplitude and the spectral index is close to 1. It is also common to define power spectra for each component, see [32] for a discussion. Note that the transfer functions and power spectra are independent of the value of the cosmological constant as long as it does not shift the epoch of matter-radiation equality significantly.
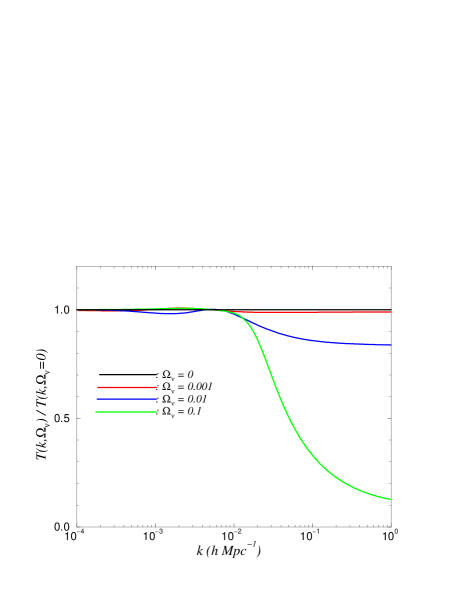
Accurate determination of the transfer function requires the solution of the coupled fluid and Boltzmann equations for the various components. This can be done using one of the publicly available codes, e.g. CMBFAST [33] or CAMB [34]. Analytical approximations are also available, and they are very useful when one wants very quick computation of transfer functions. Accurate fitting formulas for the transfer function were derived by [32]. These analytic approximations are good at realistic baryon fractions, i.e. 0.1-0.2, with the errors typically smaller than 4 %. In figure 2 we show the transfer functions for models with , , held constant, but with varying neutrino fraction. One can clearly see that the small-scale suppression of power becomes more pronounced as the neutrino fraction increases. The suppression of the power spectrum on small scales is roughly proportional to :
| (6) |
3 Constraining the total neutrino mass with the 2dFGRS
In an earlier short paper [12] we used the power spectrum of the galaxies as measured by the 2dFGRS to limit the fractional contribution to the matter density of massive neutrinos, and on their total mass . The present section starts with a short summary of the 2dFGRS and the analysis in [12] before going into a more detailed discussion of the various ingredients involved in the analysis. In [1] the WMAP team derived a stronger limit on the total neutrino mass than what was obtained from the 2dFGRS + various priors. However, the 2dFGRS power spectrum played a central role in the WMAP neutrino mass limit. As the CMB is insensitive to neutrino masses in the eV range, the main role of the WMAP data is to provide tight constraints on parameters that may otherwise partly mimic the effect of massive neutrinos on the matter power spectrum. Therefore our discussion of priors should also be of interest in understanding how the WMAP limit was obtained.
3.1 The 2dF Galaxy Redshift Survey
The 2dF Galaxy Redshift Survey [35] has measured the redshifts of more than 230 000 galaxies with a median redshift of . One of the main goals of the survey was to measure the galaxy power spectrum on scales up to a few hundred Mpc, thus filling in the gap between the small scales covered by earlier galaxy surveys and the largest scales where the power spectrum is constrained by observations of the CMB. A sample of the size of the 2dFGRS survey allows large-scale structure statistics to be measured with very small random errors. An initial estimate of the convolved, redshift-space power spectrum of the 2dFGRS has been determined [36] based on a sample of 140 000 redshifts. On scales the data are robust and the shape of the power spectrum is not affected by redshift-space or nonlinear effects, though the amplitude is increased by redshift-space distortions. One should bear in mind that what is measured is the convolution of the true galaxy power spectrum with the window function of the survey [36, 37],
| (7) |
where is the window function.
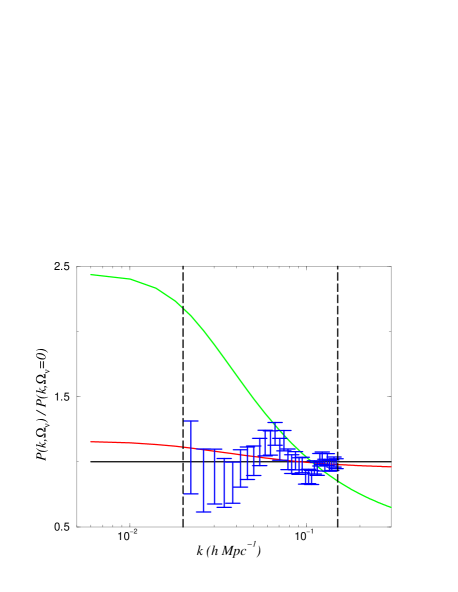
As an illustration of the potential of the 2dFGRS to constrain neutrino masses, we show in figure 3 the ratio of the power spectra for , and (all other parameters are fixed at their ‘concordance model’ values given in the figure caption) to the power spectrum for after they have been convolved with the survey window function, and their amplitudes fitted to the 2dFGRS power spectrum data. It is seen from figure 3 that the error bars on the power spectrum data points are correlated, as discussed in [36], and this is taken into account throughout this paper by using the full covariance matrix of the data when computing likelihoods. For the 32 data points, the -model had , gives ,whereas the model with provides a poor fit to the data with .
3.2 Previous results from the 2dFGRS
In [12] six parameters were used to describe the matter power spectrum:
-
•
The fraction of massive neutrinos (hot dark matter) .
-
•
The combination , which describes the shape of the cold dark matter power spectrum.
-
•
The baryon fraction .
-
•
The present value of the Hubble parameter .
-
•
The scalar spectral index of the primordial density perturbation spectrum, .
-
•
The amplitude of the galaxy power spectrum.
The amplitude is a free parameter to take into account the fact that what is measured is the power spectrum of galaxies, not of all the matter, and that it is measured in redshift space, not in real space. The latter effect has been shown in [36] to correspond to a shift in the amplitude of the spectrum. The first effect is parametrized by the so-called bias parameter
| (8) |
The scale-dependence of the bias factor is not well known. We will discuss this in more detail in a later subsection, for the time being we note that one would expect the relation between the distribution of dark matter and luminous matter to be simple on large scales. This is borne out by numerical simulations [38], and two independent analyses have shown that the 2dFGRS power spectrum is consistent with a constant bias on the scales relevant for our analysis [39, 40]. Thus, we took the redshift space distortions and the bias into account by leaving the amplitude of the power spectrum as a free parameter, which means that we used the shape of the 2dFGRS power spectrum, and not its amplitude, to constrain .
The main effect of the massive neutrinos is to reduce the power on scales smaller than the neutrino free-streaming scale. This effect may, however, be partially masked by other effects. Obviously, lowering the amplitude or the scalar spectral index will reduce the power. Also, the baryon fraction and interfere with the neutrino signal. Therefore, constraints on the neutrino mass from the galaxy power spectrum depends on the information we have about other parameters (‘priors’). In [12] we added constraints from independent cosmological probes: a Gaussian prior on the Hubble parameter , consistent with the results from the HST Hubble Key Project [41], a Gaussian prior on the physical baryon density from Big Bang Nucleosynthesis [42], and a Gaussian prior on the scalar spectral index. Furthermore, we considered two different priors on :
- •
-
•
A uniform (‘top hat’) prior in the range . Given our prior on , ensured that the ages of the Universes in the models considered were greater than 12 Gyr.
As noted earlier, the transfer function does not depend on and so the assumption enters only through the Supernova Type Ia prior on .
For each set of parameters, we computed the theoretical matter power spectrum, and obtained the for the model given the 2dFGRS power spectrum. We then calculated the joint probability distribution function for and (which represents the shape of the CDM power spectrum) by marginalizing over and weighted by the priors given above. For we used a uniform prior in the interval , where corresponds to the normalization of the ‘concordance model’, discussed in [39]. Using instead a prior uniform in , or fixing at the best-fit value had virtually no effect on the results.

Figure 4 shows the probability distributions for for three different values of . Marginalizing over using the uniform prior on , we got an upper limit at 95% confidence for . Increasing increases power on small scales and leaves more room for suppression by the massive neutrinos, and and upon marginalizing over the full range of with a prior we found at 95 % confidence. For this corresponds to a total neutrino mass . The results with the Supernova Type Ia prior on were identical. For comparison, marginalizing without any priors, the limit becomes . Adding just a prior on , we find , so this is clearly the most important prior. Marginalizing with just a prior on or on , the 95 % confidence limit becomes . Clearly the priors play a crucial role in the analysis, and we will discuss their role in the next subsections. To facilitate the comparison with the WMAP analysis in [1] we will from now on carry out our analysis in terms of the physical densities , where , , .
3.3 The prior on
As noted above, the prior on the matter density is crucial, and the tight correlation between and is illustrated in figure 5.

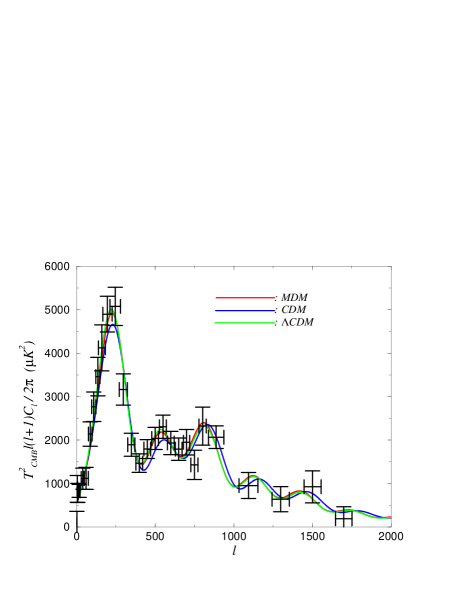
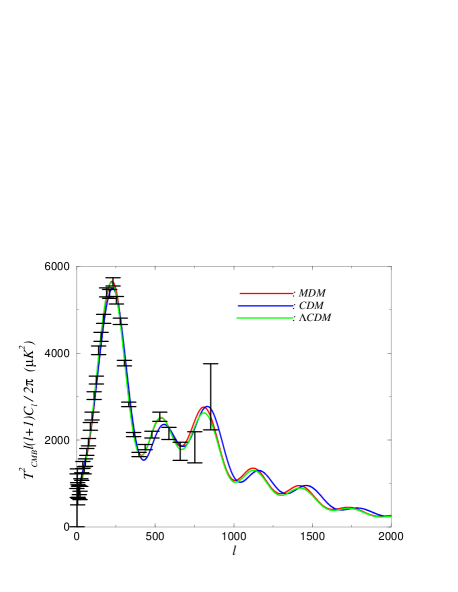
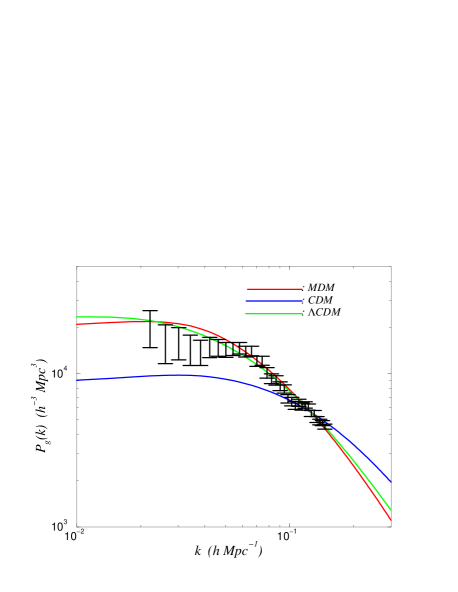
In fact, without a prior on no non-trivial upper limit on is obtained (but note that one still finds an upper limit on ). WMAP provides a constraint for spatially flat models, but it is interesting to note that one from the CMB and 2dFGRS alone cannot rule out models with . To illustrate this point, we consider the following three models, all with :
-
1.
A Mixed Dark Matter (MDM) model with , , , and . The neutrino mass fraction is thus .
-
2.
A model with , , , and .
-
3.
A pure CDM model with , , , and .
For the pre-WMAP CMB, we use the recent compilation in [45]. Model 1 has for the CMB (28 points) and for the 32 2dFGRS power spectrum data points. Model 2 has for the CMB, for the 2dFGRS. The WMAP data discriminate better between these two models, Model 1 having (899 points) and model 2 , but we see from figure 6 that the models are look reasonable and note that we have not carried out any systematic search for a best-fitting model of the three types. Thus, the first two models seem to offer acceptable descriptions of the CMB and 2dFGRS data, and from these data alone MDM is still a viable alternative to the ‘concordance’ . So why did several pre-WMAP studies find that the CMB and 2dFGRS prefer a low matter density and a cosmological constant ? This is because they considered (very reasonably) neutrinos to be essentially massless. Model 3 illustrates the point: it is a pure CDM model with massless neutrinos. It gives a reasonable description of the CMB data, but has for the 2dFGRS data points, and hence it will be disfavoured in a joint analysis. The CMB cannot distinguish between eV-mass neutrinos and cold dark matter, and hence model 1 and 3 provide comparable descriptions of the CMB data, but the galaxy power spectrum does distinguish between the two, and massive neutrinos provides the necessary reduction in small-scale power to fit the data points. Of course, one cannot look at the CMB and 2dFGRS data alone, and it is not our intention to ‘resuurect’ the MDM model: it has problems with the evolution of cluster abundances with redshift [46], needs a low value of the Hubble parameter, and is clearly at variance with independent measurements from e.g. the baryon fraction in clusters [47], but we wish to make the two following points:
- •
-
•
The statement that CMB + 2dFGRS alone provides evidence independent of that of supernovae Type Ia for a cosmological constant/dark energy is too strong. This result is obtained only when neutrino masses are assumed to be negligible. If one allows for massive neutrinos, acceptable fits to the CMB+2dFGRS can be obtained with and .
3.4 The prior on the Hubble parameter
We saw in the previous subsection that if we low values of the Hubble constant, , MDM models provide reasonable fits to the CMB and 2dFGRS power spectra, but by combining with the HST prior on , one will obtain the by now usual ‘concordance’ values , . The derivation of a strong upper limit on the total neutrino mass therefore depends on our ability to exclude values of much below 0.7. Figure 7 shows the degeneracy between and .

If we allow , and drop the prior on , we find that a universe with a low value of is a viable option if the total neutrino mass is a few eVs. Note that these models also have ages , consistent with ages of globular clusters [48]. Thus, without a prior on , the CMB prior on would have been weaker, and which would also have affected the upper limit on the neutrino masses.
3.5 The prior on the scalar spectral index
As noted earlier, there is also a degeneracy between the scalar spectral index and , illustrated in figure 8.

Motivated by the pre-WMAP CMB data we used a prior in [12]. For flat models the WMAP data give (see table 1 in [1]), but in their full analysis including other datasets there is some evidence for a running scalar spectral index. However, it has been argued that this may be because of their treatment of the Lyman forest power spectrum, and that in a more conservative approach one finds that a scale-invariant primordial power spectrum, is consistent with the data [49]. We will therefore not consider a running spectral index in this paper.
3.6 The prior on the baryon density
There is also some degeneracy between the baryon density and the neutrino masses, as shown in figure 9, because increasing the baryon density suppresses power on small scales.

The degeneracy is, however, less serious than for the other parameters, and WMAP provides a tight constraint on from the ratio of the amplitudes of the first and second peaks in the CMB power spectrum, , consistent with standard BBN [42].
3.7 Non-linear fluctuations
At small scales, one eventually enters the regime where the power spectrum is no longer linear. Therefore, as a further test of the stability of our analysis in [12], we used the full set of priors, but only the power spectrum data at scales and found that the limit increased to . Cutting the power spectrum at this scale is, however, very conservative. To see this, we follow the analysis of non-linearities in [50]. Defining
| (9) |
the crossover from linear to non-linear behaviour is at the co-moving momentum where . This corresponds roughly to the point where . We use the approximate relation between the the linear and non-linear spectrum found by [51]. The cut in the spectrum should be made where the non-linear effects are of the same order as the suppression of small scale-power from massive neutrinos, which is given by equation (6). For neutrino masses , this gives . We chose in our analysis, and at that point . Crude as this argument may be, it clearly indicates that the neutrino mass signal dominates possible non-linear effects in the 2dFGRS power spectrum data used in our analysis. We note that the linear matter power spectrum is convolved with the survey window function before comparison with the data. However, for values of greater than the window function is sharply peaked at , and so there is little mixing with smaller scales [37]. The WMAP team went one step further and considered non-linear corrections at the smallest scales in the analysis. Nevertheless, one would expect these effects to be small for .
3.8 Scale-dependent bias
The power spectrum of the galaxy distribution might be ‘biased’ relative to the matter power spectrum, hence it might introduce systematic error in the estimation of the neutrino mass.
Indeed it is well established that on scales less than different galaxy populations exhibit different clustering amplitudes, the so-called morphology-density relation (e.g. [52, 53, 54, 55]). Hierarchical merging scenarios also suggest a more complicated picture of biasing as it could be non-linear, scale-dependent and stochastic (e.g. [38, 56, 57, 58, 59, 60, 61]. But is the biasing still scale-dependent at the large scales () where we analyse the 2dFGRS power spectrum ? Let us consider the ratio of galaxy to matter power spectra, and use the ratio of these to define the bias parameter as in equation (8). To illustrate the dramatic effect that scale-dependent might have we assume the following simple form:
| (10) |
where we fix (note that a shift in can be absorbed in a change in ), but allow and to vary.
Analysis of the semi-analytic galaxy formation models in [62] shows that on large scales the biasing function is nearly constant to high degree. In our parameterization (10) even the brightest galaxies (, where is the characteristic luminosity of the Schechter luminosity function) are weakly biased, with slope over the scales [63]. The simulations in [60] also suggest scale-independent biasing on scales larger than 10 at late times.
Observationally, the bi-spectrum analysis of the 2dFGRS showed almost no deviation from linear biasing [40] and combined analysis of 2dFGRS with CMB data on scales of [39] gave for galaxies. Furthermore, the ratio of the power-spectra of blue and red galaxies in 2dFGRS [64] is almost constant over the range of our analysis, . This suggests (as a necessary, but not sufficient condition) that the galaxy power spectrum is proportional to the underlying matter power spectrum. Based on these theoretical and observational studies we argue that scale-dependent biasing is unlikely to pose a problem in estimating the neutrino mass from the 2dFGRS.
We then redo the analysis of the 2dFGRS with , and as free parameters. The remaining parameters are fixed at their ‘concordance’ values (, etc.). We distinguish between two cases: (bias increasing with length-scale and (bias decreasing with length-scale). In the first case, the best fit is found at , , whereas in the second case one finds the best fit for , , , i.e. for a non-zero neutrino mass . This is understandable, since in this case has the opposite effect of massive neutrinos, so the two effects can be ‘tuned’ to give a very good fit to the 2dFGRS data with a non-zero neutrino mass which is unrealistically high. Figure 10 shows the likelihood contours in the - plane.

As argued above, simulations and observations argue for at large scales, and in what follows we shall assume constant biasing.
3.9 The case of scale-independent bias in more detail
WMAP provides tight constraints on , , , and , and we have seen in previous subsections that having good constraints on these parameters is essential to obtaining a good upper limit on . Also, from the CMB one can constrain the amplitude of the matter power spectrum (quoted, e.g. in terms of the rms mass fluctuations in spheres of radius , ). If the biasing and redshift-space distortions were known, then this would translate directly to a constraint on the amplitude of the 2dFGRS power spectrum, and could potentially tighten the constraint on . The WMAP analysis makes use of the constraint on the amplitude of the matter power spectrum from the CMB by introducing a prior on the bias parameter, taking it to be a Gaussian with [65] as found in the analysis of the 2dFGRS bispectrum [40]. As the analysis in [40] was performed for a different range of scales than those involved in the analysis of the linear part of the 2dFGRS power spectrum, and did not take neutrino masses into account (even though the cosmology dependence in the bispectrum analysis is mild) and questions have been raised about this approach [66], it is worthwhile to take a closer look at the WMAP approach. To do this, we need to go into the issue of a constant bias and redshift-space distortions in more detail than in the previous sections, and we will do so following [39]. The WMAP analysis was more detailed [65], but we think that our simplified version captures the main points.
We now need to take two effects into account: the fact that the 2dFGRS power spectrum is given in redshift space, and that the galaxy distribution may be biased with respect to the mass distribution. At redshift , the relation between the real-space normalization at redshift 0, , of the matter power spectrum and the normalization of the galaxy power spectrum is given by
| (11) |
where for the 2dFGRS. We follow [39] and assume that galaxy clustering evolves weakly in the range of redshifts so that , where . The conversion of from real space to redshift space is determined by
| (12) |
where
| (13) |
is Kaiser’s factor [67], and
| (14) |
with
| (15) |
Furthermore, we assume that the mass fluctuations grow as , where is the linear growth rate (normalized to 1 at ). As pointed out earlier, the linear growth rate is actually scale dependent in models with massive neutrinos. We have checked that this scale dependence is weak for the parameter range we consider, and evaluated at , where is the mean value of for a spherical top-hat window function. With these assumptions we have
| (16) |
Given , we can translate a given normalization of the matter power spectrum to for the galaxy power spectrum.
We now carry out the following simple analysis: we fix , (all values taken from table 1 in [1] for WMAP alone), and fit , , , and to the combination of the 2dFGRS power spectrum data and the constraint from table 2 in [1]. Furthermore, we add Gaussian priors , from WMAP, and look at the limit on for the cases of with and without a prior on . The results reveal that the prior on is crucial and the prior on very important, but also that, at least in this simplified analysis, the effect of adding a prior on the bias is very small, as can be seen from figure 11. Without a prior on , no non-trivial limit on is obtained. With just the prior, the 95 % confidence limit is , and this improves to when the prior on is added. Adding the prior on does not change the limit on , it stays at . From the contour plots in figure 12, the degeneracy between and is small, especially when the prior on is included.


This is not in contradiction to the analysis in [23], because our treatment of biasing is different: we have treated the redshift-space distortions explicitly, and then the constraint on and from the CMB breaks much of the degeneracy between and . This is because the redshift distortion itself depends on , see equations (13,14).
In this simple analysis we get a 95 % confidence limit of . This is still some way from the WMAP limit of 0.71 eV, even with our very restricted parameter space, but consistent with the analysis in [23]. The WMAP analysis also used data from ACBAR and CBI [14, 15], and included the Lyman forest power spectrum. The linear matter power spectrum inferred from the Lyman fores probes smaller scales than the 2dFGRS and therefore has considerable power in constraining neutrino masses. We have seen that the most severe degeneracies of are with , , , and . The most serious one is with : without a prior on the physical matter density, one cannot get a non-trivial upper bound on . This makes sense, as the matter power spectrum depends on and this is why the analysis was carried out in terms of this parameter in [12]. So the fact that WMAP (restricted to flat models and ) provides a tight constraint is crucial for constraining neutrino masses. WMAP also constrains the spectral index to a narrow interval around , and, just as importantly, by constraining to be around 0.7 eliminates the possibility for MDM models with large neutrino masses to give good fits to the 2dFGRS power spectrum. The importance of the prior on was also noted in [23].
4 Other cosmological probes of neutrino masses
Direct probes of the total matter distribution avoid the issue of biasing and are therefore ideally suited for providing limits on the neutrino masses. Several ideas for how this can be done exist. In [68] the normalization of the matter power spectrum on large scales derived from COBE was combined with constraints on from cluster abundances and a constraint obtained, although with a fairly restricted parameter space. However, is probably one of the most debated numbers in cosmology at the moment [45], and a better understanding of systematic uncertainties connected with the various methods for extracting it from observations is needed before this method can provide useful constraints. The potential of this method to push the value of the mass limit down also depends on the actual value of : the higher turns out to be, the less room there will be for massive neutrinos. The evolution of cluster abundance with redshift may provide further constraints on neutrino masses [46]. The Lyman forest provides constraints on the matter power spectrum on small scales, where the effect of massive neutrinos is most visible, and it was used in [69] to derive a limit , and it clearly played a role in the WMAP limit also. How to use this probe correctly in cosmological parameter estimation is, however, still being discussed [49]. Massive neutrinos also suppress peculiar velocities on scales smaller than , where they can be measured more accurately to nearby galaxies, however, non-linear effects on small scales causes complications. Finally, deep and wide weak lensing surveys will in the future make it possible to do weak lensing tomography of the matter density field [70, 71], and in [72] it has been shown that one can probe neutrino masses below in this way. However, this is under the assumption that the equation of state of the dark energy is known.
5 Conclusions
We have reviewed how the constraint on the neutrino mass in [12] was obtained, and the recent improved limit from WMAP, paying attention to issues of priors and parameter degeneracies. We have seen that one can derive fairly tight constraints on neutrino masses from the 2dFGRS power spectrum, provided that one has good constraints on , , , and from independent data sets.
We found that external constraints on the Hubble parameter, for example the HST Key project, is important in order to get a strong limit on the neutrino mass since, intriguingly, the out-of-fashion Mixed Dark Matter (MDM) model can give a reasonable description of the CMB and 2dFGRS data with , and no cosmological constant if we allow low values of the Hubble parameter, . The importance of having a prior on was also noted in [23]. We note that the above MDM model is inconsistent with other cosmic measurements such as Supernovae Type Ia, baryon fraction in clusters, and the evolution of cluster abundance with redshift, so adding any one of these datasets to the analysis would eliminate MDM and improve the neutrino mass limit.
We also considered the effect of the possible bias of the galaxy distribution with respect to the mass distribution on the neutrino mass limit. A scale-dependent bias has serious implications for the constraint, but based on semi-analytic galaxy formation models [62] the scale-dependence of the bias is expected to be too weak to be of any major concern on the large scales used in the analysis of the 2dFGRS power spectrum. When the effects of redshift-space distortions on the 2dFGRS power spectrum are included in the analysis, there is almost no degeneracy between a constant, scale-independent bias factor and the neutrino mass. However, in our restricted analysis we did not get as good a neutrino mass constraint with 2dFGRS + WMAP priors as in the full analysis in [1] which suggests that the Lyman forest power spectrum plays a role in pushing the constraint on below 1 eV.
References
References
- [1] Spergel D N, Verde L, Peiris H V, Komatsu E, Nolta M R, Bennett C L, Halpern M, Hinshaw G, Jarosik N, Kogut A, Limon M, Meyer S S, Page L, Tucker G S, Weiland J L , Wollack E, and Wright E L, First Year Wilkinson Microwave Anisotropy Probe (WMAP) Observations: Determination of Cosmological Parameters, 2003 Preprint astro-ph/0302209
- [2] Abdurashitov J N et al., Measurement of the solar neutrino capture rate with gallium metal, 1999 Phys. Rev. C 60 055801 [astro-ph/9907113]
- [3] Ahmad Q R et al., Measurement of the rate of interactions produced by solar neutrinos at the Sudbury Neutrino Observatory, 2001 Phys. Rev. Lett. 87 071301 [nucl-ex/0106015]
- [4] Ambrosia M et al., Matter effects in upward-going muons and sterile neutrino oscillations, 2001 Phys. Lett. B 517 59 [hep-ex/0106049]
- [5] Altmann M et al., GNO solar neutrino observations: results for GNO I, 2000 Phys. Lett. B 490 16 [hep-ex/0006034]
- [6] Cleveland B T et al., Measurement of the solar electron neutrino flux with the Homestake Chlorine Detector, 1998 Astrophys. J. 496 505
- [7] Fukuda S et al., Tau neutrinos favored over sterile neutrinos in athmospheric muon neutrino oscillations, 2000 Phys. Rev. Lett. 85 3999
- [8] The Gallex collaboration, GALLEX solar neutrino observations: results for GALLEX IV. 1999 Phys. Lett. B 447 127
- [9] Primack J R and Gross M A K, Hot Dark Matter in Cosmology, 2000 Current Aspects of Neutrino Physics (Berlin: Springer) p 287 [astro-ph/0007165]
- [10] Bonn J et al., The Mainz Neutrino Mass Experiment, 2001 Nucl. Phys. Proc. Suppl. 91 273
- [11] Klapdor-Kleingrothaus H V et al., Latest results from the HEIDELBERG-MOSCOW double beta decay experiment, 2001 Eur. Phys. J. A 12 147 [hep-ph/0103062]
- [12] Elgarøy Ø. et al. (the 2dFGRS team), New upper limit on the total neutrino mass from the 2 degree Field Galaxy Redshift Survey, 2002 Phys. Rev. Lett. 89 061301 [astro-ph/0204152]
- [13] Lewis A and Bridle S L, Cosmological parameters from CMB and other data: A Monte Carlo approach, 2002 Phys. Rev. D 66 103511 [astro-ph/0205436]
- [14] Kuo C L, Ade P A R, Bock J J, Cantalupo C, Daub M D, Goldstein J, Holzapfel W L, Lange A E, Lueker M, Newcomb M, Peterson J B, Ruhl J, Runyan M C and Torbet E 2002, High resolution observations of the CMB power spectrum with ACBAR, 2002 Preprint astro-ph/0212289
- [15] Pearson T J et al. (the CBI team), The anisotropy of the microwave background to : Mosaic observations with the Cosmic Microwave Background Imager, 2002 Preprint astro-ph/0205388
- [16] Croft R A C, Weinberg D H, Bolte M, Burles S, Hernquist L, Katz N, Kirkman D and Tytler D, Toward a precise measurement of matter clustering: Ly forest data at redshifts 2-4, 2002 Astrophys. J. 581 20 [astro-ph/0012324]
- [17] Gnedin N Y and Hamilton A J S, Matter power spectrum from the Lyman-alpha forest: myth or reality ?, 2002 Mon. Not. R. Astron. Soc. 334 107 [astro-ph/0111194]
- [18] http://www.sdss.org
- [19] Hu W, Eisenstein D and Tegmark M, Weighing neutrinos with galaxy surveys, 1998 Phys. Rev. Lett. 80 5255 [astro-ph/9712057]
- [20] Aguilar A et al. (the LSND collaboration), Evidence for neutrino oscillations from the observation of appearance in a beam, 2001 Phys. Rev. D 64 112007 [hep-ex/0104049]
- [21] Pierce A and Murayama H, WMAPping out neutrino masses, 2003 Preprint hep-ph/0302131
- [22] Bhattacharyya G, Päs H, Song L and Weiler T J, Particle physics implications of the WMAP neutrino mass bound, 2003 Preprint hep-ph/0302191.
- [23] Hannestad S, Neutrino masses and the number of neutrino species from WMAP and 2dFGRS, 2003 Preprint astro-ph/0303076
- [24] Efstathiou G P et al. (the 2dFGRS team), Evidence for a non-zero and a low matter density from a combined analysis of the 2dF Galaxy Redshift Survey and cosmic microwave background anisotropies, 2002 Mon. Not. R. Astron. Soc. 330 L29 [astro-ph/0109152]
- [25] Eguchi K et al. (the KamLAND collaboration), First results from KamLAND: Evidence for Antineutrino Disappearance, 2003 Phys. Rev. Lett. 90 021802 [hep-ex/0212021]
- [26] Dolgov A D, Hansen S H, Pastor S, Petcov S T, Raffelt G G and Semikoz D V, Cosmological bounds on neutrino degeneracy improved by flavor oscillations, 2002 Nucl. Phys. B 632 363 [hep-ph/0201287]
- [27] Wong Y Y Y, Analytical treatment of neutrino asymmetry equilibration from flavor oscillations in the early universe, 2002 Phys. Rev. D 66 025015 [hep-ph/0203180]
- [28] Abazajian K N, Beacom J F and Bell N F, Stringent constraints on cosmological neutrino-antineutrino asymmetries from synchronized flavor transformation, 2002 Phys. Rev. D 66, 013008 [astro-ph/0203442]
- [29] Pierpaoli E, Constraints on the cosmic neutrino background, 2003 Preprint astro-ph/0302465
- [30] Pakvasa S and Valle J W F, Neutrino properties before and after KamLAND, 2003 Preprint hep-ph/0301061
- [31] Bazarko A et al. (the MiniBooNE collaboration), MiniBooNE: Status of the Booster Neutrino Experiment, 2000 Nucl. Phys. B. Proc. Suppl. 91 210 [hep-ex/0009056]
- [32] Eisenstein D J and Hu W, Power spectra for Cold Dark Matter and its variants, 1999 Astrophys. J. 511 5 [astro-ph/9710252]
- [33] Seljak U and Zaldarriaga M, A line-of-sight integration approach to cosmic microwave background anisotropies, 1996 Astrophys. J. 469 437 [astro-ph/9603033]
- [34] Lewis A, Challinor A and Lasenby A, Efficient computation of cosmic microwave background anisotropies in closed Friedmann-Robertson-Walker models, 2000 Astrophys. J. 538, 473 [astro-ph/9911177]
- [35] Colless M et al. (the 2dFGRS team), The 2dF Galaxy Redshift Survey: spectra and redshifts, 2001 Mon. Not. R. Astron. Soc. 328 1039 [astro-ph/0106498]
- [36] Percival W J et al. (the 2dFGRS team), The 2dF Galaxy Redshift Survey: The power spectrum and the matter content of the universe, 2001 Mon. Not. R. Astron. Soc. 327 1297 [astro-ph/0105252]
- [37] Elgarøy Ø, Gramann M and Lahav O, Features in the primordial power spectrum: constraints from the cosmic microwave background and the limitation of the 2dF and SDSS redshift surveys to detect them, 2002 Mon. Not. R. Astron. Soc. 333 93 [astro-ph/0111208]
- [38] Benson A J, Cole S, Frenk C S, Baugh C M and Lacey C G, The nature of galaxy bias and clustering, 2000 Mon. Not. R. Astron. Soc. 311 793 [astro-ph/9903343]
- [39] Lahav O et al. (the 2dFGRS team), The 2dF Galaxy Redshift Survey: the amplitudes of fluctuations in the 2dFGRS and the CMB, and implications for galaxy biasing, 2002 Mon. Not. R. Astron. Soc. 333 961 [astro-ph/0112162]
- [40] Verde L et al (the 2dFGRS team), The 2dF Galaxy Redshift Survey: the bias of galaxies and the density of the Universe, 2002 Mon. Not. R. Astron. Soc. 335 432 [astro-ph/0112161]
- [41] Freedman W L et al., Final results from the Hubble Space Telescope Key Project to measure the Hubble constant, 2001 Astrophys. J 553 47 [astro-ph/0012376]
- [42] Burles S, Nollett K M and Turner M S, What is the big-bang-nucleosynthesis prediction for the baryon density and how reliable is it ?, 2001 Phys. Rev. D 63 063512 [astro-ph/0008495]
- [43] Perlmutter S et al., Measurements of Omega and Lambda from 42 high-redshift supernovae, 1999 Astrophys. J. 517 565 [astro-ph/9812133]
- [44] Riess A G et al, BVRI light curves for 22 Type IA supernovae, 1999 Astronom. J. 117 707 [astro-ph/9810291]
- [45] Wang X, Tegmark M, Jain B and Zaldarriaga M, The last stand before MAP: cosmological parameters from lensing, CMB and galaxy clustering, 2002 Preprint astro-ph/0212417
- [46] Arhipova N A, Kahniashvili T and Lukash V N, Abundance and evolution of galaxy clusters in cosmological models with massive neutrino, 2002 Astron. Astrophys. 386 775 [astro-ph/0110426]
- [47] Erdogdu P, Ettori S and Lahav O, ‘Hyper Parameters’ approach to joint estimation: applications to Cepheid-calibrated distances and X-ray clusters, 2003 Mon. Not. R. Astron. Soc. in press [astro-ph/0202357]
- [48] Krauss L M and Chaboyer B, Age estimates of globular clusters in the Milky Way: constraints on cosmology, 2003 Science 299 65
- [49] Seljak U, McDonald P and Makarov A, Cosmological constraints from the CMB and Ly-alpha forest revisited, 2003 Preprint astro-ph/0302571
- [50] Hannestad S, Can cosmology detect hierarchical neutrino masses ?, 2002 Preprint astro-ph/0211106
- [51] Peacock J A and Dodds S J, Reconstructing the linear power spectrum of cosmological mass fluctuations, 1994 Mon. Not. R. Astron. Soc. 267 1020 [astro-ph/9311057]
- [52] Dressler A, Galaxy morphology in rich clusters-Implications for the formation and evolution of galaxies, 1980 Astrophys. J. 236 351
- [53] Hermit S, Santiago B X, Lahav O, Strauss M A, Davis M, Dressler A and Huchra J P, The two-point correlation function and morphological segregation in the Optical Redshift Survey, 1996 Mon. Not. R. Astron. Soc. 283 709 [astro-ph/9608001]
- [54] Norberg P et al. (the 2dFGRS team), The 2dF Galaxy Redshift Survey: the dependence of galaxy clustering on luminosity and spectral type, 2002 Mon. Not. R. Astron. Soc. 332 827 [astro-ph/0112043]
- [55] Zehavi I et al. (SDSS Collaboration), Galaxy clustering in early Sloan Digital Sky Survey Redshift data, 2002 Astrophys. J. 571 172 [astro-ph/0106476]
- [56] Mo H J and White S D M, An analytic model for the spatial clustering of dark matter haloes, 1996 Mon. Not. R. Astron. Soc. 282 347 [astro-ph/9512127]
- [57] Matarrese S, Coles P, Lucchin F and Moscardini L, Redshift evolution of clustering, 1997 Mon. Not. R. Astron. Soc. 286 115 [astro-ph/9608004]
- [58] Magliochetti M, Bagla J, Maddox S J and Lahav O, The observed evolution of galaxy clustering vs. epoch-dependent biasing models, 2000 Mon. Not. R. Astron. Soc. 314 546 [astro-ph/9902260]
- [59] Dekel A and Lahav O, Stochastic nonlinear galaxy biasing, 1999 Astrophys. J. 520 24 [astro-ph/9806193]
- [60] Blanton M, Cen R, Ostriker J P, Strauss M A and Tegmark M, Time evolution of galaxy formatino and bias in cosmological simulations, 2000 Astrophys. J. 531 1 [astro-ph/9903165]
- [61] Somerville R, Lemson G, Sigad Y, Dekel A, Colberg J, Kauffmann G and White S D M, Non-linear stochastic galaxy biasing in cosmological simulations, 2001 Mon. Not. R. Astron. Soc. 320 289 [astro-ph/9912073]
- [62] Berlind A A, Weinberg D H, Benson A J, Baugh C M, Cole S, Davé R, Frenk C S, Katz N and Lacey C G, The halo occupation distribution and the physics of galaxy formation, 2002 Preprint astro-ph/0212357
- [63] Berlind A A, private communication; the models themselves are similar to those in [38].
- [64] Peacock J A, Implications of 2dFGRS results on cosmic structure, 2003 Preprint astro-ph/0301042
- [65] Verde L et al. (the WMAP team), First year Wilkinson Microwave Anisotropy Probe (WMAP) observations: parameter estimatino methodology, 2003 Preprint astro-ph/0302218
- [66] G. G. Raffelt, Neutrinos in physics and astrophysics, 2003 Preprint astro-ph/0302589
- [67] Kaiser N, Clustering in real space and in redshift space, 1987 Mon. Not. R. Astron. Soc. 227 1
- [68] Fukugita M, Liu G-C and Sugiyama N, Limits on neutrino mass from cosmic structure formation, 2000 Phys. Rev. Lett. 84 1082 [astro-ph/9908450]
- [69] Croft R A C, Hu W and Davé R, Cosmological limits on the neutrino mass from the LyAlpha forest, 1999 Phys. Rev. Lett. 83 1092 [astro-ph/9903335]
- [70] Hu W, Power spectrum tomography with weak lensing, 1999 Astrophys. J. 522 21 [astro-ph/9904152]
- [71] Hu W, Dark energy and matter evolution from lensing tomography, 2002 Phys. Rev. D 66 083515 [astro-ph/0208093]
- [72] Abazajian K N and Dodelson S, Neutrino mass and dark energy from weak lensing, 2002 Preprint astro-ph/0212216