Physical Structure of Planetary Nebulae. I. The Owl Nebula11affiliation: Based on observations made with the William Herschell Telescope operated on the island of La Palma by the Isaac Newton Group in the Spanish Observatorio del Roque de Los Muchachos of the Instituto de Astrofísica de Canarias, and with the Burrell Schmidt Telescope of the Warner and Swasey Observatory, Case Western Reserve University.
Abstract
The Owl Nebula is a triple-shell planetary nebula with the outermost shell being a faint bow-shaped halo. We have obtained deep narrow-band images and high-dispersion echelle spectra in the H, [O iii], and [N ii] emission lines to determine the physical structure of each shell in the nebula. These spatio-kinematic data allow us to rule out hydrodynamic models that can reproduce only the nebular morphology. Our analysis shows that the inner shell of the main nebula is slightly elongated with a bipolar cavity along its major axis, the outer nebula is a filled envelope co-expanding with the inner shell at 40 km s-1, and the halo has been braked by the interstellar medium as the Owl Nebula moves through it. To explain the morphology and kinematics of the Owl Nebula, we suggest the following scenario for its formation and evolution. The early mass loss at the TP-AGB phase forms the halo, and the superwind at the end of the AGB phase forms the main nebula. The subsequent fast stellar wind compressed the superwind to form the inner shell and excavated an elongated cavity at the center, but has ceased in the past. At the current old age, the inner shell is backfilling the central cavity.
1 Introduction
Planetary nebulae (PNs) consist of stellar material ejected by low- and intermediate-mass stars at late evolutionary stages. As these stars lose mass via dense slow winds at the asymptotic giant branch (AGB) phase followed by tenuous fast winds, the dynamic interactions between the fast and slow winds produce the shell structure of PNs. A wide variety of morphologies has been observed in PNs. These morphologies can be successfully reproduced by hydrodynamical models of interacting stellar winds; however, a nebular morphology can often be reproduced similarly well by several models with different physical structures and geometries, indicating that morphology alone cannot constrain the models adequately. Spatio-kinematic data provide additional constraints to models, but only few PNs have such observations for critical comparisons. Therefore, we have started a program to analyze high-resolution images and high-dispersion spectra of PNs in multiple nebular lines, in order to determine the physical structure of PNs. By comparing the results with hydrodynamical models, we hope to understand better the formation and evolution of PNs.
The first PN we have analyzed is NGC 3587, better known as the “Owl Nebula” because of its morphological resemblance to an owl’s face. The large angular size () and symmetrical morphology of the Owl Nebula allow us to analyze its physical structure in detail even using ground-based imaging and spectroscopic observations. The Owl Nebula is a triple-shell PN, consisting of a round double-shell main nebula and a faint bow-shaped outer halo (Chu, Jacoby, & Arendt, 1987; Kwitter, Chu, & Downes, 1992). The morphology of the halo suggests an interaction with the surrounding interstellar medium (ISM). Thus the Owl Nebula provides a rare opportunity for us to probe the extended mass loss history and the dissipation of a PN into the ISM. However, because of its low surface brightness, previously there was only one spatio-kinematic study of the Owl Nebula (Sabbadin et al., 1985) and it was limited to only the bright inner shell of the main nebula. We have obtained long-slit, high-dispersion spectroscopic observations and narrow-band images of the Owl Nebula in the H, [O iii] 5007, and [N ii] 6583 emission lines. These data have been used to construct a spatio-kinematic model of the main nebula, and to gain insights into the structure and nature of the halo. The results of our analyses are reported in this paper.
2 Observations
Narrow-band images of the Owl Nebula in the H, [O iii] 5007, and [N ii] 6583 emission lines were obtained in 1991 June with the 0.6 m Burrell Schmidt Telescope at Kitt Peak National Observatory (KPNO). The central wavelengths and FWHMs of the interference filters are 6558 Å and 20 Å for H, 4998 Å and 23 Å for [O iii], and 6582 Å and 21 Å for [N ii]. The transmission of the H filter at 6583 Å is of that at 6563 Å, while the transmission of the [N ii] filter at 6563 Å is of that at 6583 Å. With a [N ii] 6583 to H line ratio of (Kwitter & Henry, 2001), we expect the H image to be contaminated by the [N ii] line at level, and the [N ii] image by the H line at a similar level.
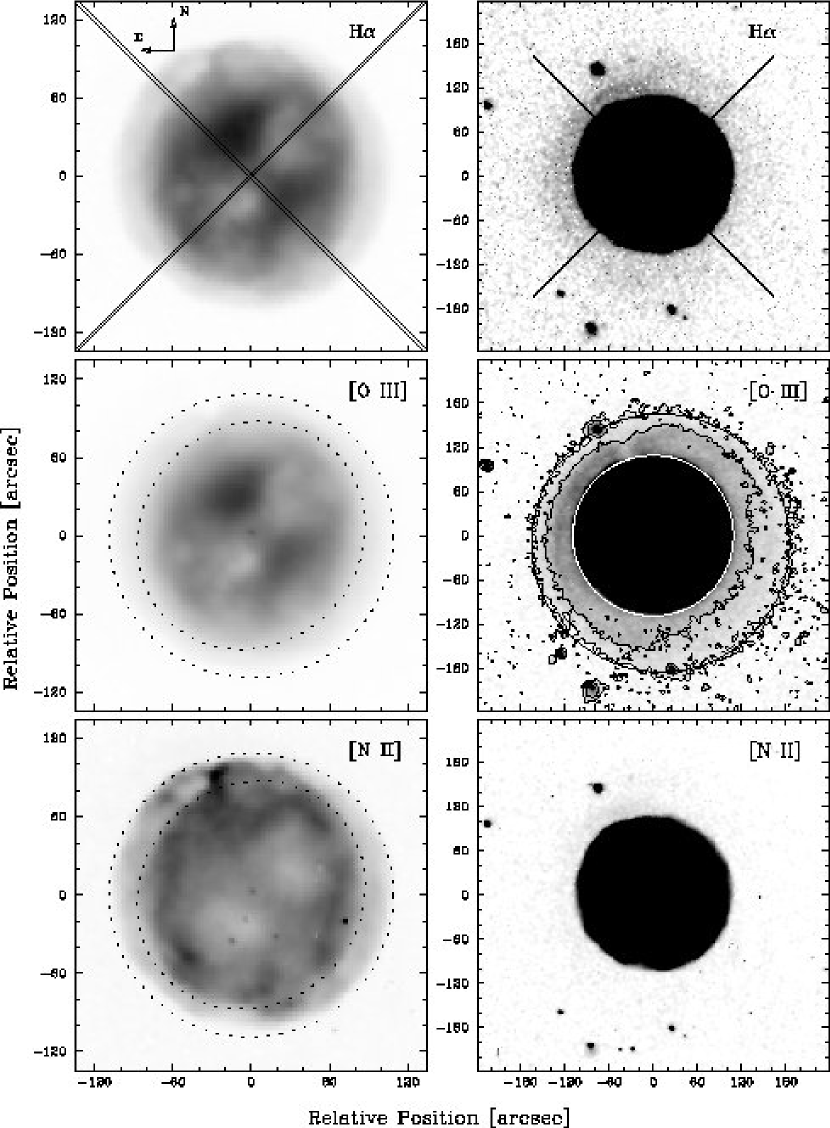
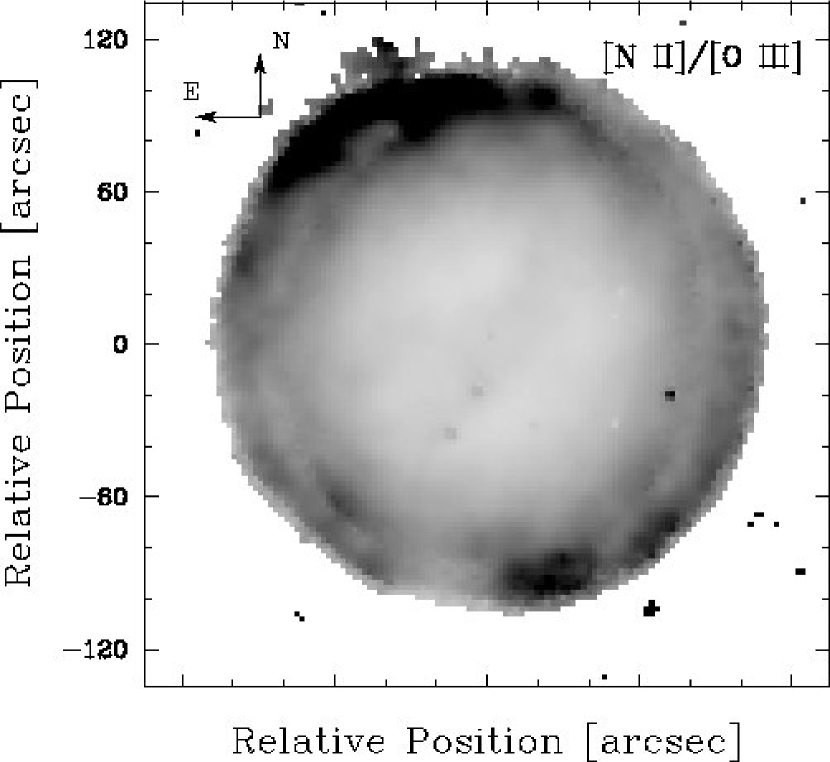
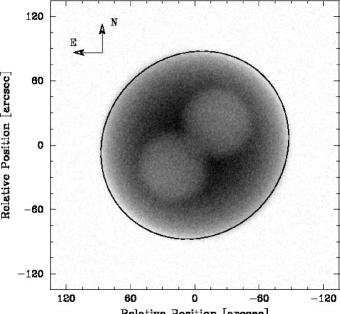
The detector was the ST2K 20482048 CCD (also known as S2KA), but only the central 12001200 pixels were read out. The pixel size is 21 m, corresponding to a spatial scale of pixel-1 and providing a field of view of . The angular resolution was , as determined from the FWHM of field stars in the images. The exposure time was 20 minutes for each image. Figure 1 shows the H, [O iii], and [N ii] images of the Owl Nebula. A [N ii]/[O iii] ratio map is shown in Figure 2. To illustrate the brightness variations quantitatively, the [Oiii] and [N ii] surface brightness profiles along PA and are presented in Figure 3.
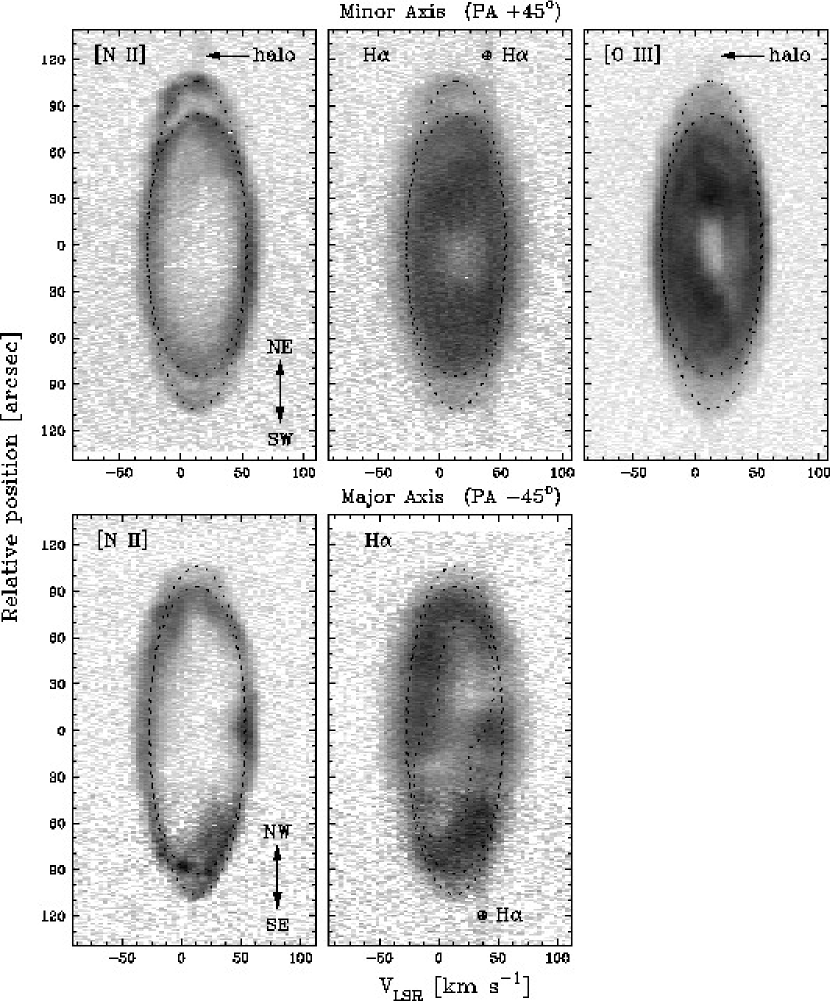
Long-slit echelle observations of the Owl Nebula were obtained using the Utrecht Echelle Spectrograph (UES) on the 4.2 m William Herschell Telescope (WHT) at the Observatory of Roque de los Muchachos (La Palma, Spain) on 1993 June 5 and 6. The spectrograph was used in the long-slit mode to obtain single-order observations for an unvignetted slit length of 160″. Broad (FWHM = 100 Å) filters centered at 6563 Å and 5007 Å were used to isolate the H + [N ii] 6548,6583 lines and the [O iii] 5007 line for their respective observations. The 79 line mm-1 echelle grating and the long-focus camera were used; the resultant reciprocal dispersion was 2.84 Å mm-1 at H 6563, and 2.14 Å mm-1 at [O iii] 5007. The data were recorded with a 10241024 Tektronix CCD with a pixel size of 24 m. This configuration provides a spatial scale of pixel-1 and a sampling of 3.1 km s-1 pixel-1 along the dispersion direction. The slit width was , and the resultant instrumental FWHM was 6.6 km s-1. The angular resolution, determined by the seeing, was FWHM.
For the H observations, we placed the slits along the “owl’s eyes” at PA and along the orthogonal direction at PA , as marked on the H images in Fig. 1, because these directions define the most prominent axes of symmetry in the nebula. The large angular size of the Owl Nebula () required multiple slit positions to cover the nebula along these two PAs. The [O iii] observation was made at only one slit position along PA , covering only the main nebula and a small section of the halo. The integration times, central wavelengths, position angles, and offsets from the central star of the long-slit echelle observations are given in Table 1. Grey-scale plots of the echellograms are presented in Figure 4.
3 Results
3.1 Morphology
The images of the Owl Nebula (Fig. 1) clearly show a triple-shell structure; these shells will be referred to as the inner shell, the outer shell, and the halo. The detailed morphology and the variations of excitation of these shells are described below.
The inner shell is roughly confined by an ellipse, in size, with its major axis oriented along the NW-SE direction (Fig. 1-center-left, and bottom-left). The main morphological feature of the inner shell is the “face of an owl”, which is best seen in the H and [O iii] images. The “eyes of the owl” are two irregularly shaped regions of diminished surface brightness aligned along the major axis of the inner shell, with each eye in size. The “forehead” and “beak” are two regions of enhanced surface brightness separated by along the minor axis of the inner shell. In the [N ii] image, the owl’s eyes appear larger and the brightness enhancement in the owl’s forehead and beak is not as prominent as in the H and [O iii] images (see Fig. 3). The [N ii] image also shows differences from the [O iii] image in the transition region between the inner and outer shells. The outer edge of the inner shell is regular and smoothly merges into the outer shell in the [O iii] image, but appears irregular and shows a noticeable break in surface brightness in the [N ii] image.
The outer shell is almost circular. With a diameter of 218″, the outer shell is only 20–30% larger than the inner shell, making it one of the thinnest (relative to the inner shell) outer shell among multiple-shell PNs (Chu, Jacoby, & Arendt, 1987). The surface brightness of the outer shell decreases outwards in the H and [O iii] images, but shows pronounced limb-brightening in the [N ii] image along the PAs from 15° to 50°, and from 180° to 230°.
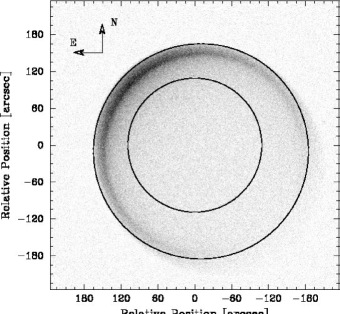
The halo is more prominent in the [O iii] image than in the H or [N ii] images (Fig. 1-right), as previously noted by Hajian et al. (1997). This behavior is commonly seen in haloes of PNs and is most likely an effect of the hardening of the ionizing radiation (Pottasch & Preite-Martinez, 1983; Guerrero & Manchado, 1999). At the faintest level, the 3 contour of the halo in Fig. 1-right-center is remarkably circular with a diameter of 350″, although the overall morphology of the halo is asymmetrical. The northeast part of the halo is brighter and less extended with a noticeable limb-brightening from PA to PA, while in the opposite direction the halo is fainter and more extended with a gradual surface brightness drop off. The bright main nebula appears displaced in the halo towards its bright northeast rim. This morphology suggests a bow-shock formed by the motion of the Owl Nebula through the ISM, as discussed later in §4.2.
It is worth noting that some excitation features in the main nebula are correlated with those in the halo. As shown in the [N ii]/[O iii] ratio map of the main nebula (Fig. 2), the highest [N ii]/[O iii] ratio is found in the northeast quadrant, peaking particularly in a compact region at 80″–95″ from the central star at PA18°. In this compact region, the [N ii] emission, as well as the H, is enhanced. In the halo behind this compact region, the [O iii] image shows a conical “shadow” along a line that can be traced back to the central star (Fig. 1-center-right). A similar feature is observed in the halo of NGC 6853, the Dumbbell Nebula (Manchado et al., 1996). This phenomenon is most likely caused by a dense low-ionization knot within the inner shell of the nebula which shields the halo from the light of the PN nucleus.
3.2 Kinematics
The echellograms of the H, [O iii], and [N ii] lines in Fig. 4 show position-velocity ellipses that are characteristic of expanding shells. The systemic velocity of the Owl Nebula measured from the centroid of the position-velocity ellipses is relative to the local standard of rest. [All radial velocities in this paper are .] The velocity split at the center of the nebula is 55.4 km s-1 in H, 73.3 km s-1 in [O iii], and 78.9 km s-1 in [N ii] These measurements are consistent with the systemic velocity and expansion velocities reported by Sabbadin et al. (1985).
None of the lines show obvious tilt along the major- or minor-axis of the inner shell. A line tilt is indicative of an aspherical shell. The lack of obvious line tilt, therefore, implies that either the inner shell of the Owl Nebula is nearly spherical as shown in the direct images or its axis of symmetry is close to the line of sight. In the latter case, the nearly circular projection of the inner shell places a stringent constraint on the axis of symmetry: the longer the axis of symmetry, the closer it must be to the line of sight. It is very unlikely that the Owl Nebula has its long axis pointing at us exactly. Therefore, we suggest that the Owl Nebula has only a small deviation from a spherical shell.
The thickness of an expanding shell can be estimated from the brightness variations of an echelle line image along the systemic velocity, as this iso-velocity slice samples the nebular material whose radial expansion is perpendicular to the line of sight. Along the minor axis of the Owl Nebula, the H and [O iii] lines show a thick shell with a small central cavity 30″ in size, while the [N ii] line shows a thin shell with a large central cavity in size. The inner shell shows pronounced limb-brightening in the [N ii] line, in sharp contrast to the uniform appearance in the H line. The [O iii] line has an overall line morphology similar to that of H, rather than [N ii], but the smaller thermal broadening of the [O iii] line makes it possible to resolve brightness variations. Two patches of brighter emission at the systemic velocity are detected in the inner shell at positions roughly coincident with the forehead and beak of the owl’s face. The [O iii] line of the inner shell also shows a position-velocity ellipse of brighter emission with radius 70″ which corresponds to a change in the slope observed in the [O iii] brightness profile (Fig. 3).
The echellograms of the H and [N ii] lines along the major axis (PA 45°) show large brightness variations along the position-velocity ellipses, especially on the receding half of the shell. While the [N ii] line shows a large central cavity similar to that along the minor axis, the H line shows a larger and more complex central cavity than along the minor axis. The central cavity in the H line appears bipolar with each lobe about 60″–70″ in extent; the NW lobe is displaced to the red side and the SE lobe to the blue side of the systemic velocity.
The outer shell is detected in the echellograms in Fig. 4. The [N ii] line shows that the position-velocity ellipse of the outer shell merges together with that of the inner shell near the projected center of the nebula, indicating that the inner and outer shells have similar expansion velocities. The H and [O iii] lines show a filled featureless outer shell, but the [N ii] line shows enhanced emission along the outer edge at the NE end of the minor axis and the SE end of the major axis.
The halo is detected in the [N ii] and [O iii] lines, but not in the H line (Fig. 4) because the larger thermal width of hydrogen spreads its emission over many pixels and lowers the S/N excessively. Only the inner 26″ of the halo toward the northeast is detected, corresponding to the brightest part of the halo (within the 10 contour in Fig. 1-center-left). No line splitting is observed in the halo. The intrinsic FWHM (removing the instrumental contribution to the observed width) of the [N ii] and [O iii] lines are 12 km s-1 and 25 km s-1, respectively. The large difference in the intrinsic FWHM of these two lines indicates that the [N ii] and [O iii] emission originates from regions with different physical conditions. Despite the difference in FWHM, the [N ii] and [O iii] lines show similar variations in centroid velocity with position: the velocity varies from 12 km s-1 (the systemic velocity of the Owl Nebula) outwards to 22 km s-1 at the bright rim of the halo. Similar velocity variations in the halo have been reported in NGC 6751, and they are caused by interstellar braking (Chu et al., 1991).
4 Discussion
4.1 The Spatio-Kinematic Structure of the Main Nebula
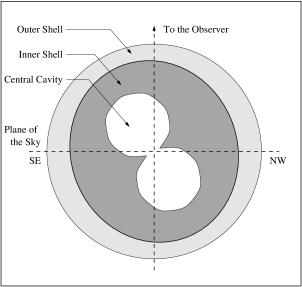
To build a spatio-kinematic model of the Owl Nebula, we adopt the methodology used by Guerrero et al. (2000) for the analysis of NGC 6891 and make three assumptions: (1) material within the nebula moves exclusively along radial directions, (2) each shell was ejected at different times, and (3) each shell is composed of subshells that expand homologously, i.e., the velocity increases linearly with distance from the center of the shell. Following these assumptions, the elliptical morphology and the position-velocity ellipse of the inner shell indicate that the boundary of this shell is ellipsoidal in shape. The best-fit ellipsoid has a radius of 93″ along the polar direction and a radius of 83″ in the equatorial plane, and its real major axis is tilted by 10°–30° with respect to the line of sight toward the SE along the apparent major axis. The polar and equatorial expansion velocities are 45 km s-1 and 40 km s-1, respectively.
The H and [O iii] echellograms show that the inner shell is partially filled. Moreover, the differences between the H echellograms along the major and minor axes indicate that the thickness of the inner shell is non-uniform and depends on the polar angle, as suggested previously by Proisy (1972). The distribution of the emission in the H echellogram along the major axis is best explained by the inclusion of a pair of bipolar cavities along the same axis of symmetry as the inner shell (Sabbadin et al., 1985). Our integrated model for the inner shell of the Owl Nebula is illustrated in Figure 5-left. If the emitting material in the inner shell has a uniform density, the surface brightness of the inner shell will have the morphology shown in Fig. 5-right, which nicely reproduces the owl’s face morphology exhibited in the H and [O iii] images in Fig. 1. The [N ii] morphology of the inner shell is different, being thinner and displaced toward the outer edge of the H and [O iii] emission. These differences can be explained by ionization stratification, with the low-ionization species distributed in a thin shell exterior to the high-ionization species.
The observed morphology and kinematics of the outer shell are consistent with a spherical shell expanding at 40 km s-1. The lower surface brightness of the outer shell is most likely caused by a lower density. There is no evidence of an asymmetric geometry for the outer shell; therefore, we simply conclude that the outer shell of the Owl Nebula is a low-density shell around the denser inner shell, as depicted in Fig. 5-left.
Several previous models of the Owl Nebula are available, but they cannot explain the morphology and the kinematics simultaneously. In the framework of interacting stellar winds, hydrodynamical calculations have been used by Icke, Balick, & Frank (1992) (see their Figure 9) and Frank & Mellema (1994) (see their Figures 6 and 7) to reproduce the owl’s face morphology. In both cases, the best models consist of prolate shells with large axial ratios () and inclination angles () against the line of sight. The nebular kinematics expected from these models will produce marked tilt in the velocity-position diagram. Our echelle observations (Fig. 4) contradict these predictions directly, ruling out these models. Alternatively, Zhang, & Kwok (1998) used a complex geometric model with artificial density distribution to synthesize the Owl’s morphology. Their model reproduced the Owl’s eyes, but also produced extended “ears” along the major axis (see their Figure 4), which are not observed in direct images; thus we consider this model also unsatisfactory. Viable models of PNs must explain nebular kinematics as well as nebular morphology.
4.2 The Spatio-Kinematic Structure of the Halo
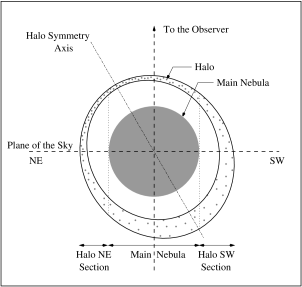
As seen in Fig. 1-center-right, the morphology of the Owl Nebula’s halo suggests that the nebula moves through the ISM toward the northeast direction. The direction of this motion is in agreement with the proper motion of its central star along PA (Cudworth, 1974). The ram pressure of the ISM compresses the leading edge of the halo producing the bow-shaped bright northeast rim. Furthermore, the deceleration of the halo material on the leading edge explains the displacement of the main nebula in the halo. Note, however, that faint emission exists exterior to the leading edge of the halo defined by the 10 contour, and that the 3 contour is remarkably round. This can be easily reproduced if the direction of the translational motion of the Owl Nebula through the ISM is tilted at a large angle against the sky plane as sketched in Figure 6-left. If the apex of the nebular motion is closer to the line of sight than the sky plane, the projection of the aspherical outer edge of the halo (3 contour) can appear round, and the faint halo off the leading edge can be projected beyond the bright rim, contributing to the emission between the 3 and 10 contours to the northeast. We have synthesized the halo morphology, assuming linear azimuthal variations in emissivity and thickness of the halo between the leading and trailing sides to account for the compression of material at its leading edge. Our model consists of an ellipsoidal shell with major and minor axes 400″ and 360″, respectively, tilted 30° with the line of sight. For a fractional shell thickness of 10% on the leading edge, and an emissivity contrast of 9 and a thickness contrast of 3 between the leading and trailing edges of the halo, the expected halo morphology shown in Figure 6-right agrees reasonably well with the observed halo.
The kinematics of the halo also shows evidence of its interaction with the ambient ISM. The echellograms in Fig. 4 detect the brightest parts of the halo, i.e., within the 10 contour in Fig. 1 center-right. The line profiles of the halo are narrow without any line splitting. The velocity of the halo varies from 12 km s-1, the systemic velocity of the main nebula, outwards to 22 km s-1. Such velocity variations are typical for interstellar braking, as observed in the PN NGC 6751 (Chu et al., 1991) and the LBV nebula S119 (Danforth & Chu, 2001), where the nebular material is decelerated from the systemic velocity of the nebula to that of the ambient ISM.
4.3 The Evolutionary Status of the Owl Nebula
We will determine the kinematical age of each shell of the Owl Nebula to assess its evolutionary status. Note that the relationship between the kinematical age and the evolutionary age of each shell of a PN may not be straightforward (Villaver, Manchado, & García-Segura, 2002). Furthermore, the kinematical ages are plagued by the uncertainty in the distance. For the Owl Nebula, the distance has been estimated to be between 0.4 kpc and 1.4 kpc (Pottasch, 1984; Cahn, Kaler, & Stanghellini, 1992; Napiwotzki, 1999), which implies a factor of 3 uncertainty in the kinematical ages. Thus, our discussion below provides only a qualitative view of the nebular evolution.
The kinematical age of the main nebula can be calculated from the expansion velocity and size of the outer shell (Steffen et al., 1997). For an expansion velocity of 40 km s-1 and an angular size of 218″, the kinematical age is yr, where is the distance in kpc. This age can be combined with the ionized mass of the nebula to derive an average mass loss rate. As given by Pottasch (1984), the ionized mass of a PN is
| (1) |
where is the filling factor, and is the angular radius in arcsec. Adopting , an observed H flux = erg cm-2 s-1 (Kaler, 1976), and electron temperature = K (Kaler, Shaw, & Kwitter, 1990), we find an ionized mass of . Thus, the average mass loss rate is yr-1, which is a lower limit for the copious mass loss at the AGB phase.
The halo of the Owl Nebula has no measurable expansion. It is not clear whether it has been decelerated by the ISM or it was ejected at small velocities. Assuming an expansion velocity of 5 km s-1, the 350″ diameter of the halo implies an age of yr. We derive a halo mass of , and an average mass loss rate for the halo of 10 yr-1.
The formation of the Owl Nebula can be schematically described as the following. Its halo was formed as the result of an early AGB wind that snow-plowed the surrounding ISM. This AGB wind may be associated with the TP-AGB phase. During later stages of the AGB evolution, the central star underwent an episode of high mass loss (the “superwind”), forming the main nebula. At its present old age, the Owl Nebula has a large size ( pc) and a low density ( 100 cm-3 in the main nebula), and the central star has already reached the turning point of its post-AGB track towards low luminosities (Napiwotzki, 1999). The diminishing of the ionizing flux causes the recombination of material within the main nebula and the formation of ionization shadows extending into the halo.
Two remarkable features of the Owl’s main nebula, namely, the presence of a central bipolar cavity and the lack of a bright rim, may have significant implications for its formation and evolution. The bipolar cavities in the nebula were probably excavated by the fast stellar wind of the central star. However, no bright rim is seen in the inner shell as expected from the interaction between the fast wind and the superwind (Kwok, Purton, & Fitzgerald, 1978; Frank, Balick, & Riley, 1990); furthermore, no measurable fast wind from the Owl’s central star or diffuse X-ray emission from shocked fast wind has been detected (Patriarchi & Perinotto, 1991; Chu, Gruendl, & Conway, 1998). We therefore suggest that a fast stellar wind excavated an elongated cavity in the nebula, similar to that seen in NGC 6891 (Guerrero et al., 2000), but the fast wind has subsequently ceased. Without being pressurized by the fast stellar wind, the nebular material backfills the central cavity and smears out the bright rim. The high density along the equatorial plane that was responsible for shaping the elongated geometry of the central cavity is also responsible for producing the forehead and beak of the Owl Nebula because of the higher density in the backfilled material. It ought to be noted that the morphology of the Owl Nebula is not unique, as other PNs show similar morphologies, e.g., A 33 (Hua & Kwok, 1999), A 50 and NGC 2242 (Manchado et al., 1996). It is thus very likely that these PNs have all followed similar evolutionary paths.
5 Summary
-
1.
The Owl Nebula is a triple-shell PN, with a slightly elongated inner shell, a round outer shell, and a bow-shaped halo. The echelle images of the H and [O iii] lines show a thick inner shell with no obvious line tilt; furthermore, the intensity variations suggest a bipolar central cavity. The echelle images of the [N ii] 6583 line show a thin shell on the outer edge of the H and [O iii] shell, also without line tilt. These results rule out the hydrodynamic models which consist of an elongated ellipsoidal or bipolar inner nebula with its polar axis tilted against the line of sight to produce the Owl morphology.
-
2.
The halo of the Owl Nebula shows no measurable expansion. Its velocity varies from = 12 km s-1, the systemic velocity of the Owl Nebula, at the inner edge to 22 km s-1 at the outer edge of the bright rim. The morphology and velocity structure of the halo are caused by the translational motion of the Owl Nebula through the ISM, a phenomenon called “interstellar braking.” The detailed morphology of the halo requires the Owl Nebula to be moving in the direction toward the northeast, but closer to the line of sight than the sky plane.
-
3.
The Owl Nebula consists of the AGB wind, with the halo formed at an early TP-AGB stage, and the main nebula formed during a period of high mass loss rate near the end of the AGB phase. The subsequent fast stellar wind from the central star excavated a bipolar central cavity, but has ceased. The backfilling of nebular material has partially erased the dynamical imprints of the fast stellar wind.
References
- Cahn, Kaler, & Stanghellini (1992) Cahn, J. H., Kaler, J. B., & Stanghellini, L. 1992, A&AS, 94, 399
- Chu, Gruendl, & Conway (1998) Chu, Y.-H., Gruendl, R. A., & Conway, G. M. 1998, AJ, 116, 1882
- Chu, Jacoby, & Arendt (1987) Chu, Y.-H., Jacoby, G. H., & Arendt, R. 1987, ApJS, 64, 529
- Chu et al. (1991) Chu, Y.-H., Manchado, A., Jacoby, G. H., & Kwitter, K. B. 1991, ApJ, 376, 150
- Cudworth (1974) Cudworth, K. M. 1974, AJ, 79, 1384
- Danforth & Chu (2001) Danforth, C. W., & Chu, Y.-H. 2001, ApJ, 552, L155
- Frank, Balick, & Riley (1990) Frank, A., Balick, B., & Riley, J. 1990, AJ, 100, 1903
- Frank & Mellema (1994) Frank, A., & Mellema, G. 1994, ApJ, 430, 800
- Guerrero & Manchado (1999) Guerrero, M. A., & Manchado, A. 1999, ApJ, 522, 378
- Guerrero et al. (2000) Guerrero, M. A., Miranda, L. F., Manchado, A., & Vázquez, R. 2000, MNRAS, 313, 1
- Hajian et al. (1997) Hajian, A. R., Frank, A., Balick, B., & Terzian, Y. 1997, ApJ, 477, 226
- Hua & Kwok (1999) Hua, C. T. & Kwok, S. 1999, A&AS, 138, 275
- Icke, Balick, & Frank (1992) Icke, V., Balick, B., & Frank, A. 1992, A&A, 253, 224
- Kaler (1976) Kaler, J. B. 1976, ApJ, 210, 113
- Kaler, Shaw, & Kwitter (1990) Kaler, J. B., Shaw R. A., & Kwitter, K. B. 1990, ApJ, 359, 392
- Kwitter, Chu, & Downes (1992) Kwitter, K. B., Chu, Y.-H., & Downes, R. A. 1992, in IAU Symp. 155, Planetary Nebulae, eds. R. Weinberger and A. Acker (Dordrecht:Kluwer), 209
- Kwitter & Henry (2001) Kwitter, K. B., & Henry, R. B. C. 2001, ApJ, 562, 804
- Kwok, Purton, & Fitzgerald (1978) Kwok, S., Purton, C. R., & Fitzgerald, P. M. 1978, ApJ, 219, L125
- Manchado et al. (1996) Manchado, A., Guerrero, M. A., Stanghellini, L., & Serra-Ricart, M. 1996, The IAC Catalog of Northern Galactic Planetary Nebulae, IAC Publishing, La Laguna, Tenerife
- Napiwotzki (1999) Napiwotzki, R. 1999, A&A, 350, 101
- Patriarchi & Perinotto (1991) Patriarchi, P. & Perinotto, M. 1991, A&AS, 91, 325
- Pottasch (1984) Pottasch, S. R. 1984, Planetary Nebulae, Dordrecht: Reidel
- Pottasch & Preite-Martinez (1983) Pottasch, S. R., & Preite-Martinez, A. 1983, A&A, 126, 31
- Proisy (1972) Proisy, P. 1972, A&A, 20, 115
- Sabbadin et al. (1985) Sabbadin, F., Bianchini, A., Ortolani, S., & Strafella, F. 1985, MNRAS, 217,539
- Steffen et al. (1997) Steffen, M., Schönberner, D., Kifonidis, K., & Stahlberg, J. 1997, IAU Symp. 180: Planetary Nebulae, 180, 368
- Villaver, Manchado, & García-Segura (2002) Villaver, E., Manchado, A., & García-Segura, G. 2002, ApJ, 581, 1204
- Zhang & Kwok (1998) Zhang, C. Y. & Kwok, S. 1998, ApJS, 117, 341

| Offset | Position Angle | Exposure Time | Central Wavelength |
|---|---|---|---|
| [″] | [°] | [min] | [Å] |
| 0 | 30 | 6562 | |
| 60 NW | 30 | 6562 | |
| 150 NW | 30 | 6562 | |
| 150 SE | 30 | 6562 | |
| 0 | 30 | 6562 | |
| 0 | 30 | 5007 | |
| 150 NE | 30 | 6562 | |
| 150 NE | 30 | 6562 | |
| 150 SW | 30 | 6562 |