Constraints on Cardassian Expansion from Distant type Ia Supernovae
Abstract
The distant type Ia supernovae data compiled by Perlmutter et al. (1999) are used to analyze the Cardassian expansion scenario, which was recently proposed by Freese and Lewis (2002) as an alternative to a cosmological constant (or more generally a dark energy component) in explaining the currently accelerating universe. We show that the allowed intervals for and , the two parameters of the Cardassian model, will give rise to a universe with a very low matter density, which can hardly be reconciled with the current value derived from the measurements of the cosmic microwave background anisotropy and galaxy clusters (cluster baryon fraction). As a result, this Cardassian expansion proposal does not seem to survive the magnitude-redshift test for the present type Ia supernovae data, unless the universe contains primarily baryonic matter.
1 Introduction
A major development in modern cosmology is the discovery of the acceleration of the universe through observations of distant type Ia supernovae (Perlmutter et al. 1998, 1999; Riess et al. 1998, 2001; Leibundgut 2001). It is well known that all known types of matter with positive pressure generate attractive forces and decelerate the expansion of the universe – conventionally, a deceleration factor is always used to describe the status of the universe’s expansion Sandage (1988). Given this, the discovery from the high-redshift type Ia supernovae indicates the existence of a new component with fairly negative pressure, which is now generally called dark energy, such as a cosmological constant Weinberg (1989); Carroll et al. (1992); Krauss and Turner (1995); Ostriker and Steinhardt (1995) or an evolving scalar field (referred to by some as quintessence) Ratra and Peebles (1988); Wetterich (1988); Frieman et al. (1995); Coble et al. (1997); Caldwell et al. (1998); Gong (2002). While current measurements of the cosmic microwave background anisotropies favor a spatially flat universe with cold dark matter de Bernardis et al. (2000); Lange et al. (2001), both the deuterium abundance measured in four high-redshift hydrogen clouds seen in absorption against distant quasars (Burles and Tytler 1998a,b) (combined with the baryon fraction in galaxy clusters from X-ray data – see White et al. 1993 for the method) and the large-scale structure in the distribution of galaxies Bahcall (2000); Peacock et al. (2001) have made a strong case for a low density universe (for a recent summary, see Turner 2002a). It seems that all these observations can be concordantly explained by the hypothesis that there exists, in addition to cold dark matter, a dark energy component with negative pressure in our universe Turner 2002b . The existence of this component has also been independently indicated by other observations such as the angular size-redshift relations for compact radio sources (Guivits et al. 1999; Vishwakarma 2001; Lima and Alcaniz 2002; Chen and Ratra 2003) and FRIIb radio galaxies (Guerra et al. 2000; Daly and Guerra 2002; Podariu et al. 2003), the age estimates of old high-redshift galaxies (Dunlop et al. 1996; Krauss 1997; Alcaniz and Lima 1999) and gravitational lensing (Kochaneck 1996; Chiba and Yoshii 1999; Futamase and Hamana 1999; Jain et al. 2001; Dev et al. 2001; Ohyama et al. 2002; Sereno 2002).
Neither a cosmological constant nor a quintessence, the present candidates for the universe acceleration mechanism, however avoid the cosmic coincidence problem – why the densities of dark energy and dark matter are comparable today (another related but distinct difficulty is the fine-tuning problem, see Carroll et al. 1992 for a discussion of this point). Although the tracking field model Zlatev et al. (1999) provides a possible resolution to this problem, a convincing dark energy model with a solid basis in particle physics is still far off. Therefore it is desirable to explore alternative possibilities, such as higher dimensions Deffayet et al. (2002); Gu and Hwang (2002) or an altered theory of gravitation Behnke et al. (2002). Very recently, Freese and Lewis (2002) proposed the “Cardassian Expansion Scenario” in which the standard Friedman-Robertson-Walker (FRW) equation is modified as follows,
| (1) |
where is the Hubble parameter as a function of cosmic time, is the scale factor of the universe and is the energy density of matter and radiation. In the usual FRW equation . To be consistent with the usual FRW result, one should take . It is convenient to use the redshift , at which the two terms of eq.(1) are equal, as the second parameter of the Cardassian model. In this parameterization of (), it can be shown that (Freese and Lewis 2002), , where is the matter density of the universe at the present time and kms-1Mpc-1 is the Hubble constant. This particular proposal is very intriguing because the expansion of the universe will be accelerated automatically later without any dark energy component – the second term, which may arise as a consequence of brane world cosmologies, dominates at a late epoch and drives the acceleration of the universe. It is valuable to explore the agreement of the Cardassian expansion model with the currently available cosmological observation data, as suggested by Freese and Lewis, who proposed this scenario. In a previous paper, the authors have used the recent measurements of the angular size of high-redshift compact radio sources made by Gurvits et al. (1999) to test the Cardassian model (Zhu and Fujimoto 2002). It was shown that the allowed intervals for the two model parameters, and , are heavily dependent on the value of the mean projected linear size (see Table 1 of Zhu and Fujimoto 2002). For example, at pc, the best fit occurs for and , which gives a reasonable matter density of . However, this analysis shows that, if one minimizes for the parameters , and simultaneously, the best fit to the current angular size data prefers the conventional flat CDM model to the Cardassian expansion proposal. In this work, we analyze this scenario with the distant type Ia supernovae sample compiled by Perlmutter et al. (1999). It is shown that the allowed intervals for and would give rise to a universe with an unreasonably low matter density (). As a result, the Cardassian expansion scenario does not seem to survive the magnitude-redshift test from the present type Ia supernovae data, unless the universe contains no dark matter. After providing a brief description of the data analysis method (section 2), we present our numerical results in section 3. Finally we summarize our conclusions and present discussion(section 4).
2 Outline of the data analysis method
The apparent bolometric magnitude of a standard candle with absolute bolometric magnitude is related to the luminosity distance by . Following Perlmutter et al. (1997), we write the B-band magnitude-redshift relation as
| (2) |
where is the “Hubble-constant-free” luminosity distance and is the “Hubble-constant-free” -band absolute magnitude at maximum of a type Ia supernova.
In a Friedmann-Robertson-Walker (FRW) universe, the luminosity distance can be calculated from the redshift-dependent Hubble parameter, , by the integral For the ansatz of eq.(1) and a flat universe with only matter, Freese and Lewis (2002) get
| (3) |
where and are the two paramters of the Cardassian model.
We use the Perlmutter et al. (1999) data to place observational constraint on the Cardassian model parameters and . This data set, plotted in Fig. 1, consists of 42 high-redshift Type Ia supernovae from the Supernova Cosmology Project111Supernova Cosmology Project: http://www-supernova.lbl.gov, and 18 low-redshift Type Ia supernovae from the Calán/Tololo Supernova Survey (Hamuy et al. 1996). Both sets include corrections for the lightcurve width-luminosity relation. The error bars, which include both the measurement errors and the intrinsic luminosity dispersion, have also been shown in Fig. 1. We determine the model parameters and through a minimization method. The range of spans the interval [-3, 2] in steps of 0.01, while the range of spans the interval [0, 4] also in steps of 0.01.
| (4) |
where refers to the theoretical prediction from eq.(2), is the observed effective magnitude, and is the total uncertainty ( refers to the th supernova of the sample). The summation is over all of the observational data points.
Evaluating the ansatz of eq.(1) at the present time, we have (Freese and Lewis 2002)
| (5) |
Because in the Cardassian model the universe is flat and contains only matter, the matter density at present, , should be equal to the ‘critical density’ of this scenario. From eq.(5), we have
| (6) |
where is the critical density of the standard FRW model. Therefore the new critical density depends on the two parameters, and , while gives the matter density in units of the critical density of standard FRW model (Freese and Lewis 2002). Instead of specifying (or ), we consider both and as independent paramters, while is treated as the output of the fitting result. The magnitude “zero point” can be determined from the 18 low-redshift supernovae that are carefully chosen from a sample of 29 supernovae from the Calan/Tololo survey. After appropriate correction, they give (Perlmutter et al. 1997). We will use respectively as typical values of the zero point to fit the data, as well as a range of – Mészáros (2002) to check the robustness of our results. In order to make the analysis independent of the choice of , we also minimize eq.(4) for , and simutaneously, which we refer as the “best fit”.
3 Numerical results
Table 1 summarizes our fitting results to the Cardassian expansion model. Following Perlmutter et al. (1999), we analyze the 60 supernovae as three different sample groupings. Sample A is the entire data set. Sample B excludes four outliers – the two of them with lower redshifts, SN1992bo and SN1992bp, are the most significant outliers from the average light-curve width, while the other two with higher redshifts, SN1994H and SN1997O, are the largest residuals from fitting. Sample C further excludes two very likely reddened supernovae, SN1996cg and SN1996cn. (For details of all these outliers, see Perlmutter et al. 1999.) As shown in Table 1, the fitting results for samples A and B are very similar except for their goodness-of-fits. The larger per degree of freedom (d.o.f) for sample A, , indicate that the outlier supernovae included in this sample are probably not part of a Gaussian distribution and thus will not be appropriately weighted in a fit (Perlmutter et al. 1999). The per d.o.f for sample B, , is reduced significantly and indicates that no large statistical errors remain unaccounted for. The fit for sample C is a more robust one, because the two very likely reddened supernovae, SN1996cg and SN1996cn, have been further removed (Perlmutter et al. 1999). All three best-fits result in the same value of the zero-point magnitude , which is higher than , the conclusion of Perlmutter et al. (1997,1999), but a little bit lower than , the value of Efstathiou (1999) which is obtained from the best-fit to the combined data for type Ia supernovae and the cosmic microwave background anisotropies. The best fit to sample C, with , , and the lowest per d.o.f. of , is depicted in Fig. 1 as a solid line. For comparison, three other curves with model parameters and taken from the Table 1 of Freese and Lewis (2002) are also shown. The ability of these curves to fit the data is surprisingly distinct (and can even be seen by eye), while the former solid curve matches the data points very well, none of the later three curves does.
In Fig. 2, we show the confidence regions (68.3% and 95.4% C.L.) of the fitting results in the plane (). The three left panels show the results for sample A, B and C using the value of which was initiated by Perlmutter et al. (1997, 1999), while the three right panels show their corresponding best fits (i.e., the case of ). In order to evaluate how reasonable the resulting parameters, and are, two areas which give a currently optimistic matter density, , (see Turner 2002a for the argument) and a wider range of –, respectively are also shown in every panel. As it is distinctly shown that there is no overlap between the resulting parameter range and the reasonable area for the matter density, we have a 95.4% confidence level (C.L.) in saying that the Cardassian expansion is not compatible with a cold dark matter dominated universe with – (the C.L. goes up to 99% if the matter density of the universe is, ). As a matter of fact, all of our fitting results for and , point to a universe with less than 0.1, which is unreasonable in light of the currently available cosmological observations Bahcall (2000); Peacock et al. (2001); Turner 2002a .
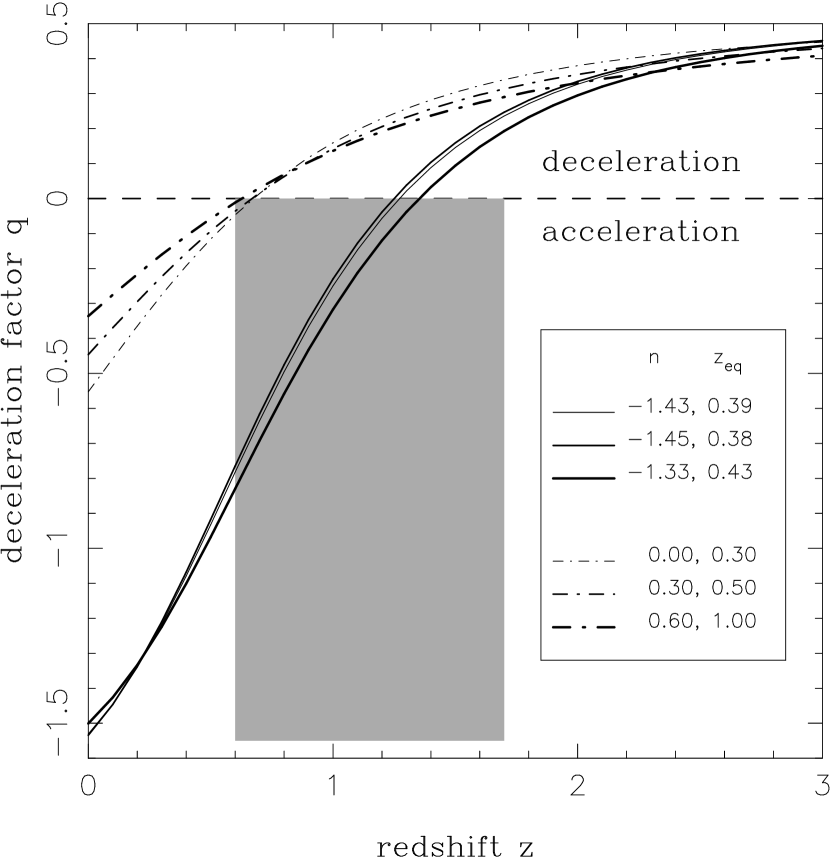
One could use the observational constraints on the deceleration factor to cross-check the robustness of the fitting results and the difficulty of the Cardassian model with a reasonable matter density (e.g., ) in explaining the type Ia supernovae data. For the Cardassian expansion scenario parameterized by and , we get the deceleration parameter as a function of redshift
| (7) |
where the function is given by eq.(3), in which the –dependent term dominates at high redshifts, causing the deceleration of the expansion of the universe. An acceleration will only occur when it becomes negative, i.e. , at a late epoch. We plot the redshift dependent deceleration parameter in Fig. 3 for the Cardassian models with the parameters of and taken from the Table 1 of Freese and Lewis (2002) and from our best fits. The shaded area in Fig. 3 corresponds to the present observational constraints on the deceleration parameter, i.e., the universe switched from deceleration to acceleration at a redshift interval at the 1 level (Perlmutter et al. 1999; Riess et al. 1998,2001; Avelino et al. 2001; Avelino and Martins 2002). The problem now is apparent: while the best fits of this work predict the turnaround redshift well within the observation constraints, all Cardassian models with a reasonable matter density () (parameters taken from the Table 1 of Freese and Lewis 2002) predict the turnaround redshift less than , which is only marginally compatible to the present observations. We are thrown into a dilemma: an unrealistically low matter density is needed so that the acceleration starts early enough to be realistic (See Avelino and Martins 2002 for the same discussion for another brane world cosmology). Therefore our fitting results are robust in explaining the type Ia supernovae data of Perlmutter et al. (1999): all of them predict a universe with very low matter density ().
4 Conclusions and Discussion
We have analyzed the Cardassian expansion recently proposed by Freese and Lewis (2002) using distant type Ia supernovae data complied by perlmutter et al. (1999). Although this particular proposal is an intriguing mechanism for the acceleration of the universe because it postulates the universe is flat, matter dominated and accelerating, but contains no vacuum contribution, it is strongly disfavored by the present high-redshift type Ia supernovae data and the constraint of . The main point is that all fitting results of this scenario to the supernovae sample lead to a universe with unreasonably low matter density, leaving no space for the huge amount of dark matter whose existence has been widely accepted among the astronomical community (see, e.g., Primack 2002, Turner 2002b). Even if one can say that this Cardassian model can marginally pass the cosmological test from the updated angular size data (Zhu and Fujimoto 2002), it can hardly survive the magnitude-redshift test for the present type Ia supernovae data unless the universe contains primarily baryonic matter. There seems to be a tendency: a model that excludes the dark energy component dispels dark matter also (see Avelino and Martins 2002 for another analysis). However, it is worth keeping in mind that a universe with low matter density can also fit the data of Perlmutter et al. (1999) surprisingly well (Mészáros 2002).
One of the major uncertainties in the present analysis comes from the errors of the magnitude “zero point” . There are several ways to overcome this problem. First of all, one can analyzes the data over a large enough range of to include almost all of the possibilities, and then calculate the probability distribution for the model parameters by integrating over it (Perlmutter et al. 1997, 1999). However this is not needed for our purpose, because all our fits with the values of from -3.00 to -3.60 lead to a universe with very low matter density. Second, one could pin down the value of through a larger sample low-redshift supernovae. Databases of nearby SNeIa are becoming unprecedentedly abundant (see, e.g., Li et al. 2001). In particular, the Nearby SN Factory222Nearby SN Factory: http://snfactory.lbl.gov will accumulate a sample of 300 low-redshift supernovae and determine to a precision of –. Finally, from eq. (2), the model parameters and can be determined by measuring differences of magnitudes at different redshifts, which are independent of Frieman et al. (2002).
Other uncertainties of cosmological parameter extraction from high-redshift type Ia supernovae sample caused by progenitor and metallicity evolution, extinction, sample selection bias, local perturbations in the expansion rate, gravitational lensing and sample contamination have been carefully studied by Riess et al. (1998) and Perlmutter et al. (1999). It was found that none of these effects can seriously change the result. Considering our results show that the matter density predicted by the Cardassian scenario is less than 0.1, it is impossible for any of these effects to change the case. In short, the present Cardassian expansion model is strongly disfavoured by the current distant SNeIa data and the constraint of . We hope that other convincing mechanisms for the acceleration of the universe will appear in the near future.
References
- Alcaniz and Lima (1999) Alcaniz, J. S. and Lima, J. A. S. 1999, ApJ, 520, 87
- (2) Avelino, P. P., de Carvalho, J. P. M. and Martins, C. J. A. P. 2001, Phys. Rev. D, 64, 063505
- Avelino and Martins (2002) Avelino, P. P. and Martins, C. J. A. P. 2002, ApJ, 565, 661
- Bahcall (2000) Bahcall, N. A. 2000, Phys.Rep., 333, 233
- Behnke et al. (2002) Behnke, D., Blaschke, D., Pervushin, V. N. and Proskurin, D. 2002, Phys.Lett. B, 530, 20
- (6) Burles, S., and Tytler, D. 1998a, ApJ, 499, 699
- (7) Burles, S., and Tytler, D. 1998b, ApJ, 507, 732
- Caldwell et al. (1998) Caldwell, R., Dave, R., and Steinhardt, P. J. 1998, Phys. Rev. Lett., 80, 1582
- Carroll et al. (1992) Carroll, S., Press, W. H. and Turner, E. L. 1992, ARA&A, 30, 499
- Chen and Ratra (2003) Chen, G., and Ratra, B. 2003, ApJ, 582, 586
- Chiba and Yoshii (1999) Chiba, M. and Yoshii, Y. 1999, ApJ, 510, 42
- Coble et al. (1997) Coble, K., Dodelson, S., and Frieman, J. A. 1997, Phys. Rev. D, 55, 1851
- Daly and Guerra (2002) Daly, R. A., and Guerra, E. J. 2002, AJ, 124, 1831
- de Bernardis et al. (2000) de Bernardis, P. et al. 2000, Nature, 404, 955
- Deffayet et al. (2002) Deffayet, C., Dvali, G. and Gabadadze, G. 2002, Phys.Rev.D, 65, 044023
- Dev et al. (2001) Dev, A., Jain, D., Panchapakesan,N., Mahajan, S., and Bhatia, V. B. 2001, astro-ph/0104076
- Dunlop et al. (1996) Dunlop, J. S., Peacock, J., Spinrad, H., Dey, A., Jimenez, R., Stern, D., and Windhorst, R. 1996 Nature, 381, 581
- Efstathiou (1999) Efstathiou, G. 1999, MNRAS, 310, 842
- Freese and Lewis (2002) Freese, K. and Lewis, M. 2002, Phys.Lett. B540, 1
- Frieman et al. (1995) Frieman, J. A., Hill, C. T., Stebbins, A., and Waga, I. 1995, Phys. Rev. Lett., 75, 2077
- Frieman et al. (2002) Frieman, J. A., Huterer, D., Eric V. Linder, E. V. and Turner, M. S. 2002, Phys.Rev.D, submitted (astro-ph/0208100)
- Futamase and Hamana (1999) Futamase, T. and Hamana, T. 1999, Prog.Theor.Phys., 102, 1037
- Gong (2002) Gong, Y. 2002, Class.Quan.Grav. 19, 4537
- Gu and Hwang (2002) Gu, J.-A. and Hwang, W-Y. P. 2002, Phys. Rev. D, 66, 024003
- Guerra et al. (2000) Guerra, E. J., Daly, R. A., and Wan, L. 2000, ApJ, 544, 659
- Gurvits et al. (1999) Gurvits, L. I., Kellermann, K. I., and Frey, S. 1999, A&A, 342, 378
- Hamuy et al. (1996) Hamuy, M. et al. 1996, AJ, 112, 2391
- Jain et al. (2001) Jain, D., Dev, A., Panchapakesan, N., Mahajan, S. and Bhatia, V. B. 2001, astro-ph/0105551.
- Kochaneck (1996) Kochaneck, C. S. 1996, ApJ, 466, 638
- Krauss (1997) Krauss, L. M. 1997, ApJ, 480, 466
- Krauss and Turner (1995) Krauss, L. M. and Turner, M. S. 1995, Gen. Rel. Grav., 27, 1137
- Lange et al. (2001) Lange, A. E. et al. 2001, Phys. Rev. D, 63, 042001
- Leibundgut (2001) Leibundgut, B. 2001, ARA&A, 39, 67
- Li et al. (2001) Li, W. et al. 2001, ApJ, 546, 734
- Lima and Alcaniz (2002) Lima, J. A. S. and Alcaniz, J. S. 2002, ApJ, 566, 15
- Mészáros (2002) Mészáros, A. 2002, ApJ, accepted (astro-ph/0207558)
- Ohyama et al. (2002) Ohyama,Y., Hamana,T., Kashikawa,N., Chiba,M., Futamase,T., Iye,M., Kawabata,K.S., Aoki,K., Sasaki,T., Kosugi,G., and Takata,T. 2002, AJ, 123, 2903
- Ostriker and Steinhardt (1995) Ostriker, J. P. and Steinhardt, P. J. 1995, Nature, 377, 600
- Peacock et al. (2001) Peacock, J.A. et al. 2001, Nature, 410, 169
- Perlmutter et al. (1997) Perlmutter, S. et al. 1997, ApJ, 483, 565
- Perlmutter et al. (1998) Perlmutter, S. et al. 1998, Nature, 391, 51
- Perlmutter et al. (1999) Perlmutter, S. et al. 1999, ApJ, 517, 565
- Podariu et al. (2003) Podariu, S., Daly, R. A., Mory, M. P. and Ratra, B. 2003, ApJ, in press (astro-ph/0207096)
- Primack (2002) Primack, J. R. 2002, astro-ph/0205391
- Ratra and Peebles (1988) Ratra, B. and P.J.E. Peebles, P. J. E. 1988, Phys. Rev. D, 37, 3406
- Riess et al. (1998) Riess, A. G. et al. 1998, AJ, 116, 1009
- Riess et al. (2001) Riess, A. G. et al. 2001, ApJ, 560, 49
- Sandage (1988) Sandage, A. 1988, ARA&A, 26, 561
- Sereno (2002) Sereno, M. 2002, A&A, 393, 757
- (50) Turner, M. S. 2002a, ApJ, 576, L101
- (51) Turner, M. S. 2002b, astro-ph/0207297
- Vishwakarma (2001) Vishwakarma, R. G. 2001, Class.Quan.Grav. 18, 1159
- Weinberg (1989) Weinberg, S. 1989, Rev. Mod. Phys. 61, 1
- Wetterich (1988) Wetterich, C. 1988, Nucl.Phys. B302, 645
- White et al. (1993) White, S. D. W., Navarro, J. F., Evrard, A. E., and Frenk, C. S. 1993, Nature, 366, 429
- Zhu and Fujimoto (2002) Zhu, Z. -H. and Fujimoto, M. -K. 2002, ApJ, 581, 1
- Zlatev et al. (1999) Zlatev, I., Wang, L. and Steinhardt, P. J. 1999, Phys. Rev. Lett., 82, 896

![[Uncaptioned image]](/html/astro-ph/0303021/assets/x2.png)
| Sample | N | |||||
|---|---|---|---|---|---|---|
| A …… | 60 | -3.27 | -0.81 | 0.82 | 0.037 | 108.0 |
| A …… | 60 | -3.32 | -0.99 | 0.62 | 0.053 | 104.3 |
| A …… | 60 | -3.37 | -1.19 | 0.49 | 0.068 | 102.1 |
| A …… | 60 | Best fit: -3.42 | -1.43 | 0.39 | 0.083 | 101.3 |
| B …… | 56 | -3.27 | -0.80 | 0.83 | 0.037 | 69.7 |
| B …… | 56 | -3.32 | -0.99 | 0.61 | 0.055 | 66.4 |
| B …… | 56 | -3.37 | -1.21 | 0.47 | 0.072 | 64.5 |
| B …… | 56 | Best fit: -3.42 | -1.45 | 0.38 | 0.086 | 63.9 |
| C …… | 54 | -3.27 | -0.71 | 1.08 | 0.023 | 65.4 |
| C …… | 54 | -3.32 | -0.90 | 0.72 | 0.043 | 62.4 |
| C …… | 54 | -3.37 | -1.12 | 0.53 | 0.063 | 60.7 |
| C …… | 54 | Best fit: -3.42 | -1.33 | 0.43 | 0.076 | 60.2 |
Note. — Sample A: all supernovae; Sample B: excludes four outliers, SN1992bo, SN1992bp, SN1994H and SN1997O; Sample C: further excludes SN1996cg and SN1996cn.