The Far-Infrared Spectral Energy Distributions of X-ray-selected Active Galaxies.111Based on observations with the Infrared Space Observatory, which is an ESA project with instruments funded by ESA Member States (especially the PI countries: France, Germany, the Netherlands and the United Kingdom) and with the participation of ISAS and NASA.
Abstract
Hard X-ray selection is, arguably, the optimal method for defining a representative sample of active galactic nuclei (AGN). Hard X-rays are unbiased by the affects of obscuration and re-processing along the line-of-sight intrinsic/external to the AGN which result in unknown fractions of the population being missed from traditional optical/soft-X-ray samples. We present the far-infrared (IR) observations of 21 hard X-ray selected AGN from the HEAO-1 A2 sample observed with ISO. We characterize the far-infrared (IR) continua of these X-ray selected AGN, compare them with those of various radio and optically selected AGN samples and with models for an AGN-heated, dusty disk. The X-ray selected AGN show broad, warm IR continua covering a wide temperature range ( K in a thermal emission scenario). Where a far-IR turnover is clearly observed, the slopes are in all but three cases so that non-thermal emission remains a possibility, although the presence of cooler dust resulting in a turn-over at wavelengths longwards of the ISO range is considered more likely. The sample also shows a wider range of optical/UV shapes than the optically/radio-selected samples, extending to redder near-IR colors. The bluer objects are type 1 Seyferts, while the redder AGN are mostly intermediate or type 2 Seyferts. This is consistent with a modified unification model in which obscuration increases as we move from a face-on towards more edge-on line-of-sight (l.o.s.) However, this relation does not extend to the mid-infrared as the 25m/60m ratios are similar in Seyferts with differing type and optical/UV reddening. The resulting limits on the column density of obscuring material through which we are viewing the redder AGN ( cm-2) are inconsistent with standard optically thick torus models ( cm-2) and simple unification models. Instead our results support more complex models in which the amount of obscuring material increases with viewing angle and may be clumpy. Such a scenario, already suggested by differing optical/near-IR spectroscopic and X-ray AGN classifications, allows for different amounts of obscuration of the continuum emission in different wavebands and of the broad emission line region which, in turn, results in a mixture of behaviors for AGN with similar optical emission line classifications. The resulting decrease in the optical depth of the obscuring material also allows the AGN to heat more dust at larger radial distances. We show that an AGN-heated, flared, dusty disk with mass and sizefew hundred pc is able to generate opticalfar-IR spectral energy distributions (SEDs) which reproduce the wide range of SEDs present in our sample with no need for an additional starburst component to generate the long-wavelength, cooler part of the IR continuum.
1 Introduction
Active galactic nuclei are among the broadest waveband emission sources in nature, producing significant flux over a span decades in frequency, from radio to X-rays and beyond (Elvis et al. 1994). The various emission mechanisms involved are presumably ultimately powered by a central supermassive black hole (Rees 1984).
A substantial fraction of the bolometric luminosity of many AGN emerges in the infrared, from synchrotron radiation and dust. Which of these is the principal emission mechanism is related to quasar type and is an open question in many cases (Wilkes 1999a). Non-thermal emission is paramount in core dominated radio-loud quasars and blazars (Impey & Neugebauer 1988), although hot dust contributes in some cases (Courvoisier 1998). The non-thermal component is likely related to radio and higher frequency synchrotron radiation (Chini et al. 1987), providing information about the relativistic plasma and magnetic fields associated with quasars. Other AGN classes show evidence for a predominant dust contribution (Edelson & Malkan 1987), particularly infrared-luminous radio-quiet quasars (Hughes et al. 1993), or a mix of emission components (Haas et al. 1998). Much of the dust emission is due to heating by higher energy photons from the active nucleus, and is therefore important for understanding the overall energy balance. The AGN thermal component may be an orientation-independent parameter, useful for examining unification hypotheses.
The nature of the foremost infrared emission source is ambiguous in many AGN with sparsely sampled spectral energy distributions (SEDs). Dust with smooth spatial and temperature distributions can mimic a power law spectrum (Rees et al. 1969, Bollea & Cavaliere 1976), particularly in the absence of detailed measurements to reveal bumps from temperature and density inhomogeneities. Grain emissivity is characterized by a Planck function multiplied by a power law factor (Hildebrand 1983), so spectral slopes in the Rayleigh-Jeans region of the coldest potential thermal component lie between –4, depending on the grain properties and optical depth. Known synchrotron emitters have relatively flat sub-mm power-law spectra (, Gear et al. 1994), and radio sources generally have spectra flatter than the canonical for a self-absorbed homogeneous synchrotron source (O’Dea 1998). Therefore, is a convenient partition to distinguish thermal emission from standard non-thermal models, and simple two-point spectral slopes and even lower limits to spectral indices may reveal the dominant mechanism (Chini et al. 1987). However, synchrotron models with a concave electron energy distribution (de Kool & Begelman 1989, Schlickeiser, Biermann & Crusius-Wätzel 1991), free-free absorption, or plasma suppression (Schlickeiser & Crusius 1989) can produce slopes steeper than . While is observed in some milliarcsecond radio knots (Matveyenko & Witzel 1999), thermal models offer the most consistent explanation for steep far-infrared (FIR) to mm slopes (Hughes et al. 1993, Andreani, Franceschini & Granato 1999). A thermal origin is considered to be the most likely explanation for sub-mm/FIR slopes in the present work.
The unified models of AGN (e.g. Antonucci 1993) claim that the difference between the broad-line AGN, such as Seyfert 1, and narrow-line AGN, such as Seyfert 2, is due to orientation of a circum-nuclear, dusty, torus-like structure. The dust absorbs the emission from the central nucleus and reradiates it in the IR. The first models of thermal IR emission in AGN included simple models as in Barvainis (1987), where the optically thin (in IR) dust is distributed smoothly in a disk-like configuration or as in Laor & Drain (1993) who considered a simple slab geometry. Sanders et al. (1989) proposed a warped, dusty disk, extending into the host galaxy. Recent models of the absorbing structure around the active nucleus have invoked an axially-symmetric, torus-like geometry, which is either compact (r few pc) with large optical thickness ( cm-2 and in the UV) as in Pier & Krolik (1992) or extended (tens to hundred pc in diameter) with moderate ( in UV) optical depth as in Granato, Danese, & Francheschini (1997, see also: Granato & Danese 1994, Fadda et al. 1998 and Efstathiou & Rowan-Robinson 1995). The extended models have been confirmed by the observation of large ( 100 pc) extended dusty disk-like structures around NGC 4261 (Jaffe et al. 1993), NGC 1068 (e.g. Young et al. 1996), while the moderate optical depth was confirmed by the detection of broad near-IR emission lines in optically narrow-lined AGN (Heisler & De Robertis 1999), and by the weakness of the 10m silicate absorption feature in Seyfert 1 galaxies (Roche et al. 1991).
Two large, complementary ISO AGN observing programs have opened up new wavelength windows in the FIR as well as improving the spatial resolution and sampling at shorter wavelengths: the ISO European Central Quasar Program (Haas et al. 1998, Haas et al. 2000); and the NASA/ISO Key Project on AGN, discussed herein. These observations directly measure the FIR spectral slopes in low and moderate redshift AGN and provide better constraints on the emission mechanisms throughout the infrared region. Some of the fundamental questions being addressed with the new data include: the range of SEDs within each AGN type, differences between one type and another, and correlations with fluxes at other wavebands, and orientation indicators. This paper focuses on a random subset of the hard X-ray selected AGN (Grossan 1992) in the HEAO catalog (Wood et al. 1984). The advantage of hard X-ray selection over selection in other wavebands is the lack of a strong bias against sources with significant l.o.s. absorption. Optical and soft X-ray samples, in particular, are strongly affected and may miss a large fraction of the AGN population as a whole (Masci et al. 1999, Webster et al. 1995). The current sample thus provides an improved estimate of the range of SEDs present in the AGN population as a whole as well as an estimate of the fraction of the population missing from other surveys.
2 Observations and Data Analysis.
2.1 The Sample - Hard X-ray Selected AGN
Infrared and X-ray data complement each other well and are important for understanding the overall AGN energy balance. Non-thermal infrared emission is possibly connected to the X-ray emission, either directly as part of a broad synchrotron component or as part of a radio-infrared seed spectrum which Compton scatters to produce the X-rays (see Wilkes 1999a for a review). Infrared data from dust-dominated sources reveal the level of ultra-violet (UV) and soft X-ray radiation which has been reprocessed, and provide crude estimates of the temperature and mass of the dust.
Most X-ray selected AGN to date have been found in soft X-ray bands keV (e.g. Stocke et al. 1991, Thomas et al. 1998, Beuermann et al. 1999, Schwope et al. 2000). Similar to optically selected samples, soft X-ray samples are biased against obscured sources, in this case due to absorption by the gas associated with the dust responsible for the optical obscuration. The absorption cross-section drops steeply with increasing energy (Zombeck 1990), so that hard X-ray selection is much less affected by intervening material. Surveys in hard X-rays arguably are the most efficient way to distinguish between accreting and stellar sources (Fiore et al. 1999) as well as the optimal method for defining a representative sample of AGN (Wilkes 1999b; as is the 2 micron near-IR selection - see Wilkes 2002). A comparison between the absorbed UV/soft X-ray flux and the far-IR emission provides an estimate of the relative importance of accretion and stellar power in AGN.
Hard X-ray samples (meaning heareafter selected in the 2-10 keV band222Due to this definition Mkn 478, which has a very steep soft X-ray spectrum, is included in our sample as being sufficiently bright in the 2-10 keV band.) have been difficult to obtain and are limited in number of sources, depth, and redshift (although this is changing rapidly with the advent of Chandra and XMM-Newton: Hornschemeier et al. 2001, Brandt et al. 2001, Barger et al. 2001, Tozzi et al. 2001, Wilkes et al. 2001, Hasinger et al. 2001). One of the best studied samples is that of Piccinotti et al. (1982), derived from a large-area 2–10 keV survey using the A2 experiment on board the HEAO 1 satellite (Giacconi et al. 1979, Marshall et al.1979, Boldt 1987). This sample contains 35 AGN, mostly Seyfert 1s (Kotilainen et al. 1992, Malizia et al. 1999). Improvements in analysis techniques pushed the flux limits deeper (Jahoda et al. 1989), with a corresponding increase in the number of cataloged sources. We randomly selected 21 targets from an expanded compilation of HEAO1-A2 AGN (Grossan 1992), 12 of which are also in the Piccinotti sample. We confirmed that our subset is representative of the whole sample of HEAO AGN by comparing their optical and near-IR colors, which have a 80% chance of coming from the same population as the full sample (Kolmogorov-Smirnov (K-S) test). In this paper we analyze these HEAO targets. Their redshift, coordinates and Seyfert type were taken from NASA Extragalactic Database (NED)333The NASA/IPAC Extragalactic Database (NED) is operated by the Jet Propulsion Laboratory, California Institute of Technology, under contract with the National Aeronautics and Space Administration. and are presented in Table 5.
2.2 ISO Observations & Data Reduction
The Key Project sample consists of 5–200 chopped and rastered ISOPHOT (Lemke et al. 1996) observations of 73 AGN selected to incorporate a wide range of AGN types and redshifts. Eight broadband ISOPHOT filters were employed: 4.85; 7.3; 11.5; 25; 60; 100; 135; and . Most of the sources (53 of 72) were observed in a rectangular chop mode, the point source detection technique preferred at the beginning of the ISO mission. Concerns about calibrating and interpreting chopped measurements, particularly at long wavelengths, led to a switch to small raster scans. We reobserved 18 of the chopped fields and switched 19 additional targets from our original list to raster mode. The change in observing strategy, combined with lower than expected instrumental sensitivity, resulted in a halving of the originally planned sample. However, data from both observing modes are now available for a subset of the targets, providing a cross-check and better information about background variations from the raster maps.
The data are reduced using a combination of the (ISO-) PHOT Interactive Analysis (PIA; Gabriel, Acosta-Pulido, & Heinrichsen 1998) software plus custom scripts (Hooper et al. 1999a). Raster maps have proven to be relatively reliable and are now considered scientifically validated. Short wavelength, , chopped data obtained with the P1 and P2 detectors are also fairly robust, but chopped measurements using the long-wavelength C1 and C2 arrays are still somewhat problematic (see the comparison with IRAS fluxes in (Hooper et al. 1999a). Some of the difficulty lies with vignetting corrections, particularly for the C2 detector, in which the source is centered at the convergence of 4 pixels (Hooper et al. 1999a). Detector drift may impart to the vignetting correction an apparent dependence on chopper dwell time and brightness (Haas private communication), an effect which is currently being investigated. The ISO fluxes for subset of the HEAO1-A2 sample are presented in Table 5.
2.3 Spectral Energy Distributions
The ISO points described above were combined with literature data spanning from radio to hard-X-ray (see Table 5 for details) and complemented with our own near-IR photometry to generate the most comprehensive SEDs possible. We derived near-infrared (JH) photometry from images obtained on the Steward Observatory 61” telescope on Mt. Bigelow during the period June 1995 March 1996. We used a 256256 NICMOS array camera with the pixel scale set to . To maximize on-source integration time and to ensure proper monitoring of the sky, we took the images in a raster pattern for each filter. Typical times at each raster position varied from 1 60 seconds, chosen to avoid saturating the detector. The 16 frames in each raster were used along with a dark frame of the same exposure time to construct median sky frames and normalized flats. A clipping algorithm used during median filtering ensured that the wings of the point sources were eliminated. The reduced images were aligned and averaged to produce a final image for each raster. Elias photometric standard stars (Elias et al. 1982) observed in the same manner provided aperture fluxes accurate to 510% on nights with usable data. The JHK photometry is presented in Table 5. In Mkn 1152 we include in the SED the optical spectrophotometry carried out on October 07 1996, with the FAST spectrograph on the 1.5 m Tillinghast telescope on Mt. Hopkins in Arizona, using an 3” aperture. To provide flux calibration, a standard star was observed through the same aperture, at similar air mass, immediately after the AGN observation. We reduced the data in a standard manner using IRAF444IRAF (Image Reduction and Analysis Facility) is distributed by the National Optical Astronomy Observatories, which are operated by AURA, Inc., under cooperative agreement with the National Science Foundation. (see Tokarz & Roll 1997 for details) and then fit a continuum to the spectrum (using IRAF task “continuum”), which was next binned into broader wavelength bands and included in the SED.
For comparison with the ISO data we also included observations from the InfraRed Astronomical Satellite (IRAS). In one object (PG 0804+761), however, the ISO chopped flux at 100 m differed from the flux obtained with IRAS. We decided to discard the ISO 100 m flux in this object, as the C2 detector measurements in chopped mode may not be reliable (see previous section), and included only the IRAS flux. In a number of objects (Ton 1542, MCG63015, IC 4329A, H 1419+480, E 1821+643, Mkn 509, MR 2251178) we also decided to omit the chopped 12 m ISO flux, as it differed from the IRAS flux considerably and did not follow the overall SED shape.
A correction for galactic extinction was applied to each SED, which was determined using the reddening values obtained from the literature (see Table 5 for details). After correcting for galactic extinction the data were blueshifted to the rest frame using a cosmological model with and = 50 kms-1Mpc-1. No K-correction was applied since we were working with complete SEDs. The contribution from the host galaxy was subtracted using the method and template of Elvis et al. (1994) (based on the Sbc galaxy model of Coleman, Wu and Weedman 1980) and normalized by the host galaxy monochromatic luminosity in the H band (or V band when H was not available) obtained from the literature (see Table 5 for details). If an AGN had more than one data point in a single frequency bin, we calculated an average (in ) of those observation points and included one data point in the SED. The final SEDs are displayed in Figure 1 in order of right-ascension.
In order to better characterize the SEDs, we directly measured various IR luminosities and slopes (presented in Table 5) as well as the optical, UV, X-ray and bolometric luminosities (presented in Table 6). The SEDs were linearly interpolated between the observational points, while the EUV continuum was determined by interpolating between the highest energy UV data point and the lowest energy soft-X-ray point estimated from the observed flux and spectral slope (f). If the soft-X-ray spectral slope was unknown the slope was assumed.
We also plot a median AGN energy distribution in the UVOIR range normalized to 1.5m in Fig. 2 with the 68, 90, and 100 Kaplan-Meier percentile envelopes (see Feigelson & Nelson 1985, Isobe, Feigelson, & Nelson 1986) to allow comparison with other samples. The median SED shows a large dispersion from the mean both in the IR and optical/UV.
3 The Infrared Spectral Energy Distributions.
3.1 Characteristics
A closer look at the SEDs of the HEAO sample (Fig. 1) reveals that 13 out of 21 objects show either a minimum at 1µm (if the big blue bump is present) or a downturn at 1µm from the mid-IR (if the big blue bump is highly reddened), consistent with a drop in opacity at the dust sublimation temperature 2000K (Sanders et al. 1989). The remainder show either no minimum/downturn (5 objects) or do not have enough data points around 1µm to detect the dip (3 objects). Three out of five objects with no minimum/downturn at 1µm, show steep () far-IR cutoff slopes (MR 2251178 has =3.7, while MCG25822 and E 1821+643 have =2.5) indicating thermal dust emission (see Introduction; far-IR cutoff slopes are presented in Table 7). The remining 18 AGN have slopes flatter than =2.5, which can be interpreted as either dust emission in which the lowest temperature dust emits at wavelengths longer than our coverage (i.e. 40 K) or as inhomogeneous, non-thermal synchrotron emission. While we cannot rule out non-thermal emission, we assume the IR is dominated by dust emission in our ensuing discussion.
The IR SEDs cover a broad wavelength range indicating a wide range of temperatures in a thermal emission scenario. In Table 7 we list the maximum and minimum temperature of dust required to match the continuum observed, estimated for each object by comparing the observed data to grey-body curves at various temperatures. An example is shown in Figure 3. The lowest indicated temperature is an upper limit when no long-wavelength turnover is observed in the ISO band. The number of data points is generally too few for formal fits to provide any useful constraints on the dust temperature but these rough values, which are similar to those reported in earlier studies, is too broad to be explained by optically thick dusty torus models and is generally attributed to a combination of AGN-heated torus emission and cooler emission from starburst-heated dust (Rowan-Robinson 1995).
3.2 Comparison with samples selected in other wavebands
As discussed above, X-ray selection is expected to find a somewhat different subset of the AGN population with less bias against sources which include intrinsic l.o.s. absorption. In this section we compare the SEDs of the HEAO sample with those of samples selected at optical, near-IR and radio wavelengths in order to quantify this difference and understand the subset of the population which may have been missed from those samples.
We first compare the SEDs of our hard-X-ray selected AGN sample with those presented by Elvis et al. (1994; hereafter E94). The E94 sample consists of bright soft-X-ray objects observed by the Einstein Observatory satellite, with sufficient counts to measure the soft-X-ray slope. These objects were also chosen to be optically bright enough to be observed by IUE. The sample is low redshift, heterogeneous, half radio and half optically selected, and biased towards AGN with strong soft-X-ray to optical flux ratios.
The HEAO and E94 samples have similar redshift ranges (). We found (comparing our Table 5,6 and their Table 15,16) that the range of IR and optical luminosities is similar in both samples, while the UV, soft and hard-X-ray luminosities of the HEAO sample extend to lower values (see also Figure 4). We compared the distributions of various IR, optical, UV octave luminosity ratios (opt/near-IR, UV/near-IR, opt/UV, and IR/IR) between the two samples and found that only the following luminosity ratios: L(0.2-0.4m)/L(0.4-0.8m) and L(0.2-0.4m)/L(0.8-1.6m) differ (see Figure 5). The Kolmogorov-Smirnov test shows a % probability that the HEAO and E94 samples have the same distributions for these luminosity ratios. The HEAO sample extends to lower L(0.2-0.4m)/L(0.4-0.8m) and L(0.2-0.4m)/L(0.8-1.6m) ratios, meaning that it includes objects with redder optical/UV continua. This finding is also confirmed when the median energy distribution of the HEAO sample is compared with that of E94 (see our Fig. 2 and their Fig. 11a). The discrepancy is strongest at the bluest wavebands suggesting that dust absorption may be the cause. In this case, the range of L(0.2-0.4m)/L(0.4-0.8m) and L(0.2-0.4m)/L(0.8-1.6m) ratios indicates that % of the sample are reddened at levels of and may have been missed by other surveys.
To understand the relation between the X-ray selected sources and those from other samples we compare (Fig. 6) the B-K colors of the HEAO subset analyzed here (shaded area) with the full HEAO AGN sample (dotted-line-shaded area), the radio selected quasars from Webster et al. (1995; solid line), optically selected PG QSOs from Neugebauer et al. (1987; dash-dot line) and the Chandra observed subset of the 2 micron All Sky Survey (2MASS) AGN from Wilkes et al. (2002). The radio and hard X-ray selected samples show the widest range of colors, though the radio selected sources have a larger proportion of blue sources (one-tailed K-S test gave a 99.5% significance; mean B-K is: 3.34 and 4.03, while median B-K is: 3.1 and 3.99 for the radio and full HEAO sample respectively) similar to the very narrow range of the optically selected PG sources. The PG quasars have the bluest distribution: a one tailed K-S test gave 99.9% probability that the PG distribution is bluer than the radio, HEAO and 2MASS distributions respectively, which is also evident when the B-K means are compared: 0.74(PG) with 3.34(radio), 4.03(full HEAO) , 5.60 (2MASS) and B-K medians: 0.72(PG) with 3.1(radio), 3.99(full HEAO), 5.48(2MASS). The red 2MASS AGN, selected by their red near-IR colors, largely overlap the red end of the radio and hard X-ray selected samples, implying that both these selection techniques include similar, red AGN.
Although we cannot determine the B-K distribution of the intrinsic AGN population from this comparison, Fig. 6 clearly demonstrates the large discrepancies between samples selected in different wavebands (a two-tailed K-S test showed that the distributions of the PG, HEAO, 2MASS and Webster et al. radio samples have different distributions at the 99.5%). It is clear that radio and hard X-ray samples cover a much wider range of optical colors than optically selected samples. It is also notable that the peak in the distribution of B-K colors for the hard X-ray selected sources is significantly redder than that of the radio selected sample (one-tailed K-S test gave 99.5% significance). This indicates either a lack of blue AGN in the hard X-ray sample, which seems unlikely given that these are the easiest AGN to find and classify, or a lack of red AGN in the radio sample. Such a lack could be due to differing classification schemes for radio and X-ray selected sources preferentially excluding more of the reddest sources in the radio sample e.g. due to the lack of broad optical emission lines.
4 Implications for the structure of Active Galactic Nuclei.
4.1 A comparison of dust (optical) versus gas (X-ray) absorption column densities.
If the redder B-K colors indicate more dust obscuration, as suggested by Webster et al. (1995), then the above findings suggest that the HEAO sample includes a larger proportion of dust obscured AGN than either optically or radio selected samples which miss perhaps as many as % of the population. The availability of both optical and X-ray data for many of these sources allows us to investigate the properties and structure of both the dust and the gas in the obscuring material. It is well-established that AGN show a smaller amount of optical dust absorption than indicated by the X-ray (gas) absorption if a ‘normal’ gas-to-dust ratio is assumed (Maiolino et al. 2001, Risaliti et al. 2000). The ratio varies from factors of a few to 2-3 orders of magnitude. A number of explanations have been suggested such as abnormal gas-to-dust ratios, largely dust-free gas, dust in the form of large grains whose opacity is not a strong function of wavelength and differing lines-of-sight and corresponding absorption column densities to the optical and X-ray emission regions.
A subset of the sources in the current sample have sufficient data to make a comparison. Those objects with known intrinsic X-ray absorption, are: 3A 05574383 (Sy1 with cm-2), IC 4329A (Sy1.2 with cm-2), and H1834653 (Sy2 with cm-2). Other AGN show either no evidence of intrinsic X-ray absorption or no information is available for them (see Table 5). As dust is generally associated with gas, objects with intrinsic are expected to show redder optical/UV spectra. Indeed those objects with intrinsic show the lowest L(0.2-0.4m)/L(0.4-0.8m) and L(0.2-0.4m)/L(0.8-1.6m) ratios (see Fig. 5 where the high intrinsic objects are represented by hatched regions). To estimate the amount of intrinsic dust absorption, we took the observed SEDs (previously corrected for Galactic extinction) and dereddened them by a range of values starting from 0.1 to 1.5 in steps of 0.1. The smallest which produced an SED with a big blue bump showing no downturns in the optical/UV was taken as a lower limit estimate of the intrinsic absorption for that object. For IC 4329A and H1834653 the was estimated to be and respectively, which translates to and cm-2, assuming the standard conversion of cm-2 for Galactic dust/gas ratio (Diplas & Savage 1994; 3A 05574383 has too few opt/UV data points to estimate the big blue bump shape). A comparison of absorption estimated from the opt/UV (above) and X-rays (Table 5) shows a 4 times higher and a 30 times lower dust/gas ratio for IC 4329A and H1834653 respectively. A higher/lower dust to gas ratio can be explained by either smaller/larger dust grains or the presence of an ionized absorber (see below) in the higher dust to gas ratio objects.
In our sample we also find objects which are extremely red in the optical/UV wavelength range, with non-existent big blue bumps (where L(0.2-0.4m)/L(0.4-0.8m) and L(0.2-0.4m)/L(0.8-1.6m) is less than 0.5) but normal X-ray softness ratio () and steep () soft-X-ray slopes indicating no/little intrinsic X-ray absorption from neutral gas. These include: Mkn 1152 (Sy1.5) and MCG63015 (Sy1.2). The lower limit for estimated from the downturn of the big blue bump in the optical/UV range is 1.2 and 1.6, for Mkn 1152 and MCG63015 respectively. This translates to HI column densities of cm-2 and cm-2 respectively (assuming a Galactic dust/gas ratio), which should result in detectable soft-X-ray absorption in the spectra of these objects. MCG63015 is known to have a dusty warm absorber (Reynolds 1997), which can explain the lack of soft-X-ray absorption via neutral gas combined with the reddening in opt/UV via dust. Since Mkn 1152 shows similar opt/UV/X-ray SED properties to MCG63015 it may be a candidate for a dusty warm absorber. However detailed X-ray spectral analysis is needed to confirm this and rule out smaller than Galactic dust grains as another option. In addition IC 4329A, noted above to show X-ray absorption, but with dust/gas ratio a few times higher than the Galactic value, can also be explained if some of the absorbing gas is ionized. The X-ray spectrum of this object, observed by BeppoSAX (Perola et al. 1999), shows comparable column densities of both cold and warm absorption (the latter indicated by the 0.7 keV feature corresponding to the O VI and O VII blend) and so is consistent with our interpretation.
To obtain a more general view of the sample we plot (Fig. 7) the X-ray softness ratio i.e. the L(0.1-2keV)/L(2-10keV) as a function of the big blue bump shape indicated by the following UV/optical/near-IR luminosity ratios: L(0.2-0.4m)/L(0.4-0.8m) and L(0.2-0.4m)/L(0.8-1.6m). AGN with high (0) L(0.2-0.4m)/L(0.4-0.8m) and L(0.2-0.4m)/L(0.8-1.6m) ratios, which are also comparable to the luminosity ratios of the soft-X-ray selected sample of E94 (see Figure 5), are those with pronounced, and unabsorbed big blue bumps, and include mostly Sy1s (open circles in Fig. 8 with the exception of Mkn 509 a Sy1.2, and MCG25822 a Sy1.5). AGN with ratios , and smaller than E94, are mostly intermediate type (Sy1.2, Sy1.5) and type 2 Seyferts (indicated in Figure 7 by filled circles). This finding is broadly consistent with unified models of AGN in which Sy1s are viewed face on to a dusty torus-like structure, and hence their continua are expected to be less absorbed and bluer than the continua of the intermediate type and type 2 Seyferts, which are viewed at larger (more edge-on) inclination angles, and are more absorbed. Objects with low X-ray softness ratios () in Fig. 7, indicative of neutral gas absorption, include: H1834-653 - a heavily absorbed Seyfert 2, 3A 05574383 - a Seyfert 1 with considerable (see Table 5), H1537+339 (Sy1) and H1419+480 (Sy1) for which no indication of intrinsic has been found in the literature. Unfortunately for almost all of these objects (with the exception of the H1834-653) the SEDs in the 0.20.4m and UV wavelength range lack data points, so the values of L(0.2-0.4m)/L(0.4-0.8m) and L(0.2-0.4m)/L(0.8-1.6m) ratios in Fig. 7 are uncertain. We can however predict the direction (indicated by horizontal arrows) in which the SED would move if the UV points were available based on the blue bump shape in the optical. Objects which lack soft-X-ray data, i.e. those which have uncertain softness ratios, are indicated by vertical arrows. We also plot in Fig. 7 the dependence of UV/optical colors and X-ray softness ratio on . It is apparent that the UV/optical colors can be explained by a lower range, than is needed to explain the X-ray softness range.
4.2 Diagnostics from the IR continuum
The relative contribution of emission in the warm (mid-IR: m) and cool (far-IR: m) IR potentially provides an important diagnostic of the energy sources responsible. The relative strength of the mid- to far-IR emission correlates with that of an active nucleus (de Grijp et al. 1985, Heisler & De Robertis 1999). In the popular, two-component thermal dust model for AGN IR emission (Rowan-Robinson & Crawford 1989, Rowan-Robinson 1995), the AGN heats dust close to the nucleus generating mid-IR emission in addition to the far-IR emission from a ubiquitous starburst component. As we have seen, a popular model for the AGN IR component is re-emission from an optically thick dusty torus (Pier & Krolik 1992, Granato & Danese 1994) which unifise type 1 and type 2 AGN via obscuration of the central AGN by the edge-on torus in the latter. The torus optical depths are sufficiently high ( cm-2) that the SED of the AGN IR component is a strong function of viewing angle or, equivalently, the column density of obscuring material along our l.o.s. through the material. It is likely that both AGN luminosity and the amount of l.o.s. obscuration contribute to the mid-IR SED shape, combined with the relative strength of the host galaxy emission at the lower luminosity end (Lumsden et al. 2001, Alexander 2001).
We determine the luminosities of the HEAO sample in the warm 3-60µm band and cold 60-200µm bands (Table 5) and compare this ratio with those for the quasar sample of Polletta et al. (2000), which includes both radio-loud and radio-quiet quasars with SEDs of similar quality to ours. The resulting ratio of warm to cool IR emission is plotted in Figure 8 as a function of the total IR luminosity for both samples. The distribution suggests that the HEAO sample lacks objects with large L(3-60m)/L(60-200m) ratios i.e. those with the largest AGN contribution, although this difference is only marginally significant for the samples as a whole (the K-S test gave a 5% probability that the two samples have the same distribution). Since the non-thermal radio emission has been subtracted from the IR spectra of the Polletta et al. (2000) quasars, and objects with larger L(3-60m)/L(60-200m) ratios are either radio-quiet or radio intermediate, any difference cannot be due to the contribution of radio-linked, non-thermal emission in their radio-loud quasars. Those objects with the largest AGN contribution (L(3-60m)/L(60-200m)) are those with the highest total IR luminosity supporting a scenario where the far-IR emission is associated with a starburst in the host galaxy which is more dominant for the lower luminosity and/or intermediate type sources of which the HEAO sample includes a larger proportion.
In Table 5 we also present a widely-used alternative measure of warm to cool IR emission, the ratio between the 25µm and 60µm flux, and compare (Figure 9) the HEAO sample with the soft-X-ray sample of E94, Seyfert galaxies (including type 1 and 2) from de Grijp et al. (1985), and Low et al. (1988), and the Palomar-Green QSOs from Sanders et al. (1989). In this figure we also mark the ratio characteristic for normal spiral galaxies in the Virgo cluster from Soifer et al. (1987). The HEAO 25/60 ratios extend towards warmer colors when compared to Seyfert galaxies, but are consistent with the IR colors of QSOs and the E94 sample. Although one object (3A 0557385) in the HEAO sample has a larger 25/60 ratio than the E94 sample, and E94 AGN extend towards smaller ratios, the distribution of the 25/60 ratios is statistically indistinguishable in HEAO and E94 samples (K-S test gives a 84% probability that the samples are drawn from the same population).
If obscuration is a significant contributor to the 25/60 flux ratio, then we would expect some difference between these distributions for the HEAO and E94 samples. We showed in section 3.2 that the HEAO sample includes more optically reddened AGN than the E94 sample, with half of the HEAO AGN showing lower UV/optical ratios (i.e. L(0.2-0.4m)/L(0.4-0.8m) and L(0.2-0.4m)/L(0.8-1.6m)) than the E94 AGN. We plot in Fig. 10 the relation between 25/60 ratio and the UV/optical ratio: L(0.2-0.4m)/L(0.4-0.8m) and L(0.2-0.4m)/L(0.8-1.6m). The HEAO AGN with L(0.2-0.4m)/L(0.4-0.8m) are mostly intermediate and type 2 Seyferts. No correlation between the 25/60 ratio and the dust indicator from the UV/optical SED is present, the more reddened Seyferts (with L(0.2-0.4m)/L(0.4-0.8m)) do not show larger 25/60 ratios than the blue (i.e. L(0.2-0.4m)/L(0.4-0.8m)) Seyferts (K-S test showed a less than 30% probability that the two distributions are different). The combination of redder optical colors and lack of a difference in the mid-IR indicates cm-2. This is inconsistent with torus models implying an obscuring structure which is less optically thick, at least along the lines-of-sight represented here.
In Fig. 11 we present the relation between 12/60 and 25/60 ratios and represent the HEAO Sy1s as open circles, HEAO intermediate type Sys as filled circles, Sy2 as filled square, and the E94 AGN as crosses. We also include from Heisler, Lumsden and Bailey (1997) the Seyfert 2s with a hidden broad line region (HBLR) i.e. Seyfert 2 galaxies, that show broad emission lines in polarized light, and Seyfert 2s without a hidden broad line region (non-HBLR) i.e. Seyfert 2 galaxies which do not show broad emission lines in polarized light. This correlation between the 12/60 and 25/60 ratios in HBLR and non-HBLR Seyfert 2 galaxies was initially interpreted by Heisler et al. (1997) within the context of unified schemes, such that Seyfert 2 galaxies with no HBLR are viewed edge-on to the torus, which obscures the mid-IR emission and hides the scattering medium producing polarized broad emission lines, while the Sy2s with HBLR are viewed from angles skimming the dusty obscuring structure, large enough to hide the broad line region, and small enough to see the warm 25µm dust emission and the scattering medium (see also Tran 2003 who finds hotter circumnuclear dust temperatures and mid-IR spectra more characteristic of Sy1s in HBLR Sy2s compared to non-HBLR Sy2s). This simple picture was later modified to include the significant effects of the host galaxy in the non-HBLR Sy2s which tend to have lower overall luminosity (Alexander 2001, Lumsden et al. 2001). The HEAO and E94 AGN extend the non-HBLR and HBLR Seyfert 2 correlation towards warmer 25/60 and 12/60 ratios roughly along a reddening curve for Galactic dust. This general trend again points towards a modified unified scheme including an obscuring structure which is less optically thick than a torus and whose column density decreases more smoothly towards more face-on viewing angles.
In Fig. 11 there is a region, at colors suggesting according to the Galactic reddening curve shown, where there is overlap between the reddest type 1 AGN from both E94 and the HEAO sample, intermediate types from the HEAO sample and the HBLR Sy2s from Heisler et al. (1997). In this scenario, in which the viewing angles are similar for these objects, such a mix could be achieved via differing lines-of-sight to the BLR and the various continuum emitting regions. An alternative is to invoke a clumpy distribution of dust, where the Sy1-Sy1.5 in the HEAO sample are viewed through holes, while the HBLR Sy2s are totally obscured.
Looking at a few of the individual cases could prove instructive here. Along with two HBLR Sy2s, the spectroscopically classied Sy2 H1834-653 has a warm 25/60 ratio of , more consistent with the colors of Sy1s. It is one of the lowest luminosity sources in our sample with a high host galaxy/AGN ratio (see Tables 5 & 3) so the AGN-like appearance of its mid-IR colors cannot be explained by an unusually dominant AGN in the IR. However the amount of reddening needed to explain the red opt/UV SED is E(B-V)=1.1 (section 4.1), which corresponds to a negligible extinction of 0.05 mag at 25µm and 0.007 mag at 60µm, is likely sufficient to allow the galaxy light to dominate the optical/UV emission and thus to lose the BLR. Alternatively the obscuring material could lie in the host galaxy, as in IC 4329A, a Sy1.2 with a similar 25/60 ratio (i.e. similar viewing angle) to H1834-653 and for which the AGN is viewed through an edge-on dust lane in its host galaxy (Wolstencroft et al. 1995). By contrast there are two broad-lined AGN (3C48 and PG1613+658) in the E94 sample which have mid-IR colors similar to Sy2s. Again the relative AGN and host galaxy luminosities cannot explain the galaxy-like IR colors in these sources, both have optical-mid-IR luminosities in the AGN range ( erg s-1) and small host galaxy contributions. 3C48 is a steep spectrum compact radio source, one popular model for which involves their confinement by an inhomogeneous, dense medium in the host galaxy (van Breugel et al. 1984), potentially explaining the reddening of the far-IR continuum, though the clear view of the BLR remains a puzzle. For PG1613+658 there is no obvious explanation beyond invoking an unusually strong far-IR starburst component as suggested by the detection of CO in this source (Evans et al. 2001).
Summarizing the last two sections, a simple unified model can not explain the behavior of the HEAO SEDs. A relation between Seyfert type and opt/UV reddening is present in the sense that bluer AGN are mostly Seyfert 1s, and redder AGN are mostly intermediate or type 2 Seyferts. This relation does not extend to the infrared in a way consistent with standard optically thick torus models as the 25/60 ratios are similar in Seyferts with differing type and optical/UV reddening (except for non-HBLR Seyferts). However they can be explained by a lower optical depth, disk-like structure whose obscuring column density is a function of viewing angle. If we further include the effects of differing ratios of host galaxy to AGN luminosity, most of the observed properties can be explained.
4.3 Models
The lower optical depths ( cm-2) for the obscuring material favored by our results suggest that the AGN may be able to heat a larger amount of dust to a larger range of temperatures than in the optically thick torus models. This raises the question of whether/not a cool, starburst component is required to explain the full IR continuum of AGN. To investigate this we use the Monte Carlo radiative equilibrium technique of Bjorkman & Wood (2001), modified to work in the parameter regime of AGN, to compute model spectral energy distributions (SEDs). In our models we assume that an isotropic point source illuminates an axisymmetric dusty disk-like structure. Incident spectra for the central engine in AGN SED models are often power laws or black-bodies (e.g., Granato & Danese 1994). Instead, in our models, we use the median SED of a normal, broad-line AGN from Elvis et al. (1994) as the incident continuum.
The dust model is that presented by Kim, Martin, & Hendry (1994) and provides a good match to the observed extinction and scattering properties of dust in the Milky Way’s ISM. Our SED models suffer from the same problem as other axisymmetric models in that they predict silicate emission at 10m which is not generally observed. Recent work by Nenkova, Ivezic, & Elitzur (2002) suggests that this problem may be alleviated with three dimensional multiple cloud models and does not require different dust species or environments for Seyfert 1 and 2 models (e.g., Efstathiou & Rowan-Robinson 1995). There have been many theoretical studies of the shapes of SEDs from different axisymmetric dusty tori (e.g., Pier & Krolik 1993; Efstathiou & Rowan-Robinson 1995; Granato & Danese 1994) and more recently three dimensional multiple dust cloud models (Nenkova, Ivezic, & Elitzur 2002). Our SED modeling, while using a different technique for the numerical radiation transfer, adopts an axisymmetric structure (hereafter called dusty disk) for the torus as in the papers cited above. We adopt the following density structure:
| (1) |
In this equation we work in units of pc, is the dusty disk density at , is the radial coordinate in the disk mid-plane and the scale height increases with radius, . We adopt (radial density independent of distance) and a slightly flaring scaleheight with and fix the radial extent of the disk at pc. The parameters that we varied to fit the three SEDs are the incident luminosity , scaleheight , and total mass of the dusty disk . The other parameter in our modeling is the disk inclination .
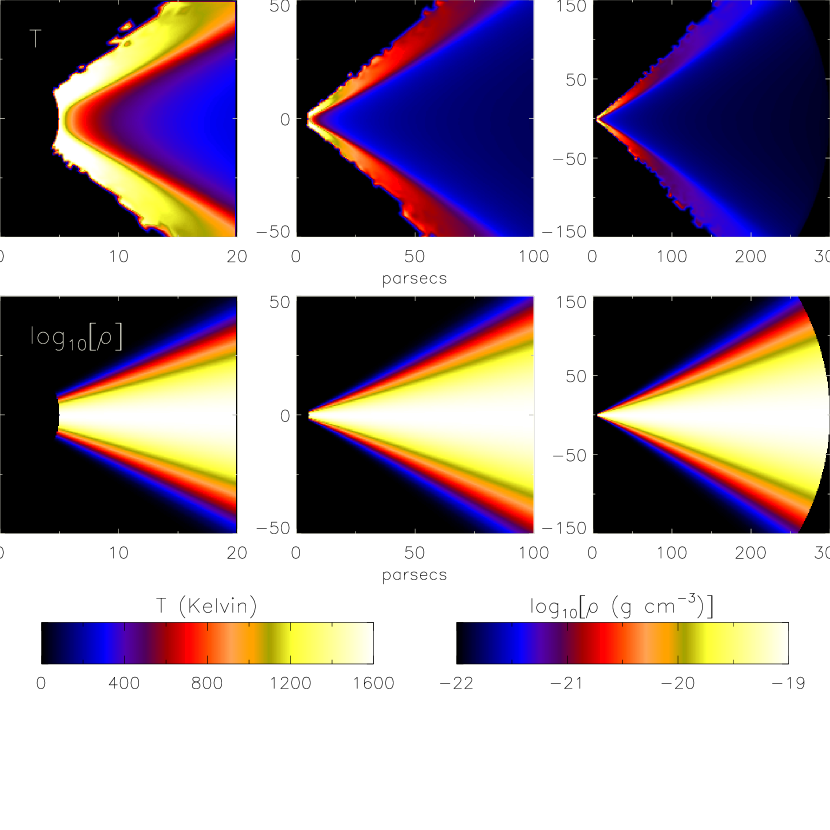
We have modeled three AGN which span the range of SED types observed in our sample. PG 0804+761 is a typical SED, MR 2251178 shows a rather flat SED, and IR 13218+0552 is very red. Our model fits to these three AGN are shown in Figure 12. Our goal in this modeling is to reproduce the overall shape of the different SEDs varying as few parameters as possible. Our results are certainly not unique (e.g., see Granato & Danese 1994 for the effects of changing model parameters), but they do allow us to estimate dusty disk parameters for the three AGN: the dusty disk mass and shape (, ) is obtained from the level of the mid and far-IR emission. The change in SED as a function of inclination angle for the best fit model for each AGN is shown in Figure 13. For PG 0804+761 and MR 2251178 pole-on views satisfactorily fit the SED, while for IR 13218+0552, we require a sightline that obscures the central engine at optical wavelengths. In all cases the model SED can reproduce the full AGN SED with no requirement for an additional starburst component. The resulting model parameters are given in Table 8. The temperature and density distribution of dust in the obscuring disk-like structure are shown in Fig. 14. As is immediately evident the hottest dust lies at the surface and inner edge of the disk while the coolest dust with highest density is located in the plane of the disk.
5 Summary
We have studied the IR–X-ray properties of 21 HEAO1-A2 AGN. The sample is hard-X-ray selected and hence relatively unbiased by the effects of obscuration. New ISO observations were compiled with literature data to obtain the most comprehensive radio to hard-X-ray SEDs, for comparison with the SEDs of radio, optically, and soft-X-ray selected samples. We found that the HEAO AGN include objects with redder opt/UV continua than the optically and soft-X-ray selected AGN, with a BK color distribution similar to radio and near-IR (2MASS) selected AGN, although the peak of the distribution in the radio-selected samples is shifted to bluer objects. We hence estimate that % of the redder AGN may be missed by the optical and radio surveys. The bluer objects in the HEAO sample are mostly Seyfert 1 objects, while the redder are mostly intermediate and type 2 Seyferts, indicating that Sy1s have less obscured nuclei than the Sy2. This trend does not extend, however, into the infrared where the 25/60 flux ratios do not differ much between Seyfert type and are consistent with the ratios found in the unobscured optically selected QSO and soft-X-ray selected AGN. There is also no correlation between the 25/60 flux ratio and the dust indicator from the opt/UV SEDs, indicating column densities of the order of cm-2, much lower than predicted by the standard compact (few parsec) torus model. Such a behavior can be explained if the obscuring dusty disk-like structure has a lower optical depth and extends towards larger radii ( few hundred parsecs) than the standard torus, with a possibly clumpy dust distribution. We show that such a model fully explains the large range of IR SED observed in our HEAO sample, and since dust can be heated at larger distances, there is no need to introduce an additional starburst component to account for the far-IR emission. The range of dust temperatures is high ranging from 20K to 1000K and the far-IR turnover occurs at wavelengths longer than 200m in all but 3 objects.
References
- (1) Alexander, D., 2001 MNRAS, 320, L15
- (2) Andreani, P., Franceschini, A., & Granato, G. 1999, MNRAS, 306, 161
- (3) Antonucci, R. 1993, ARA&A, 31, 473
- (4) Barger, A. J., Cowie, L. L., Mushotzky, R. F., & Richards, E. A., 2001, AJ, 121, 662
- (5) Barvainis, R., 1987, ApJ, 320, 537
- (6) Beuermann, K., Thomas, H.-C., Reinsch, K., Schwope, A. D., Tr mper, J., Voges, W. 1999, A&A, 347, 47
- (7) Bjorkman, J. E. & Wood, K. 2001, ApJ, 554, 615
- (8) Boldt, E., 1987, in “Observational cosmology” Proceedings of the IAU Symposium, Beijing, People’s Republic of China, Dordrecht, D. Reidel Publishing Co., 611
- (9) Bollea, D. & Cavaliere, A. 1976, A&A, 49, 313
- (10) Boller, T., Brandt, W. N., & Fink, H. 1996, A&A, 305, 53
- (11) Brandt, N. 2001, AJ, 122, 2810
- (12) van Breugel, W. J. M., Miley, G. K., & Heckman, T. A. 1984, AJ, 89, 5
- (13) Ceballos, M. T. & Barcons, X. 1996, MNRAS, 282, 493
- (14) Chini, R., Biermann, P. L., Kreysa, E., Kuhr, H., Mezger, P. G., Schmidt, J., Witzel, A., & Zensus, J. A. 1987, A&A, 181, 237
- (15) Chini, R., Kreysa, E., & Biermann, P. L. 1989, A&A, 219, 87
- (16) Coleman, G.D., Wu, C.C., & Weedman, D.W. 1980, ApJS, 43, 393
- (17) Comastri, A., Setti, G., Zamorani, G., Elvis, M. Wilkes, B. J., McDowell, J. C., & Giommi, P. 1992, ApJ, 384, 62
- (18) Courvoisier, T. J.-L. 1998, A&ARv, 9, 1
- (19) Cutri, R. M., Wisniewski, W. Z., Rieke, G. H., & Lebofsky, M. J 1985, ApJ, 296, 423
- (20) Diplas, A. & Savage, B. D. 1994, ApJ, 427, 274
- (21) Edelson, R. A. & Malkan, M. A. 1987, ApJ, 323, 516
- (22) Elias, J. H., Frogel, J. A., Matthews, K., & Neugebauer, G. 1982, AJ, 87, 1029
- (23) Elvis, M., Wilkes, B. J., McDowell, J. C., Green, R. F., Bechtold, J., Willner, S. P., Cutri, R., Oey, M, S., and Polomski, E. 1994, ApJS 95, 1 (E94)
- (24) Efstathiou, A. & Rowan-Robinson, M. 1995, MNRAS, 273, 649
- (25) Evans, A. S., Frayer, D. T., Surace, J. A., & Sanders, D. B., 2001, AJ, 121, 1893
- (26) Fadda, D., Giuricin, G., Granato, G. L., Vecchies, D., ApJ, 496, 117
- (27) Feigelson, E.D., & Nelson P.I. 1985, ApJ, 192
- (28) Fiore, F., La Franca, F., Giommi, P., Elvis, M., Matt, G., Comastri, A., Molendi, S., & Gioia, I. 1999, MNRAS, 306, L55
- (29) Gabriel, C., Acosta-Pulido, J., & Heinrichsen, I. 1998, Proc. of ADASS VII, ASP Conf. Ser., 145, ed. R. Albrecht, R. N. Hook, & H. A. Bushouse (San Francisco: ASP), 165
- (30) Gear, W. K., Stevens, J. A., Hughes, D. H., Litchfield, S. J., Robson, E. I., Terasranta, H., Valtaoja, E., Steppe, H., Aller, M. F., & Aller, H. D. 1994, MNRAS, 267, 167
- (31) Giacconi, R., et al. 1979, ApJ, 230, 540
- (32) Gondhalekar, P. M., Kellett, B. J., Pounds, K. A., Matthews, L., & Quenby, J. J. 1994, MNRAS, 268, 973
- (33) Granato, G. L. & Danese, L. 1994, MNRAS, 268, 235
- (34) Granato, G. L., Danese, L., & Francheschini, A. 1997, ApJ, 486, 147
- (35) de Grijp, M. H. K., Miley, G. K., Lub, J., de Jong, T. 1985, Nat, 314, 240
- (36) Grossan, B. A. 1992, Ph.D. Thesis, MIT
- (37) Haas, M., Chini, R., Meisenheimer, K., Stickel, M., Lemke, D., Klaas, U., & Kreysa, E. 1998, ApJ, 503, L109
- (38) de Kool, M. & Begelman, M. C. 1989, Nat, 338, 484
- (39) Haas, M., Müller, S. A. H., Chini, R., Meisenheimer, K., Klaas, U., Lemke, D., Kreysa, E., & Camenzind, M. 2000, A&A, 354, 453
- (40) Hasinger, G et al. 2001, A&A, 365, L45
- (41) Heisler, C.A. & De Robertis, M. M. 1999, AJ, 118, 203
- (42) Hildebrand, R. H. 1983, QJRAS, 24, 267
- (43) Hooper, E. J., Wilkes, B. J., McLeod, K. K., Elvis, M. S., Impey, C. D., Lonsdale, C. J., Malkan, M. A., & McDowell, J. C. 1999a, in The Universe as Seen by ISO, ESA Special Publications, SP-427, ed. P. Cox, & M. Kessler, 893
- (44) Hornschemeier, A. E., Brandt, W. N., Garmire, G. P., Schneider, D. P., Barger, A. J., Broos, P. S., Cowie, L. L., Townsley, L. K., Bautz, M. W., Burrows, D. N., Chartas, G., Feigelson, E. D., Griffiths, R. E., Lumb, D., Nousek, J. A., Ramsey, L. W., & Sargent, W. L. W. 2001, ApJ, 554, 742
- (45) Hughes, D. H., Robson, E. I., Dunlop, J. S., & Gear, W. K. 1993, MNRAS, 263, 607
- (46) Hutchings, J. B., Crampton, D., & Campbell, B. 1984, ApJ, 280, 41
- (47) Hutchings, J. B. & Gower, A. C. 1985, AJ, 90, 405
- (48) Hutchings, J. B., Janson, T., & Neff, S. G. 1989, ApJ, 342, 660
- (49) Hyland, A. R. & Allen, D. A., 1982, MNRAS, 199, 943
- (50) Impey, C. D., & Neugebauer, G. 1988, AJ, 95, 307
- (51) Isobe, T., Feigelson, E.D., & Nelson P.I. 1986, ApJ, 306, 490
- (52) Jaffe, W., Ford, H. C., Ferrarese, L., van den Bosch, F., O’Connell, R. W., Nat, 364, 213
- (53) Jahoda, K. & Mushotzky, R. F. 1989, ApJ, 346, 638
- (54) Kellerman, K. I., Sramek, R., Schmidt, M., Shaffer, D. B., & Green, R. 1989, AJ, 98, 1195
- (55) Kim, S.-H., Martin, P.G., & Hendry, P. D. 1994, ApJ, 422, 164
- (56) Kotilainen, J. K., Ward, M. J., Boisson, C., DePoy, D. L., & Smith, M. G. 1992, MNRAS, 256, 125
- (57) Laor, A. & Drain, B. T. 1993, ApJ, 402, 441
- (58) Lemke, D., et al. 1996, A&A, 315, L64
- (59) Low, F. J., Cutri, R. M., Kleinmann, S. G., & Huchra, J. P. 1989, ApJ, 340, L1
- (60) Lumsden, S.L., Heisler, C.A., Bailey, J.A., Hough, J.H., & Young, S. 2001, MNRAS, 327, 459
- (61) MacKenty, J.W. 1990, ApJS, 72, 231
- (62) Maiolino, R., Marconi, A., Salvati, M., Risaliti, G., Severgnini, P., Oliva, E., La Franca, F., Vanzi, L. 2001, A&A, 365, 28
- (63) Malizia, A., Bassani, L., Zhang, S. N., Dean, A. J., Paciesas, W. S., & Palumbo, G. G. C. 1999, ApJ, 519, 637
- (64) Marshall, F. E., Boldt, E. A., Holt, S. S., Mushotzky, R. F., Rothschild, R. E., Serlemitsos, P. J., & Pravdo, S. H. 1979, ApJS, 40, 657
- (65) Masci, F. J., Drinkwater, M. J., & Webster, R. L. 1999, ApJ, 510, 703
- (66) Matveyenko, L. I. & Witzel, A. I. 1999, Ast. Let., 25, 643
- (67) McAlary, C. W., McLaren, R. A., McGonegal, R. J., & Maza, J. 1983, ApJS, 52, 341
- (68) McLeod, K. K. & Rieke, M. J. 1994, ApJ, 420, 58
- (69) McLeod, K. K. & Rieke, M. J. 1995, ApJ, 441, 96
- (70) Nenkova, M., Ivezic, Z., & Elitzur, M. 2002, ApJ, 570, L9
- (71) Neugebauer, G., Green, R. F., Matthews, K., Schmidt, M., Soifer, B. T., and Bennett, J., 1987, ApJS, 63, 615
- (72) O’Dea, C. P. 1998, PASP, 110, 493
- (73) Pan, H. C., Stewart, G. C., & Pounds, K. A. 1990, MNRAS, 242, 177P
- (74) Perola, G.C., Matt, G., Cappi, M., Dal Fiume, D., Fiore, F., Guainazzi, M., Mineo, T., Molendi, S., Nicastro, F., Piro, L., & Stirpe, G. 1999, A&A, 351, 937
- (75) Piccinotti, G., Mushotzky, R. F., Boldt, E. A., Holt, S. S., Marshall, F. E., Serlemitsos, P. J., & Shafer, R. A. 1982, ApJ, 253, 485
- (76) Pier, E.A. & Krolik, J.H., 1992, ApJ, 399, L23
- (77) Pier, E.A. & Krolik, J.H., 1993, ApJ, 418, 673
- (78) Polletta, M., Courvoisier, T. J.-L., Hooper, E. J., Wilkes, B. J 2000, A&A, 362, 75
- (79) Rees, M. J., Silk, J. I., Werner, M. W., & Wickramasinghe, N. C. 1969, Nat, 223, 788
- (80) Rees, M. J. 1984, ARA&A, 22, 471
- (81) Remillard, R. A., Bradt, H. V. D., Brissenden, R. J. V., Buckley, D. A. H., Roberts, W., Schwartz, D. A., Stroozas, B. A., & Tuohy, I. R. 1993, AJ, 105, 2079
- (82) Reynolds, C. S. 1997, MNRAS, 286, 513
- (83) Rieke, G. H. 1978, ApJ, 226, 550
- (84) Risaliti, G., Gilli, R., Maiolino, R., & Salvati, M. 2000, A&A, 357, 13
- (85) Roche, P. F., Aitken, D. K., Smith, C. H., Ward, M. J., 1991, MNRAS, 248, 606
- (86) Rowan-Robinson, M. 1995, MNRAS, 272, 737
- (87) Rowan-Robinson, M. & Crawford, J., 1989, MNRAS, 238, 523
- (88) Rush, B., Malkan, M. A., Fink, H. H., & Voges, W. 1996, ApJ 471, 190
- (89) Sanders D. B., Phinney, E. S., Neugebauer, G., Soifer, B. T., & Matthews, K. 1989, ApJ, 347, 29
- (90) Schlickeiser, R., Biermann, P. L., & Crusius-Wätzel, A. 1991, A&A, 247, 283
- (91) Schlickeiser, R. & Crusius, A. 1989, IEEE Trans Plas Sci, 17, 245
- (92) Schwope, A., Hasinger, G., Lehmann, I., Schwarz, R., Brunner, H., Neizvestny, S., Ugryumov, A., Balega, Yu., Tr mper, J., Voges, W. 2000, AN, 321, 1
- (93) Stocke, J. T., Morris, S. L., Gioia, I. M., Maccacaro, T., Schild, R., Wolter, A., Fleming, T. A., & Henry, J. P. 1991, ApJS, 76, 813
- (94) Storrie-Lombardi, L. J., McMahon, R. G., Irwin, M. J., & Hazard, C. 1996, ApJ, 468, 121
- (95) Thomas, H. C., Beuermann, K., Reinsch, K., Schwope, A. D., Truemper, J., & Voges, W. 1998, A&A, 335, 467
- (96) Tokarz, S.P., & Roll, J. 1997, in VI ASP Conference Series, Vol 125, Astronomical Data
- (97) Tozzi, P., Rosati, P., Nonino, M., Bergeron, J., Borgani, S., Gilli, R., Gilmozzi, R., Hasinger, G., Grogin, N., Kewley, L., Koekemoer, A., Norman, C., Schreier, E., Szokoly, G., Wang, J. X., Zheng, W., Zirm, A., & Giacconi, R. 2001, ApJ, 562, 42
- (98) Tran 2003, ApJ, 583, 632
- (99) Turner, T.J. & Pounds, K. A. 1989, MNRAS, 240, 833
- (100) Walter, R. & Fink, H. H. 1993, A&A, 274, 105
- (101) Wang, T.-G., Lu, Y.-J., & Zhou, Y.-Y. 1998, ApJ, 493, 1
- (102) Ward M., Elvis, M., Fabbiano, G., Carleton, N. P., Willner, S. P., & Lawrence, A. 1987, ApJ, 315, 74
- (103) Webster, R. L., Francis, P. J., Peterson, B. A., Drinkwater, M. J., & Masci, F. J. 1995, Nat, 375, 469
- (104) Wilkes, B. J. & Elvis, M. 1987, ApJ, 323, 243
- (105) Wilkes, B. J. 1999a, in “Quasars & Cosmology”, ASP Conf. Ser. 162, ed. G. Ferland & J. Baldwin (San Francisco: ASP), 15
- (106) Wilkes, B. J., Hooper, E. J., McLeod, K. K., Elvis, M. S., Impey, C. D., Lonsdale, C. J., Malkan, M. A., & McDowell, J. C. 1999b, in “The Universe as Seen by ISO”, ESA Special Publications, SP-427, ed. P. Cox, & M. Kessler, 845
- (107) Wilkes, B. J., 2001, in “The New Era of Wide Field Astronomy”, ASP Conf. Ser., 232, eds. by R. Clowes, A. Adamson, & G. Bromage. San Francisco: ASP, 47
- (108) Wilkes, B. J., Schmidt, G. D., Cutri, R. M., Ghosh, H., Hines, D. C., Nelson, B., Smith, P. S., 2002, ApJ, 564, L65
- (109) Wood, K. S., Meekins, J. F., Yentis, D. J., Smathers, H. W., McNutt, D. P., Bleach, R. D., Friedman, H., Byram, E. T., Chubb, T. A., & Meidav, M. 1984, ApJS, 56, 507
- (110) Wolstencroft, Ramon D., Done, C. J., Scarrott, S. M., & Scarrott, R. M. J., 1995, MNRAS, 276, 460
- (111) Young, J. S., Allen, L., Kenney, J. D. P., Lesser, A., Rownd, B., 1996, AJ, 112, 1903
- (112) Yuan, W., Brinkmann, W., Siebert, J., & Voges, W. 1998, A&A, 330, 108
- (113) Zombeck, M. V. 1990, Handbook of Space Astronomy & Astrophysics, 2nd Ed. (Cambridge: CUP), 198
- (114)


| Name | z | type | (J2000) | (J2000) |
|---|---|---|---|---|
| MKN 1152 | 0.053 | Sy1.5 | 01h 13m 50s.09 | 14o 50’ 46.”5 |
| MKN 590 | 0.026 | Sy1.2 | 02h 14m 33s.56 | 00o 45’ 59.”9 |
| ESO 198-G24 | 0.046 | Sy1 | 02h 38m 19s.52 | 52o 11’ 31.”5 |
| 3A 0557383 | 0.034 | Sy1 | 05h 58m 02s.92 | 38o 20’ 05.”7 |
| PG 0804+761 | 0.100 | Sy1 | 08h 10m 56s.31 | +76o 02’ 43.”0 |
| H 1039074 | 0.674 | … | 10h 42m 19s.16 | 07o 40’ 35.”4 |
| NGC 3783 | 0.010 | Sy1 | 11h 39m 01s.77 | 37o 44’ 19.”7 |
| TON 1542 | 0.063 | Sy1 | 12h 32m 03s.60 | +20o 09’ 30.”0 |
| IRAS 13218+0552 | 0.205 | Sy1 | 13h 24m 21s.58 | +05o 36’ 57.”1 |
| MCG 63015 | 0.008 | Sy1.2 | 13h 35m 53s.93 | 34o 17’ 42.”5 |
| IC 4329A | 0.016 | Sy1.2 | 13h 49m 19s.39 | 30o 18’ 35.”3 |
| H 1419+480 | 0.072 | Sy1 | 14h 21m 29s.42 | +47o 47’ 27.”8 |
| MKN 478 | 0.079 | Sy1 | 14h 42m 07s.47 | +35o 26’ 23.”0 |
| H 1537+339 | 0.330 | Sy1 | 15h 39m 52s.23 | +33o 49’ 31.”1 |
| KAZ 102 | 0.136 | Sy1 | 18h 03m 28s.80 | +67o 38’ 10.”0 |
| E 1821+643 | 0.297 | Sy1 | 18h 21m 54s.89 | +64o 21’ 12.”1 |
| H 1834653 | 0.013 | Sy2 | 18h 38m 20s.28 | 65o 25’ 41.”8 |
| MKN 509 | 0.034 | Sy1.2 | 20h 44m 09s.74 | 10o 43’ 24.”5 |
| NGC 7213 | 0.006 | Sy1.5 | 22h 09m 16s.58 | 47o 09’ 36.”0 |
| MR 2251178 | 0.064 | Sy1 | 22h 54m 05s.10 | 17o 34’ 47.”0 |
| MCG 25822 | 0.047 | Sy1.5 | 23h 04m 43s.48 | 08o 41’ 08.”7 |
| Name | 5m | 7m | 12m | 25m | C or Rb | 60m | 100m | C or Rb | 135m | 200m | C or R |
|---|---|---|---|---|---|---|---|---|---|---|---|
| MKN 1152 | … | … | … | … | … | 0.2130.022 | 0.4450.017 | R | 0.5470.030 | 0.3210.041 | R |
| MKN 590 | 0.0190.003 | 0.3220.003 | 0.2880.005 | 0.3900.013 | R | 0.4320.020 | 1.1350.036 | R | 1.8020.053 | 1.6090.064 | R |
| ESO 198G24 | … | 0.0580.003 | 0.0710.005 | 0.0820.013 | R | 0.1070.020 | 0.1280.023 | R | 0.0510.031 | 0.0090.040 | R |
| 3A 0557-383 | 0.0110.003 | 0.2200.003 | 0.3480.005 | 0.5050.013 | R | 0.2210.036 | 0.1510.046 | R | 0.1720.014 | 0.1170.040 | R |
| PG 0804+761 | 0.0200.003 | 0.2170.003 | 0.1950.005 | 0.2460.013 | R | 0.1450.020 | 0.0970.024 | R | 0.0720.018 | 0.0510.040 | R |
| H 1039-074 | 0.006 | 0.0140.003 | 0.0860.020 | 0.0530.019 | C | 0.060 | 0.090 | C | 0.150 | 0.210 | C |
| NGC 3783 | … | 0.4870.015 | 1.9760.031 | 2.9340.097 | C | … | … | … | 3.9100.071 | 1.9490.182 | C |
| TON 1542 | 0.0210.003 | 0.0450.010 | 0.1700.096 | 0.1900.089 | C | … | … | … | 0.1110.036 | 0.1050.051 | C |
| IRAS 13218+0552 | 0.1000.015 | 0.1890.014 | 0.3380.076 | 0.3130.015 | C | 3.011.2 | 0.530.21 | C | 0.2700.041 | 0.180 | C |
| MCG 63015 | 0.1260.027 | 0.2380.015 | 0.6870.013 | 0.8430.319 | C | … | … | … | 0.5840.060 | 0.0960.100 | C |
| IC 4329A | … | 1.2210.020 | 3.0890.321 | 2.1510.077 | C | … | 1.3840.025 | R | 1.1610.040 | 0.7630.047 | R |
| H 1419+480 | 0.0180.012 | 0.0990.015 | 0.2760.029 | 0.2600.175 | C | 0.603 | 0.589 | C | 0.1240.051 | 0.210 | C |
| MKN 478 | 0.0370.003 | 0.0610.005 | 0.1210.033 | 0.2180.049 | C | … | … | C | 0.4570.046 | 0.600 | C |
| H1537+339 | 0.0040.003 | 0.0060.003 | … | 0.0700.019 | C | 0.150 | 0.120 | C | 0.1780.031 | 0.1700.060 | C |
| KAZ 102 | 0.0380.010 | 0.0250.015 | … | … | R | 0.075 | 0.0380.010 | R | 0.1520.061 | 0.1660.085 | C |
| E1821+643 | … | 0.1950.013 | 0.7000.107 | 0.7450.460 | C | … | … | … | … | … | … |
| H 1834653 | … | … | … | … | … | … | … | … | 0.600 0.051 | 0.3060.037 | R |
| MKN 509 | 0.1280.008 | 0.3340.003 | 0.8470.102 | 0.5860.164 | C | … | … | … | … | 0.2250.147 | C |
| NGC 7213 | … | … | … | … | … | … | 3.670.142 | R | 6.7720.340 | 5.4630.392 | R |
| MR 2251178 | 0.0920.005 | 0.1330.005 | 0.3000.070 | 0.1520.015 | C | … | … | … | 0.5080.042 | 0.2250.061 | C |
| MCG 25822 | 0.1120.021 | 0.1760.007 | 0.3920.220 | 0.2380.029 | C | … | … | C | 0.3320.050 | 0.1540.066 | C |
| Name | radio | submm | farIR | Opt/near-IR | UV | X | Starlighta | Half-light radius | Ref. | Gal. b | Intrinsic absorption? c |
|---|---|---|---|---|---|---|---|---|---|---|---|
| 1 | 2 | 3 | 4 | 5 | 6 | 7 | 8 | 9 | 10 | 11 | 12 |
| MKN 1152 | … | … | 9,30 | 9,15,25,31 | 17,22 | 43.87 | … | 34 | 1.67 | no | |
| MKN 590 | … | … | 25,30 | 14,25 | 23 | 2,22,23 | 44.10 | … | 36,37 | 2.60 | no |
| ESO 198G24 | … | … | 9,30 | 25 | 24 | 24 | 43.26 | … | 34 | 5.41 | no |
| 3A 0557383 | … | … | 9,30 | 25 | … | 17,20,22 | 44.60 | 10.0 | 34 | 3.38 | 70 |
| PG 0804+761 | 13 | … | 9,21,30 | 16,7 | 7 | 7,27 | 44.38 | 7.5 | 36 | 3.09 | no |
| H 1039074 | … | … | 9,30 | 9 | … | 28 | 44.60 | 10.0 | … | 3.75 | ? |
| NGC 3783 | … | … | 9,30 | 9,19 | … | 17,22 | 43.50 | … | 34 | 9.01 | no |
| TON 1542 | 13 | … | 9,21,30 | 6,9,16 | 7 | 2,4 | 44.41 | 7.5 | 32,36 | 2.58 | no |
| IRAS 13218+0552 | … | … | 9,5,30 | 5,9 | … | 18 | 44.60 | 10.0 | … | 2.30 | ? |
| MCG 63015 | … | … | 9,25,30 | 9 | 23 | 17,23 | 43.00 | … | 34 | 4.06 | no |
| IC 4329A | … | … | 9,30 | 9,19,25 | … | 17,22 | 42.62 | … | 34 | 4.55 | 15.0 |
| H 1419+480 | … | … | 9,30 | 9 | … | 2,18 | 44.60 | 10.0 | … | 1.72 | no |
| MKN 478 | 13 | 3 | 9,30 | 9,16,19 | 8,23 | 1,2,23 | 44.31 | 6.25 | 36 | 1.01 | no |
| H 1537+339 | … | … | 9,30 | 18 | … | 18,29 | 44.60 | 10.0 | … | 1.97 | no |
| KAZ 102 | 11 | … | 9,30 | 7,9 | 7 | 2,26 | 43.86 | 11.9 | 32 | 4.44 | no |
| E 1821+643 | … | 3,10 | 9,30 | 9 | … | 2,27 | 44.60 | 10.0 | 33 | 3.50 | no |
| H 1834653 | … | … | 9,30 | 9 | … | 17,22 | 43.44 | … | 34 | 6.31 | 1350 |
| MKN 509 | … | 3,10 | 9,25,30 | 19,15,25 | 7 | 2,17,22 | 44.02 | … | 35 | 3.93 | no |
| NGC 7213 | … | … | 9,30 | 9 | … | 17,22 | 43.64 | … | 34 | 3.00 | no |
| MR 2251178 | 11 | … | 9,30 | 12,14,15 | 7 | 7,22 | 44.65 | 12.2 | 32 | 2.82 | no |
| MCG 25822 | … | … | 30 | 14,15,25 | 23 | 17,22,23 | 44.60 | 10.0 | 34 | 3.47 | no |
Note. — References: (1) Boller, Brandt, & Fink 1996, (2) Ceballos & Barcons 1996, (3) Chini, Kreysa, & Biermann 1989, (4) Comastri et al. 1992, (5) Low et al. 1989, (6) Cutri et al. 1985, (7) Elvis et al. 1994, (8) Gondhalekar et al. 1994, (9) Grossan 1992 (10) Hughes et al. 1993, (11) Hutchings & Gower 1985, (12) Hyland & Allen 1982, (13) Kellerman et al. 1989, (14) McAlary et al. 1983, (15) H, J, K photometry - this paper (16) Neugebauer et al. 1987, (17) Piccinoti et al. 1982, (18) Remillard et al. 1993, (19) Rieke 1978, (20) Rush et al. 1996, (21) Sanders et al. 1989, (22) Turner & Pounds 1989, (23) Walter & Fink 1993, (24) Wang, Lu, & Zhou 1998, (25) Ward et al. 1987, (26) Wilkes & Elvis 1987, (27) Williams et al. 1992, (28) Wood et al. 1994, (29) Yuan et al. 1998, (30) ISO observations - this paper, (31) MMT optical spectra - this paper, (32) Hutchings, Crampton, & Campbell 1984, (33) Hutchings, Janson, & Neff 1989, (34) Kotilainen, Ward, & Williger 1993, (35) MacKenty 1990, (36) McLeod & Rieke 1994, (37) McLeod & Rieke 1995.
| Name | J | H | K |
|---|---|---|---|
| MKN 1152 | 12.63 | 11.90 | 11.37 |
| MKN 509 | 11.73 | 10.94 | 10.09 |
| MR 2251178 | 12.56 | 11.89 | 11.11 |
| MCG 25822 | 12.27 | 11.56 | 10.94 |
| Name | L(1.6-3.2) | L(3.2-6.4) | L(6.4-12.8) | L(12.8-25) | L(25-50) | L(50-100) | L(1-10) | L(10-100) | L(3-60) | L(60-200) | L(1-200) | (25/60) | |
|---|---|---|---|---|---|---|---|---|---|---|---|---|---|
| MKN 1152 | -0.01 | -0.03 | |||||||||||
| MKN 590 | -0.12 | -0.32 | |||||||||||
| ESO 198-G24 | -0.20 | -0.53 | |||||||||||
| 3A 0557-383 | 0.44 | 1.16 | |||||||||||
| PG 0804+761 | 0.22 | 0.58 | |||||||||||
| H1039-074 | … | -0.16 | -0.42 | ||||||||||
| NGC 3783 | -0.13 | -0.34 | |||||||||||
| TON 1542 | 0.22 | 0.58 | |||||||||||
| IRAS 13218+0552 | -0.59 | -1.55 | |||||||||||
| MCG -6-30-15 | -0.19 | -0.50 | |||||||||||
| IC 4329A | 0.08 | 0.21 | |||||||||||
| H1419+480 | -0.05 | -0.13 | |||||||||||
| Mkn 478 | -0.48 | -1.26 | |||||||||||
| H1537+339 | … | -0.11 | -0.29 | ||||||||||
| Kaz 102 | 0.08 | 0.21 | |||||||||||
| E1821+643 | -0.35 | -0.92 | |||||||||||
| H1834-653 | -0.03 | -0.08 | |||||||||||
| MKN 509 | -0.32 | -0.84 | |||||||||||
| NGC 7213 | -0.52 | -1.37 | |||||||||||
| MR2251-178 | -0.36 | -0.95 | |||||||||||
| MCG -2-58-22 | -0.06 | -0.16 |
| Name | L(0.2-0.1m) | L(0.4-0.2m) | L(0.8-0.4m) | L(1.6-0.8m) | L(0.1-2.0 keV) | L(2-10 keV) | (1mm-10 keV) |
|---|---|---|---|---|---|---|---|
| MKN 1152 | |||||||
| MKN 590 | |||||||
| ESO 198-G24 | … | ||||||
| 3A 0557-383 | |||||||
| PG 0804+761 | |||||||
| H1039-074 | … | … | |||||
| NGC 3783 | |||||||
| TON 1542 | |||||||
| IRAS 13218+0552 | |||||||
| MCG -6-30-15 | |||||||
| IC 4329A | |||||||
| H1419+480 | |||||||
| Mkn 478 | |||||||
| H1537+339 | |||||||
| Kaz 102 | … | ||||||
| E1821+643 | |||||||
| H1834-653 | |||||||
| MKN 509 | |||||||
| NGC 7213 | |||||||
| MR2251-178 | |||||||
| MCG -2-58-22 |
| Name | a | ||
|---|---|---|---|
| MKN 1152 | 30 | 1000 | … |
| MKN 590bbC – chopped data, R – raster scansGalactic column in units of cm-2. | 20 | 1000 | … |
| ESO 198G24 | 40 | 1000 | 0.2 |
| 3A 0557383 | 20 | 1000 | 0.7 |
| PG 0804+761 | 40 | 1000 | 0.6 |
| H 1039074 | 40 | 500 | … |
| NGC 3783 | 30 | 1000 | 1.4 |
| TON 1542 | 80 | 1000 | … |
| IRAS 13218+0552 | 50 | 1000 | 1.8 |
| MCG 63015 | 40 | 1000 | 1.3 |
| IC 4329A | 40 | 1000 | 0.8 |
| H 1419+480 | 40 | 1000 | 0.3 |
| MKN 478 | 40 | 1000 | 1.8 |
| H 1537+339 | 40 | 500 | … |
| KAZ 102 | 40 | 1000 | 0.2 |
| E 1821+643 | 40 | 1000 | 2.5 |
| H 1834-653 | 50 | 1000 | 1.6 |
| MKN 509 | 40 | 1000 | 2.2 |
| NGC 7213bbthe SED is unusually flat and covers full range of observable temperatures; no strong constraints on temperature can be placed. | 20 | 1000 | … |
| MR 2251178 | 40 | 1000 | 3.7 |
| MCG 25822 | 40 | 1000 | 2.5 aafootnotetext: is the far-IR cutoff slope |
| QSO Name | Lagn () | Mtorus () | h0(pc) | Inclination | |
|---|---|---|---|---|---|
| PG 0804+761 | 5pc | 3 | 0.04 | 0o | |
| MR 2251178 | 2pc | 8 | 0.025 | 0o | |
| IR 13218+0552 | 2pc | 5 | 0.1 | 65o |