2 Max-Planck-Institut für extraterrestrische Physik, Postfach 1312, D-85741 Garching, Germany
Castor A and Castor B resolved
in a simultaneous Chandra and XMM-Newton observation
We present a simultaneous Chandra and XMM-Newton observation of the Castor sextett, focusing on Castor A and Castor B, two spectroscopic binaries with early-type primaries. Our study represents the first unambiguous X-ray detection of all three visual components in the Castor sextett making use of the unprecedented spatial resolution of Chandra. Of the present day X-ray instruments only Chandra can isolate the X-ray lightcurves and spectra of Castor A and B (angular separation ). We compare the Chandra observation with XMM-Newton data obtained simultaneously. Albeit not able to resolve Castor A and Castor B from each other, the higher sensitivity of XMM-Newton allows for a quantitative analysis of their combined high-resolution spectrum. He-like line triplets are used to examine the temperature and the density in the corona of Castor AB. The oxygen triplet provides a density of , typical for stellar coronae. The analysis for the neon triplet results in much higher densities. By means of a simulated RGS spectrum we estimate the contaminating effect of iron lines to the neon triplet. The temporal variability of Castor AB is studied using data collected with the European Photon Imaging Camera onboard XMM-Newton. Strong flare activity is observed with typical rise times of min and exponential decays which are by a factor of slower than the rise. Combining the data acquired simultaneously with Chandra and XMM-Newton each flare can be assigned to its host. Thus we verify that both Castor A and Castor B exhibit flares. Our comparison with the conditions of the coronal plasma of other stars shows that Castor AB behave like typical late-type coronal X-ray emitters supporting the common notion that the late-type secondaries within each spectroscopic binary are the sites of the X-ray production.
Key Words.:
X-rays: stars – stars: individual: Castor – stars: late-type, coronae, activity1 Introduction
Castor is a sextett system at a distance of pc, and composed of three visual stars each of which is by itself a spectroscopic binary. Castor C (= YY Gem) consists of two late-type stars (dM1e + dM1e) and is separated from Castor AB by . The primaries in both Castor A and Castor B are of spectral type A (A1 V and A5 V, respectively). Neither strong stellar winds (typical for early-type stars) nor magnetic activity (typical for late-type stars) are thought to produce X-ray emission in early A-type stars. Nevertheless, observations by EXOSAT allowed to separate two sources of X-ray emission, YY Gem and the visual binary of Castor AB (Pallavicini et al. (1990a)). Castor AB was also marginally resolved from YY Gem by ASCA (see Gotthelf et al. (1994)). The most likely explanation is that the presumably late-type spectroscopic companions of Castor A and/or Castor B are responsible for the X-ray emission. The companion of Castor A is most likely a late-K star in a 9.21 d eccentric orbit, while Castor B’s companion seems to be an early-M dwarf with a 2.93 d circular orbit (Güdel & Schmitt (1996), Heintz (1988)). Schmitt et al. (1994) have argued in favor of Castor A as the X-ray source because they detected microwaves from Castor A but not from Castor B. The latter was, however, subsequently detected as a radio source as well (Güdel & Schmitt (1996)). X-ray and microwave emission are expected to be associated with each other because both are generated as a result of magnetic energy release in flares. In contrast to the Sun, stars are known to be microwave emitters also during phases of quiescence. X-ray and microwave emission in stars have been found to be strongly correlated (Benz & Güdel (1994), Güdel & Benz (1993)).
In a recent XMM-Newton observation Güdel et al. (2001) found that all three visual binaries in the sextett are X-ray sources. The angular separation of Castor A and B is , at the limit of the spatial resolving power of XMM-Newton. The superior resolution of Chandra now allows us to present an unambiguous X-ray detection of both Castor A and Castor B, and for the first time to isolate the X-ray spectrum and lightcurves of both binaries. A contemporaneous XMM-Newton observation provides higher signal-to-noise at both medium- and high-spectral resolution. To date high-resolution X-ray spectra have been presented for about a dozen late-type stars (e.g. Güdel et al. (2001), Ness et al. (2001), Mewe et al. (2001), Raassen et al. (2002), Stelzer et al. (2002), Ness et al. (2002a)), providing for the first time direct access to the physical conditions in stellar coronae by measuring fluxes of individual emission lines. The relative strength of lines from different elements shed light on the temperature, density and abundances in the emitting region. Enlarging the data base of high-resolution studies of stars is important to distinguish which of the observed properties are typical for stellar coronae and which of the objects are peculiar. Observing a variety of stars with different spectral type, multiplicity, rotation, and age will eventually allow to disentangle the influences of these parameters on stellar activity. The combination of our simultaneous XMM-Newton and Chandra observation provides a unique data set with all the capabilities of the present-day generation of X-ray instruments, and enables a detailed study of the characteristics of three coronal X-ray sources in the Castor system.
In Sect. 2 we introduce the observations. The data reduction is described in Sect. 3. We present in brief our analysis of the medium-resolution spectrum (Sect. 4). Modelling the high-resolution spectra obtained with both Chandra and XMM-Newton, and interpretation of the results is the major purpose of this paper (Sect. 5). Therefore, Sect. 4 does not aim at an exhaustive discussion of the medium-resolution spectrum of Castor AB. Rather it is introduced because of the additional information it provides for a better understanding of the high-resolution spectrum which is used along this paper. A study of the X-ray variability of Castor A and B based on the X-ray lightcurves is given in Sect. 6. In Sect. 7 we compare the activity of Castor A and B to other active stars, and in Sect. 8 we summarize our results.
2 Observations
We have obtained deep X-ray observations of the Castor system with both Chandra and XMM-Newton (Obs-IDs 28 and 0112880801, respectively). The observations took place simultaneously on Sep 29/30, 2000. Chandra was used in the the LETGS configuration, i.e. the Low Energy Transmission Grating (LETG) was combined with the High Resolution Camera for Spectroscopy (HRC-S). XMM-Newton allows to perform high-resolution spectroscopy with the Reflection Grating Spectrometer (RGS) and at the same time CCD imaging and spectroscopy with the European Photon Imaging Camera (EPIC). During the observation EPIC was operated in full-window mode with the thick filter inserted due to the optical brightness of Castor ( mag). For the same reason the Optical Monitor was in closed position.
The prime target of this campaign was YY Gem (= Castor C), discussed by Stelzer et al. (2002) where we also presented the observing log. The instrumental setup allows to analyse also the temporal and spectral behavior of the other two visual components of the sextett, Castor A and Castor B. In this paper we focus on the X-ray emission of these two binary stars.
3 Data Reduction
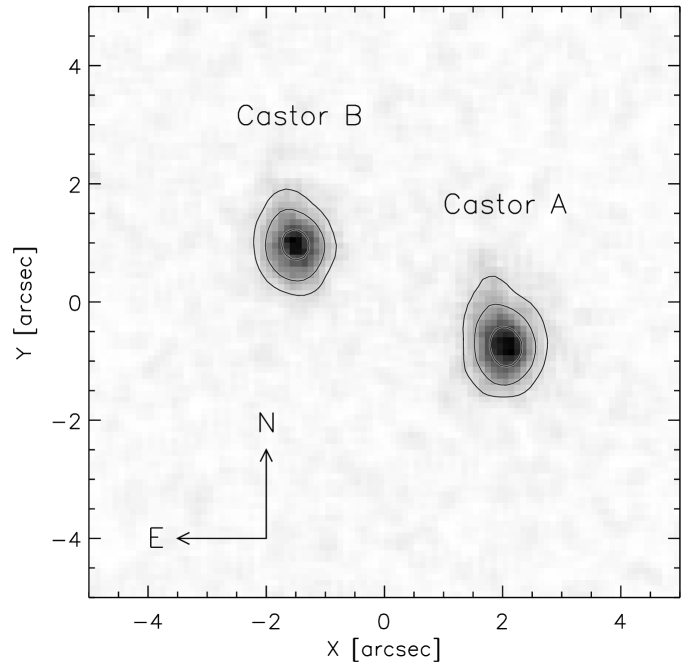
Fig. 1 shows the zeroth order LETGS image of Castor A and B. Their separation on the LETGS image is and the position angle is , in agreement with the value expected from the optical ephemeris (Heintz (1988)).
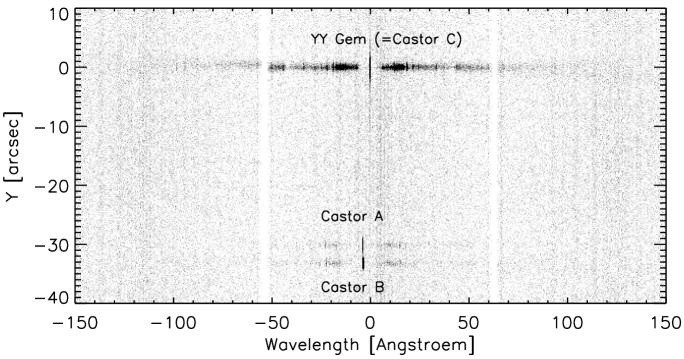
With the LETGS both the dispersed spectrum of Castor A and Castor B and their lightcurves are separable. In Fig. 2 the raw LETGS spectrum of the Castor system is displayed. To extract the LETGS spectrum for Castor A and Castor B we followed the CIAO 2.2 science threads111http://asc.harvard.edu/ciao/threads/spectra-multi-hrc/ for grating spectroscopy with multiple sources. Three sources are detected with tgdetect, corresponding to YY Gem, Castor A, and Castor B. We selected a rectangular box of width in the cross-dispersion direction defining the source spectrum of each Castor A and Castor B. The background was extracted from two larger rectangular regions above and below the source spectrum, and excluding respectively the other two X-ray sources. Lightcurves for Castor A and Castor B are extracted from a circle of radius at their zeroth order position. The background is estimated from an average of the counts in four square-shaped regions arranged symmetrically around the source. After background subtraction we find a total of cts and cts for Castor A and B respectively. The exposure time of Chandra was ksec.
With XMM-Newton Castor A and B are not resolved, but its instruments provide higher sensitivity allowing for a detailed and quantitative analysis. The RGS data were reduced with the standard pipeline rgsproc of the XMM-Newton Science Analysis System (SAS), version 5.3. With help of the bkgexclude parameter we made sure that YY Gem is excluded from the background extraction region. We extracted the first order total spectrum of Castor AB (source plus background) and a background spectrum for analysis with the CORA 222CORA is provided by J.-U. Ness and available at http://www.hs.uni-hamburg.de/DE/Ins/Per/Ness/Cora/index.html line fitting program (see Sect. 5). The RGS response matrix was generated with 6500 energy bins.
The data collected by the European Photon Imaging Camera (EPIC) onboard XMM-Newton was also analysed with the standard XMM-SAS tools, version 5.3. The position of the X-ray source representing Castor AB was determined by searching in an iterative way for the photon centroid at the expected position. Lightcurves and spectra for Castor AB were extracted from a sized circle centered on their X-ray position. This value for the extraction radius corresponds to the point where the integrated radial distribution of counts around the position of Castor AB flattens out. This way we ensure that YY Gem does not contribute significantly to the selected photons. A ksec long time interval near the end of the XMM-Newton pointing was cut out because of higher background (see Fig. 6). The total useful exposure time with EPIC pn amounts to 48.6 ksec.
4 Medium-Resolution Spectrum: EPIC pn
Since this paper concentrates on the specific new achievements enabled by the high spatial and spectral resolution of Chandra and XMM-Newton the EPIC spectrum will only briefly be introduced. We discuss only the pn spectrum, which provides the highest sensitivity among the EPIC instruments.
For the spectral fitting we select photons from a circular region as described in Sect. 3. A background spectrum is obtained from a nearby source-free region of the same area. We restrict the analysis to energies above keV, because the spectral response of pn is not well understood for lower energies. We use the pn redistribution matrix for single and double event patterns released in April 2002 together with an ancilliary response file generated in the course of our data reduction process. Modelling of the spectrum is performed with XSPEC version 11.2.0.
Considerable emission is seen in the pn spectrum up to comparatively high energies. The statistics are good enough to visually identify an Fe feature at keV. The shape of the spectrum is best approximated by a three-temperature (3-T) model describing thermal emission from a hot, optically thin plasma (three VMEKAL models). In the selected energy range absorption is negligible. A model with solar abundances gives for dof, and leaves substantial residuals especially near Å(neon) and Å(oxygen). An acceptable solution () is found for subsolar abundances of iron, oxygen, and neon. All other elements do not have strong enough lines in the sensitive spectral range of EPIC to change the fit result significantly. We summarize the best fit parameters for the 3-T model with variable abundances in Table 1.
| [keV] | [keV] | [keV] | ||
|---|---|---|---|---|
5 High-Resolution Spectra: LETGS and RGS
The high-resolution spectrum of both Castor A and Castor B (displayed in Fig. 3) is that of a typical active late-type dwarf star. The LETGS spectrum, though being quite weak, shows that the major emission lines in both stars are from O VIII, O VII, Ne IX, and Fe XVII. A quantitative analysis of the LETGS spectrum by measuring fluxes for individual lines is subject to large uncertainties because the effective area of the LETGS for off-axis sources is not well-understood. We estimate these uncertainties (a sum of HRC-S and grating efficiency, transmission in the spatially inhomogeneous filter) to amount to %. This is comparable to or smaller than the statistical errors due to the faintness of both Castor binaries. RGS provides higher sensitivity, but no information on the location of the X-ray emission within the Castor AB system. In view of the similarity of the LETGS spectrum of Castor A and Castor B, we feel justified to model the combined RGS spectrum, and consider it as representative for both stars.

In the following we concentrate on the lines from hydrogen- and helium-like ions. The triplets of helium-like ions are composed of resonance , intercombination , and forbidden line, and represent the most interesting lines in terms of plasma diagnostics: Their line ratios and are sensitive to the electron temperature and the electron density of the emitting plasma, respectively (Gabriel & Jordan (1969)). The ratio of hydrogen-like Ly and helium-like line provides a measure for the coronal temperature, as it reflects the presence of different ionization stages of the same element. In the case of Castor AB the only two elements with considerable emission above the background in the triplets and Ly lines are oxygen and neon. The data analysis and results for these two elements are discussed below.
We measured the line strengths with the CORA line fitting application (Ness et al. (2001)). For the LETGS data we used Gaussians to represent the individual emission lines. For RGS line shapes Lorentzians are a better representation than Gaussians. All lines are added to a constant describing the local background.
5.1 Oxygen
In Fig. 4 we show the LETGS and the RGS spectrum in the region of the O VII triplet.


To increase the signal both sides of the LETGS spectrum were co-added. To guide the fit we held the distance between the line centers fixed on the expected value, and restricted the line widths to Å corresponding to the instrumental width of the LETGS. This latter restriction assures that random statistical fluctuations do not influence the line profile. Given the large uncertainties related to poor statistics and low effective area at the off-axis position a conversion of the LETGS counts to line fluxes would not warrant meaningful results, and we renounce on performing this exercise.
For the quantitative analysis only the RGS is used. As the CCD in the relevant part of the spectrum has failed on RGS 2, only RGS 1 is available for the analysis of the O VII triplet. Due to the higher quality of the RGS spectrum as compared to the LETGS it was possible to leave the line centers and line widths free in the fitting process. In Table 2 we give the line parameters (central wavelength, width, number of counts, and photon flux) for the O VII triplet and O VIII Ly line. The flux has been determined from the effective area of the RGS at the respective wavelength after modeling of the count spectrum with CORA.
| Identif. | Line Parameters | |||
|---|---|---|---|---|
| Ph.flux [ | ||||
| [Å] | [Å] | [cts] | ] | |
| Castor AB – RGS 1 | ||||
| O VIII Ly | ||||
| O VII | ||||
| O VII | ||||
| O VII | ||||
| Castor A – LETGS | ||||
| O VIII Ly | ||||
| O VII | ||||
| O VII | ||||
| O VII | ||||
| Castor B – LETGS | ||||
| O VIII Ly | ||||
| O VII | ||||
| O VII | ||||
| O VII | ||||
5.2 Neon
The neon triplet is more difficult to model, as it is known to be blended with a number of iron lines. We included additional Lorentzians to account for iron emission at Å (from Fe XIX) and Å (from Fe XVII). Further lines of Fe XIX may contaminate the and the line of Ne IX, but are indistinguishable from the latter ones in the data. As a first approximation we performed the formal analysis of the neon triplet in the same way as for oxygen, assuming that the contamination by iron is negligible. The best fit together with the data is shown in Fig. 5 on the top. Again only one RGS instrument is available, RGS 2, because of a CCD failure in the relevant spectral range on RGS 1.
To investigate the effect of iron contamination in the neon triplet we made use of the information obtained from the medium-resolution EPIC spectrum (discussed in more detail in Sect. 4). Modeling the EPIC spectrum provides an estimate for temperature and abundances in the X-ray emitting region, but the density can not be well constrained. The contribution of iron to the line emission in the critical spectral range ( Å) can be estimated by generating an artificial RGS spectrum for a plasma that has the same temperature structure as the EPIC spectrum, but no neon. We performed this simulation with XSPEC setting the Ne abundance of the EPIC 3-T best fit model of Table 1 to zero. Then we subtracted the simulated neon-free spectrum from the data. The result is shown in Fig. 5 (bottom), and should give an idea about the actual strength of the Ne IX triplet. Clearly the , , and lines are more pronounced as compared to the pure data, implying that the iron contamination of the data is substantial rendering any physical parameters derived from the spectrum at these wavelengths questionable.


5.3 Coronal Density
We derive the electron temperature and density for the oxygen and neon triplets using the calculations by Porquet et al. (2001) for a collision dominated plasma. As discussed above the line fluxes for the neon triplet derived from the data are severely affected by contaminating iron lines. We continue to include Ne IX in the analysis merely with the aim to investigate the effect of line blending in this spectral range.
The assumption of a collisional plasma is justified if , while larger values of prevail in photo-ionized plasmas. UV radiation from the star can modify the relative intensities of the emission lines by populating one level at the expense of another one (see Porquet et al. (2001)). In particular, the upper level of the forbidden transition can be depopulated to the upper level of the intercombination transition. For typical late-type coronal X-ray emitters the UV flux is low and can be neglected. However, for Castor A and Castor B the A-type primaries in each of the binaries provide substantial UV flux at the position of the X-ray emitting secondary. The influence of radiative processes can be expressed in the radiation temperature . We compute making use of UV fluxes derived from archived International Ultraviolet Explorer (IUE) data of Castor A and B. In Table 3 we tabulate the IUE fluxes of each of the two binaries at the wavelengths corresponding to the excitation energy between the upper levels of the and the line for oxygen and neon. Making use of the distance ( pc), stellar radius (derived from the Stefan-Boltzmann law), and limb darkening (from Table 1 of Diaz-Cordoves et al. (1995)) of Castor A and B we convert the UV flux to intensity and derive from the Planck curve for a blackbody emitting at the corresponding UV wavelength. The effect of the UV emission at the position of the secondary is proportionate to the ’dilution factor’ , which depends on the stellar radius and the distance to the UV source, i.e. the binary separation (see Porquet et al. (2001) for the definition of ).
| Castor A | Castor B | ||||
| effective temperature (1) | K | K | |||
| gravity (1) | |||||
| radius | |||||
| limb darkening coeff. (2) | |||||
| binary separation (3) | AU | AU | |||
| dilution factor | |||||
| O VII | Ne IX | O VII | Ne IX | ||
| [Å] | 1637 | 1270 | 1637 | 1270 | |
| [] | 8 | 4.5 | 8.5 | 4 | |
| [K] | 9950 | 8730 | 9280 | 8250 | |
| (1) - Cayrel de Strobel et al. (1980), (2) - Diaz-Cordoves et al. (1995), | |||||
| (3) - M. Güdel, priv. comm., ∗ V. Costa, priv. comm. | |||||
The case of Castor is complicated by the fact that the UV field and geometrical situation of both components (A and B) differ slightly from each other, but only a combined measurement of the X-ray line ratios is available. Our RGS measurements for the , , and Ly ratios are summarized in Table 4. For the ratio the effect of UV photo-excitation is negligible and we can infer an average temperature for Castor AB. We find MK for oxygen and MK for neon. Using these temperatures we calculated the ratio as a function of density for the two components separately: (A) adopting the radiation temperature and dilution factor of Castor A, and (B) for the values of and of Castor B. While for neon K has no effect on the ratio, for oxygen there are slight differences between the two calculations: We find for Castor A, and for Castor B. Note that this result was derived under the assumption that both stars exhibit the same line ratios. Slight differences in the line ratios may lead to an effect on the density of the same order as the range given above. We summarize the results for the temperatures and densities in Table 4 together with the line ratios.
| Ly | ||||
| [MK] | [] | |||
| Oxygen | ||||
| Neon | ||||
| Neon, data - simulation | ||||
The RGS data of the Ne IX triplet results in a very high density. Such high densities are untypical, though not generally excluded for active stars. Above we have demonstrated that in the case of Castor the neon line ratios are influenced by blending with iron lines. Therefore, a more credible estimate for the density is derived from the spectrum after subtraction of the simulated iron contribution. In Table 4 we confront the results obtained directly from the data and after taking account of the simulation. It turns out that the temperature and density have not changed by much. However, the flux of and , and subsequently any physical parameters derived from them, are subject to large uncertainties. To summarize, it can be concluded that physical parameters derived from the Ne IX triplet should always be regarded with caution, and this part of the spectrum is not suited for an investigation of the conditions in the corona with the RGS instrument. Among the current X-ray instruments only the HETG is able to sufficiently resolve a stellar spectrum in this region (see Ness et al. (2002b)).
6 X-ray Lightcurves

To examine the X-ray variability of Castor A and Castor B we extracted their lightcurves using (A) the Chandra LETGS zeroth order signal, and (B) the XMM-Newton data collected by the EPIC pn.
With EPIC the stars are not resolved, so that only a combined lightcurve of Castor AB is obtained. The EPIC pn lightcurve (Fig. 6, top panel) displays strong variability including four flares within the observing time of ksec. The high signal-to-noise of EPIC pn allows to estimate characteristic parameters for these flares: Rise and decay times, peak luminosity, and energy content are summarized in Table 5. All flares are of short-duration (less than h) and of similar strength. While the rise takes place linearly, the decay phase follows an exponential resulting from cooling. The decay times are typically about a factor longer than the rise times. At peak emission the amplitude has increased by a factor . The energy budget of the flares is listed in columns 5-7 of Table 5. We give the total energy radiated in the flare time interval (as derived from an integration of the EPIC pn spectrum), the amount of energy above the quiescent energy during the flares, and the fractional increase of energy emitted during the flares (see Table caption for a more detailed description).
| # | Host | ||||||
| [min] | [min] | [erg] | [erg] | ||||
| 1 | A+ | ||||||
| 2 | B∗ | ||||||
| 3 | A∗ | ||||||
| 4 | B∗ | ||||||
| ∗ Host assigned from simultaneous, resolved Chandra lightcurves, | |||||||
| + host assigned from photon centroid in MOS image combined with | |||||||
| information for other flares from Chandra (see text in Sect. 6). | |||||||
The second to fourth flare observed with EPIC can be assigned to either one of Castor A or B because of the simultaneous coverage with Chandra (see Fig. 6 and Table 5). In order to determine the host of the first flare, which was observed by XMM-Newton alone, we make use of EPIC MOS images: we extract MOS 1 images for data subsets corresponding to the time of flares. A contour plot of each of these images is seen in Fig. 7. For clarity we have underlaid the contours for the quiescent emission. Their two peaks are separated by outlining the positions of Castor A and B. A shift of the photon peak from one flare to the other is noticeable, indicating that the emission comes from different positions within the Castor AB system. For flare #2 to #4 the star that is closer to the peak of the flare contours is the one which is also listed in Table 5, i.e. the MOS image is consistent with the Chandra lightcurves. The contour of flare #1 suggests that this event took place on Castor A. This way we have identified the host of all flares. However, Fig. 7 makes clear that this analysis puts us at the limit of the capability of EPIC.


To trace the evolution of the coronal temperature during the flares we computed a hardness ratio derived from the counts in a soft band (S; keV) and a hard band (H; keV) of EPIC pn. For this choice of energy bands the Ly line and the triplet of neon, which are indicators of hot plasma, are located in the hard band. The temporal behavior of is displayed in Fig. 8. For three out of the four flares the peak in the spectral hardness precedes that of the lightcurve indicating that the outburst is a result of heating. Flare #2 is remarkably hard, i.e. the relative amplitude of this event in with respect to the other flares is larger than in Fig. 6 where count rates in the keV broad band are shown. Note that this event is weaker in the LETGS lightcurve than expected from direct comparison with the EPIC lightcurve. It seems natural to explain this difference by a combination of flare hardness, i.e. temperature, and instrumental sensitivity. However, emission at higher energies ( keV) where the sensitivity of the LETGS drops sharply is not more prominent than for the other flares.
A time-resolved study of the high-resolution RGS spectrum would provide more information about temperature and density changes during the flares. However, due to poor statistics such an analysis does not seem promising. For Castor C which is brighter in X-rays we found enhanced emission at Å (either from continuum or unresolved lines), and marginal () evidence for variable and ratio during flares (Stelzer et al. (2002)). Similarly Güdel et al. (2002) observed variable emission line fluxes during a giant flare on Proxima Centauri.

7 X-ray Activity Level
X-ray flux, luminosity, and the ratio between X-ray and bolometric luminosity are frequently used to measure the strength of stellar activity. We computed the X-ray luminosity of Castor AB by integrating the time-averaged EPIC pn spectrum. For the ROSAT band we derived erg/s, compatible with earlier measurements of EXOSAT and Einstein (Pallavicini et al. (1990b)), and ROSAT (Schmitt et al. (1994)).
The Chandra data can be used to obtain an independent, estimate of the X-ray luminosity of each of the two binaries. Since the zeroth order does not contain any information on the spectral distribution of the counts we used PIMMS333http://asc.harvard.edu/toolkjet/pimms.jsp to derive the X-ray luminosities. We find erg/s and erg/s in the ROSAT band assuming a one-temperature Raymond-Smith model of keV. While clearly too simplistic this rough estimate shows that the result obtained with both satellites are compatible with each other.
Based on the Chandra luminosities the ratio can be evaluated for all components of Castor AB. To compute the bolometric luminosity for the A-type primaries we made use of the published magnitudes (e.g. Hünsch et al. (1999)) and the bolometric corrections given by Kenyon & Hartmann (1995). The bolometric magnitudes of the secondaries were kindly made available by M. Güdel (priv.comm.). Assuming that the X-rays are emitted by the primaries leads to and for Castor A and B, respectively. This is higher than the canonical value of measured for early-type (OB) stars that produce X-rays in their winds. If instead the unresolved secondaries are responsible for the X-ray emission is and , as typical for late-type active stars. Thus the observed emission level suggests the low-mass companions as X-ray emitters.
Recently, Ness et al. (2002a) investigated the dependence between coronal temperature (expressed in the Ly ratio) and activity level (represented by the X-ray surface flux) for a number of late-type stars. We add Castor AB to this sample. When converting to flux we assumed (i) that the secondaries are the source of the X-rays, and (ii) that the observed X-rays are distributed over the surface of both late-type stars. Both assumptions are supported by our discussion above. Fig. 9 demonstrates that Castor AB are moderately active stars that fit well into the straight correlation between X-ray flux and temperature characterizing stellar coronae.

8 Summary
Castor is so far the only stellar system observed simultaneously with both Chandra and XMM-Newton. The contemporaneous observation allowed us to explore the X-ray emission from this multiple star with unprecedented detail using the complementary capabilities of both satellites.
The Gem system, composed of the two spectroscopic binaries Castor A and Castor B, has been resolved for the first time in X-ray light. At a separation of the only X-ray instrument capable of resolving Castor A and B completely is presently Chandra. The Chandra LETGS allowed us to separate both the lightcurves and the high-resolution spectrum of the binaries, demonstrating that these stars behave like a typical late-type coronal X-ray emitter: they exhibit strong variability including several flares, and their spectrum is dominated by emission lines of O VIII, O VII, Fe XVII, and Ne IX. However, the LETGS spectrum is of low quality (due to the off-axis position and X-ray faintness of Castor A and B).
A quantitative analysis of the high-resolution spectrum of Castor AB was performed with the XMM-Newton RGS. Its resolution is insufficient to resolve the two binaries from each other, but its higher sensitivity allows to use individual emission lines and their flux ratios for coronal diagnostics. We measured the temperature sensitive ratio and the density sensitive ratio of the helium-like ions of oxygen and neon, and compared these ratios to calculations for collisional ionization equilibrium to learn more about the conditions in the coronal plasma of Castor AB. Simulating a neon-free RGS spectrum based on the temperature structure inferred from the EPIC spectrum and subtracting this simulated spectrum from the data we have shown that the neon triplet is severely contaminated by a blend of iron lines which affect the and the line. As a result the density derived from the Ne IX triplet must be regarded as quite uncertain.
For oxygen we are able to derive more reliable plasma parameters. For this element the electron temperature is MK and the electron density is . The two values for the density arise from differences of the radiation field of Castor A and B. However, the assumption of equal line ratios for both stars may have introduced an uncertainty of the same order, such that we consider the values cited above as a likely range for the density rather than two different values for the coronae of the two stars.
Another temperature sensitive line ratio compares the strength of the Ly line of an H-like ion to the resonance line of the He-like ion of the same element. Representing two different ionization stages this ratio directly relates to coronal temperature. We showed that the coronal temperature of Castor AB as measured by Ly fits well into the correlation with X-ray surface flux observed for active stars. Note that the Ly measurements for the active stars we used for comparison (data from Ness et al. (2002a)) were all based on LETGS data, while our data point for Castor derives from an RGS observation. Previous studies of stars observed with both the RGS and the LETGS indicate a tendency of the RGS to measure slightly higher values for Ly than the LETGS (Audard et al. (2001), Raassen et al. (2002), Stelzer et al. (2002)). However, most of the RGS and LETGS measurements are compatible with each other within the statistical uncertainties. Therefore, we consider the respective calibration of both instruments sufficient for a direct comparison.
The X-ray lightcurves of Castor A and Castor B show that both are strongly variable and frequently subject to flaring. With a combination of Chandra lightcurves and EPIC MOS images for individual flares we established the host of each of the six flares: Chandra directly resolves component A and B, while in the MOS image the photon center shifts during flares. Three events occurred on Castor A and three on Castor B. Two of the flares were observed only with Chandra (during the last part of the observation, when the XMM-Newton exposure had already finished). For these two flares the low S/N of Chandra does not allow an analysis of its characteristics. For the four flares that occurred within the observing time of XMM-Newton we made use of the excellent sensitivity of EPIC pn, and derived duration and energy output for each of them. The flare recurrence time can be estimated to one event every h. Similarly strong activity was observed on Castor AB in an earlier XMM-Newton observation presented by Güdel et al. (2001). However, lacking simultaneous high-spatial resolution Chandra data some uncertainty remained as to the origin of the flares (Castor A or B). On basis of this earlier XMM-Newton observation Güdel et al. (2001) supposed that the flare rate on Castor B is higher than on A, and flares decay faster than on A. The observations presented here suggest similar flare rates for both A and B. For the flares observed with XMM-Newton our quantitative analysis shows indeed that decay times are shorter for B than for A. But still better statistics are required to clearly establish a difference in the flaring properties of Castor A and B. The flares on all visual components of the Castor system (including YY Gem; see Stelzer et al. (2002)) are of short-duration similar to the majority of X-ray flares seen on young stars, but in contrast to the common type of long-duration flares on more evolved stars such as RS CVn binaries. The X-ray luminosity and strength of all X-ray flares observed on Castor A and B so far is similar to that of dMe flare stars with amplitudes of a factor of (see e.g. Pallavicini et al. (1990b)). This supports the common believe that the late-type companions in each of the binaries are responsible for the X-ray emission.
Acknowledgements.
We are grateful to D. Porquet for help with the model calculations. BS wishes to thank M. Güdel and V. Costa for providing information on the stellar parameters and UV flux of Castor A and B, and G. Micela for careful reading of the manuscript. The CORA software is kindly provided by J-.U. Ness. BS acknowledges financial support from the European Union by the Marie Curie Fellowship Contract No. HPMD-CT-2000-00013.References
- Audard et al. (2001) Audard M., Behar E., Güdel M., et al., 2001, A&A 365, L329
- Benz & Güdel (1994) Benz A. O.& Güdel M., 1994, A&A 285, 621
- Cayrel de Strobel et al. (1980) Cayrel de Strobel G., Bentolila C., Hauck B. & Curchod A., 1980, A&AS 41, 405
- Diaz-Cordoves et al. (1995) Diaz-Cordoves J., Claret A. & Gimenez A., 1995, A&AS 110, 329
- Gabriel & Jordan (1969) Gabriel A. H. & Jordan C., MNRAS 145, 241
- Gotthelf et al. (1994) Gotthelf E. V., Jalota L., Mukai K. & White N. E. 1994, ApJ 436, L91
- Güdel & Benz (1993) Güdel M. & Benz A. O., 1993, ApJ 405, L63
- Güdel & Schmitt (1996) Güdel M. & Schmitt J. H. M. M., 1996, In: Radio emission from the stars and the Sun, A. R. Taylor & J. M. Paredes (eds.), A.S.P Conf. Ser. 93, 315
- Güdel et al. (2001) Güdel M., Audard M., Magee H., et al., 2001, A&A 365, L344
- Güdel et al. (2002) Güdel M., Audard M., Skinner S. L. & Horvath M. I., 2002, ApJ 580, L73
- Heintz (1988) Heintz W. D., 1988, PASP 100, 834
- Hünsch et al. (1999) Hünsch M., Schmitt J. H. M. M., Sterzik M. F. & Voges W., 1999, A&AS 135, 319
- Kenyon & Hartmann (1995) Kenyon S. J. & Hartmann L., 1995, ApJS 101, 117
- Mewe et al. (2001) Mewe R., Raassen A. J. J., Drake J. J., et al., 2001, A&A 368, 888
- Ness et al. (2001) Ness J.-U., Mewe R., Schmitt J. H. M. M., et al., 2001, A&A 367, 282
- Ness et al. (2002a) Ness J.-U., Schmitt J. H. M. M., Burwitz V., et al., 2002a, A&A 394, 911
- Ness et al. (2002b) Ness J.-U., Brickhouse N. S., Drake J. J. & Huenemoerder D. P., 2002b, ’High resolution X-ray spectroscopy with XMM-Newton and Chandra, held at the Mullard Space Science Laboratory, Oct 24-25 2002, Holmbury St.Mary, England
- Pallavicini et al. (1990a) Pallavicini R., Tagliaferri G., Pollock A. M. T., Schmitt J. H. M. M. & Rosso C., 1990a, A&A 227, 483
- Pallavicini et al. (1990b) Pallavicini R., Tagliaferri G., L. Stella, 1990b, A&A 228, 403
- Porquet et al. (2001) Porquet D., Mewe R., Dubau J., Raassen A. J. J. & Kaastra J. S., 2001, A&A 376, 1113
- Raassen et al. (2002) Raassen A. J. J., Mewe R., Audard M., et al., 2002, A&A 389, 228
- Schmitt et al. (1994) Schmitt J. H. M. M., Güdel M. & Predehl P. 1994, A&A 287, 843
- Stelzer et al. (2002) Stelzer B., Burwitz V., Audard M., et al., 2002, A&A 392, 585