Constraints on the equation of state of dark energy
and the
Hubble constant from stellar ages and the CMB11affiliation: Partly based on observations collected at ESO (La
Silla and Paranal) under programmes 62.O-0592, 63.O-0468, and
64.O-0281, 65.O-0446 and 66.A-0362, and at the W. M. Keck Observatory,
which is operated jointly by the California Institute of Technology and
the University of California.
Abstract
We place constraints on the redshift-averaged, effective value of the equation of state of dark energy, , using only the absolute ages of Galactic stars and the observed position of the first peak in the angular power spectrum of the CMB. We find at the 68% confidence level. If we further consider that , this finding suggests that within our uncertainties, dark energy is indistinguishable from a classical vacuum energy term.
We detect a correlation between the ages of the oldest galaxies and their redshift. This opens up the possibility of measuring by computing the relative ages of the oldest galaxies in the universe as a function of redshift, . We show that this is a realistic possibility by computing at from SDSS galaxies and obtain an independent estimate for the Hubble constant, km s-1 Mpc-1. The small number of galaxies considered at does not yield, currently, a precise determination of , but shows that the age–redshift relation is consistent with a Standard CDM universe with .
1 Introduction
There is now solid observational evidence that the universe is accelerating. The absolute ages of high-redshift galaxies (Dunlop et al., 1996; Spinrad et al., 1997) and the value of the Hubble constant (Freedman et al., 2001), the Hubble diagram of Type Ia supernovae (Riess et al., 1998; Perlmutter et al., 1999), the angular power spectrum of the cosmic microwave background (CMB; Benoit et al., 2002; Ruhl et al., 2002; Goldstein et al., 2002) in combination with galaxy surveys (Efstathiou et al., 2002; Verde et al., 2002) and lensing (Wang et al., 2002), all indicate that the universe is flat and dominated at present by some form of dark energy with negative pressure. Strong confirmation for this comes from the newly released results from the Wilkinson Microwave Anisotropy Probe (WMAP ) first year data (Spergel et al., 2003).
The equation of state of the dark energy, , expresses the ratio between the pressure, , and the mass density, , of the dark energy in terms of the parameter (in units of ). The value of could either be constant, as in the case of a cosmological constant (), or be time-dependent, as in the case of a rolling scalar field or “quintessence” (Peebles & Ratra, 1988; Caldwell et al., 1998). Any such behavior would have far-reaching implications for particle physics.
In this paper we use the ages of the oldest stellar populations between and to derive new and independent constraints on two key cosmological parameters, and . Both parameters are relatively poorly constrained by CMB data alone. For example, in order to get accurate constraints on , Spergel et al. (2003) combined the WMAP data with six external data sets: two additional CMB data sets (CBI and ACBAR; Pearson et al., 2002; Kuo et al., 2002), large scale structure measurements from the 2dF galaxy redshift survey (2dFGRS; Percival et al., 2001; Verde et al., 2002), measurements of the Lyman forest power spectrum (Croft et al., 2002; Gnedin & Hamilton, 2002), the luminosity distance–redshift relation from Type Ia supernovae measurements (Garnavich et al., 1998; Riess et al., 2001), and from the Hubble Space Telescope (HST ) Key Project (Freedman et al., 2001). Therefore it is particularly important to obtain accurate and independent measurements of cosmological parameters relying on different physics.
In Section 2 we focus on , summarizing the basis of our method and deriving tight constraints on the equation of state using the ages of globular clusters in combination with the location of the first acoustic peak in the CMB power spectrum. Then, in Section 3, we determine stellar ages for a sample of early-type galaxies between and and use the age–redshift relationship defined by the old envelope to determine . The prospects of using this method to derive a measurement of are also discussed. Section 4 summarizes and discusses the results.
Throughout the paper we adopt the following notation. The Hubble constant is km s-1 Mpc-1 and is the speed of light. The density of baryons, matter, radiation, photons, neutrinos, and dark energy, at present, in critical units, are indicated as , , , , , and respectively (). The physical quantities, independent of , are indicated with ; e.g., . When needed, a standard, flat, reference CDM model with , , , and is assumed (Spergel et al., 2003).
2 The value of from stellar ages
In this section we use the ages of the oldest globular clusters in combination with the location of the first acoustic peak of the CMB power spectrum (Page et al., 2003) to constrain the value of . The method is briefly described in Section 2.1 and the results are given in Section 2.2.
2.1 Method
If the universe is assumed to be flat, the position of the first acoustic peak ( in the standard spherical harmonics notation) depends primarily on the age of the universe and on the effective value111I.e., the average value over redshift. We use to indicate when is allowed to vary over time. of (Caldwell et al., 1998; Hu et al., 2001; Knox et al., 2001). As noted by these authors, for a fixed value, a change in the physical density parameter that keeps the characteristic angular scale of the first acoustic peak fixed will also leave the age approximately unchanged. Thus an independent estimate of the absolute age of the universe at combined with a measurement of yields an estimate of largely independent of other cosmological parameters (e.g., and ).
This can be better understood by considering that for a constant , the age of a flat universe is given by
| (1) |
The position of the first acoustic peak is fixed by the quantity
| (2) |
where is the scale factor at decoupling, is the sound horizon at decoupling, and is the angular diameter distance at decoupling. For a flat universe,
| (3) |
and
| (4) |
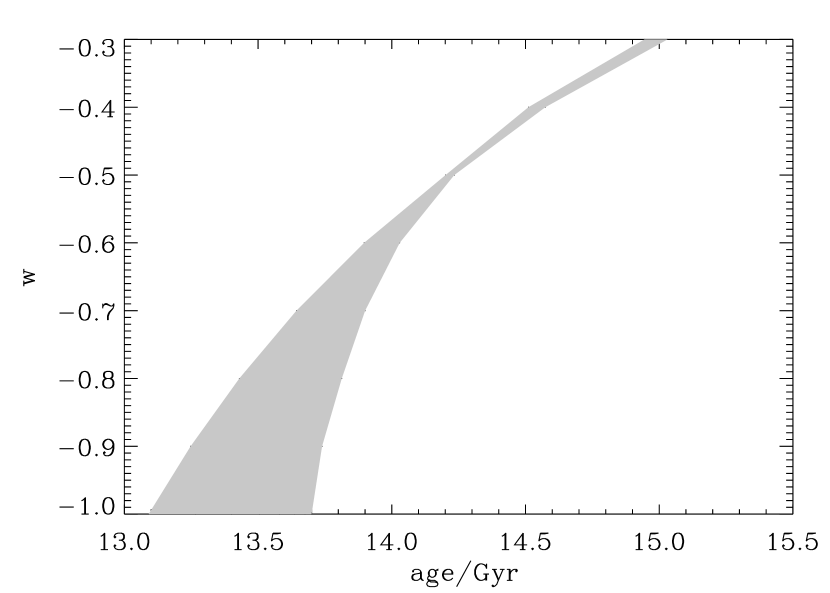
See Verde et al. (2003) for more details. We use equations 1 to 4 and fix to be consistent with the WMAP determination (; Page et al., 2003). Figure 1 shows the allowed region in the age- plane obtained for , , and . It is clear from the plot that an independent and accurate age determination of the universe will provide a measurement of . Thus by using only the WMAP observation of and an independent estimate of the age of the universe, we can place constraints on , largely independent of other cosmological parameters.
2.2 Results from the ages of globular clusters
The ages of the oldest globular clusters (GCs) provide a lower limit to the total age of the universe. Numerous star-forming galaxies have now been observed up to redshift (e.g., Kodaira et al., 2003). Since the oldest GCs contain the oldest stellar populations in galaxies, it is reasonable to assume that GCs too have formed at redshift . Furthermore, since small halos are easily destroyed after reionization (e.g., Bullock et al., 2001), GCs likely formed prior to the reionization epoch. Under this assumption, the WMAP recent estimate of the reionization redshift (Kogut et al., 2003) implies that the ages of the oldest globular cluster do not significantly underestimate the age of the universe.
Globular cluster ages can reliably be estimated in several different ways: from the luminosity of the main-sequence turn-off (if the distance is known), from detached binaries, from the termination of the white-dwarf sequence, and from the luminosity function method which provides a joint constraint on the age and distance of a GC. Renzini et al. (1996) determine the distance to NGC 6752 by means of accurate photometry of GC white dwarfs and obtained an age of Gyr. Using the same method they find 47 Tucanae to have an age of Gyr (Zoccali et al., 2001). Gratton et al. (1997), using the new Hipparcos distance scale to determine main-sequence turn-offs, estimate an age of Gyr (95% confidence level) for the oldest Galactic GCs. Jimenez & Padoan (1998) apply the luminosity function method to M55 and obtain an age of Gyr (95% confidence level). Hansen et al. (2002), using very deep HST images, find the white dwarf cooling sequence for M4 and estimate its age to be Gyr at the % confidence level. Using the theoretical age–mass relation and applying it to the detached eclipsing binary OGLEGC-17, Chaboyer & Krauss (2002) determine Omega Centauri to have an age of Gyr (95% confidence level). These age estimates are all remarkably consistent. Krauss & Chaboyer (2003) perform the most careful analysis to date of the effects of systematics in GC age determinations. They estimate the age of the oldest Galactic GCs using the main-sequence turn-off luminosity and evaluate the errors with Monte-Carlo techniques, paying careful attention to uncertainties in the distance, to systematics, and to model uncertainties. They find a best-fit age for the oldest Galactic GCs of Gyr (95% confidence limits). We adopt their probability distribution for the oldest GC age, which we find can be accurately described by
| (5) |
where denotes the age of the oldest GCs, , , and . Since reionization took place at (Kogut et al., 2003) and we assume that oldest GCs must have formed before then, for all reasonable cosmologies we only need add Gyr to the GC ages to obtain an estimate of the age of the universe. We conservatively add 0.3 Gyr222The uncertainty in this correction is negligible compared to the uncertainty in the determination of GC ages..
In order to constrain , we assume a flat universe and Monte Carlo simulate the distribution of subject to only weak constraints on the other cosmological parameters. For different values of , we generate models, randomly sampling the cosmological parameters , and with uniform priors, , , and . We then impose an age of the universe constraint by randomly sampling these models so that the age of the universe has a probability distribution whose shape is given by equation 5, but offset by Gyr. We use the publicly available code CMBFAST (Seljak & Zaldarriaga, 1996) to compute the resulting distribution of . This is shown in Figure 2 where the two solid lines are the 68% and 90% joint confidence levels.
As expected, the age alone does not constrain ; there is a degeneracy between and . If we now use the observed position of the first acoustic peak as recently measured, in a model independent way, from WMAP (Page et al., 2003), we can constrain with high accuracy. The filled contours in Figure 2 are marginalized values for at the 68% and 90% confidence levels. Thus we find () at the 68% (90%) confidence level. If we drop the assumption that the oldest GC must have formed before reionization, but still impose that they must have formed by , this constraint is slightly weakened. In this case the age distribution of equation 5 needs to be offset by Gyr and we obtain at the 90% confidence level. We have also repeated the calculation using Gaussian priors for the cosmological parameters, , , , and find similar, but slightly more stringent constraints on .
We stress here that this determination depends solely on the GC determination of the age of the universe and on the observed position of the first acoustic peak in the CMB power spectrum. Our constraint is slightly less stringent than that obtained by Spergel et al. (2003) from a joint likelihood analysis of WMAP with six external data sets (WMAP + CBI + ACBAR + 2dFGRS + Lyman forest power spectrum + Type Ia supernovae + constraint from the HST key project), but is tighter than the CMB-only (WMAP + CBI + ACBAR) determination and comparable to the WMAP + ACBAR + CBI + HST constraint.
3 and from the ages of unresolved stellar populations at
3.1 Method
We now turn our attention to the age of the oldest objects in the universe at as a function of redshift. As recently suggested by Jimenez & Loeb (2002), these can be used to determine and therefore to measure and . The Hubble parameter is given by , where is the total density of the universe. For a flat universe composed of matter and dark energy, is related to the equation of state by
| (6) |
where we have used the conservation equation for dark energy density, . Thus a measurement of is also a measurement of ; for further details, see Jimenez & Loeb (2002).
To obtain , Jimenez & Loeb (2002) proposed to use the old envelope of the age–redshift relation of E/S0 galaxies. We assume that E/S0 at different redshifts are drawn from the same parent population with the bulk of their stellar populations formed at relatively high redshift (e.g., Bower et al., 1992; Stanford et al., 1998). Then, at relatively low redshift, they are evolving passively and may be used as “cosmic chronometers”.
In the rest of this section we will apply this method to a sample of spectra (described in §3.2) to identify the age–redshift relation defined by the old envelope (§3.3) and derive an independent measurement of (§3.4). We show that at the level of accuracy of our measurement, the use of the age–redshift relation allows us to apply this method even if a fraction of the stars in E/S0 galaxies is assembled at (e.g., Treu et al., 2002). We also briefly discuss the prospects of using this method to derive .
3.2 Sample and measurement
In order to apply this method we need high-quality spectra of a sample of old stellar populations covering the largest possible range in redshift. To this aim we combine the following data sets: (i) the luminous red galaxy (LRG) sample from the Sloan Digital Sky Survey (SDSS) early data release (Eisenstein et al., 2001); (ii) the sample of field early-type galaxies from Treu et al. (1999, 2001, 2002, hereafter the Treu et al. sample); (iii) a sample of red galaxies in the galaxy cluster MS10540321 at ; and (iv) the two radio galaxies 53W091 and 53W069 (Dunlop et al., 1996; Spinrad et al., 1997; Nolan et al., 2003, Dey et al., in preparation).
The LRG sample is the most heterogenous, since it includes red galaxies in general, regardless of morphology. The Treu et al. sample contains high quality spectra with average per Å. The spectra in the Treu et al. sample have higher than the typical LRG spectrum, but the wavelength coverage is better for the LRG sample (see example in Figure 3). To select potentially passively evolving galaxies, we include only galaxies with per Å and for which passively evolving synthetic stellar population models (Jimenez et al., 1998) provide a good fit to the continuum. This selection criterion discards dusty or star-forming objects. The spectra of seven red galaxies in the cluster MS10540321 were obtained by one of us (DS) on UT 11 March 2002 using the dual-beam Low Resolution Imaging Spectrometer (LRIS; Oke et al., 1995) at Keck Observatory. On the blue side, we used the 300 lines mm-1 grism ( Å; spectral resolution Å) and on the red side, we used the the 400 lines mm-1 grating ( Å; spectral resolution Å). These observations, which were obtained at the parallactic angle, totaled one hour of integration. In order to ensure no gaps in the spectra, half the data were obtained with a D560 dichroic and the remainder were obtained with a D680 dichroic. These spectra have a of 8. We also add the red radio galaxies 53W091 and 53W069 for which accurate ages have already been determined (Dunlop et al., 1996; Spinrad et al., 1997; Nolan et al., 2003, Dey et al., in preparation). Examples of the spectra used are given in Figure 3.
The age of the dominant stellar population in the galaxies is obtained by fitting single stellar population models (Jimenez et al., 1998, 2003a) to the observed spectrum. These models have been extensively tested (Kotoneva et al., 2002; Jimenez et al., 2003b) and have two free parameters: age and metallicity. By construction, star formation is assumed to occur in a single burst of duration much shorter (%) than the current age of the galaxy (Jimenez et al., 1999). Therefore, the derived ages are single-burst equivalent ages. The best fit model is found by standard minimization. Then, stellar ages and their errors are obtained by marginalizing the resulting likelihood surface over metallicity. Some examples for the parameter confidence regions, at the 1 and 2 level, are shown in Figure 3. Note that for galaxies with high , like the Treu et al. sample, the constraints in both age and metallicity are very tight and thus the so-called age-metallicity degeneracy is dramatically reduced and does not affect the age determination at a significant level.
Before we can use the estimated ages to constrain we have to estimate the effects of the potential systematic uncertainties related to adopting a single-burst stellar population model and a single-metallicity model. As far as the first uncertainty is concerned, we know that even massive field E/S0 galaxies can experience some level of star formation activity at (Menanteau et al., 2001; Treu et al., 2002; Willis et al., 2002). The presence of a young and luminous stellar population superimposed on a dominant old stellar population can bias the single-burst equivalent ages of the spectrum to be much younger than the mass-weighted average age. Although this is a serious concern for the interpretation of individual cases, our method relies on the old envelope of the age distribution at any given redshift. Therefore, the effects of this bias on the determination of and are strongly reduced, as we discuss further in § 3.2. Concerning single metallicity, the uncertainty connected to metallicity gradients is negligible with respect to other sources of uncertainty. In fact, our spectra typically cover kpc (for the LRG) to kpc (for the higher redshift samples). Given that typical metallicity gradients in E/S0s follow (Davies et al., 1993), metallicity only changes by 0.2 dex within this region. This is fairly small and the single-metallicity approximation affects our results well within the 1 value of the error in the recovered metallicity.
3.3 An age–redshift relation and
Figure 4 shows the derived single-burst equivalent ages of the galaxies as a function of redshift. The circles correspond to galaxies in the SDSS LRG sample, triangles to the Treu et al. sample, diamonds are galaxies in MS10540321, and crosses are 53W091 and 53W069. For clarity, the SDSS LRG points have not been plotted for ages Gyr. Typical errors on the ages of LRG galaxies are 10% and are not plotted. An age–redshift relation (i.e., an “edge” or “envelope” of the galaxy distribution in the age–redshift plane) is apparent from to .
Although an envelope can be identified, it is important to notice that there is a large spread of ages at any given redshift. In particular, the measured age for many galaxies makes them significantly younger than the age–redshift envelope. This is in part due to a real spread in the star formation histories of early-type galaxies, especially in the field, but mostly a result of using single-burst equivalent ages. Single-burst equivalent ages effectively measure a luminosity-weighted age. Therefore, even a relatively minor episode of star formation is sufficient to significantly underestimate the age of the bulk of (old) stars. Indeed, many of the galaxies in the Treu et al. sample show [O II] 3727 emission, consistent with minor ongoing star formation activity (Treu et al., 2002). Is this contamination enough to bias our results, or is the use of the relative ages of the old-envelope sufficient to reduce this bias to useful levels?
To answer this question we consider a scenario where the bulk of stars in E/S0 galaxies formed at high redshift, while a relatively small fraction (up to 10% in mass) of stars is formed at later times (). This scenario is approximately consistent with the observed evolution of the number density (Im et al., 2002), colors (Jimenez et al., 1999; Menanteau et al., 2001), and spectral properties of early-type galaxies (Trager et al., 2000; Treu et al., 2002). Within this scenario, we use Monte Carlo simulations to estimate the effects of this bias on the age–redshift relation and ultimately on and determinations. We generate galaxy spectra assuming that after the initial burst of star formation at an extra 10% of the stellar mass is formed at a time between redshift with uniform probability for . For simplicity, we use discrete values for the ages with spacing 0.1 Gyr and assume a flat , and cosmology to convert time to redshift. The metallicity for a given galaxy is chosen to be uniformly distributed in the range . Finally, we add random noise to the spectra so that and determine the age with the same procedure used for the data.
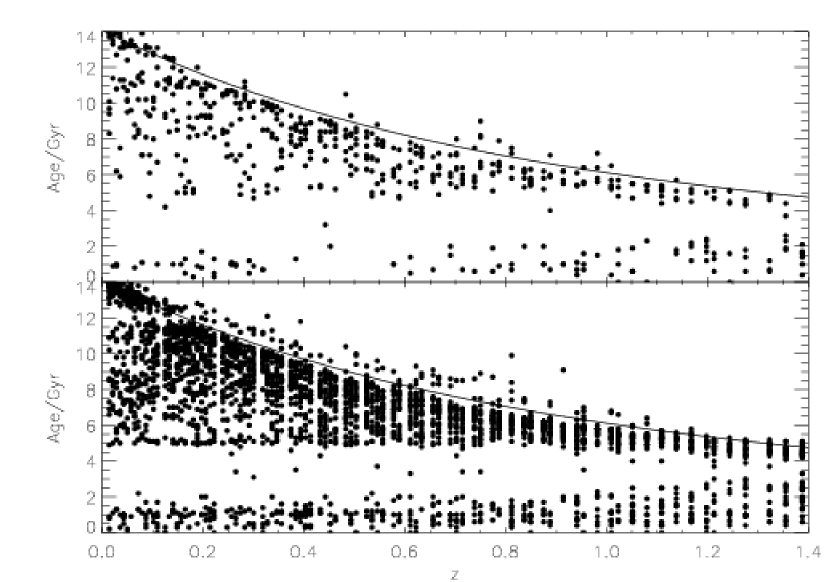
The results of our Monte Carlo simulations are shown in Figure 5. The top panel shows the simulated age–redshift distribution if only six early-types are found per redshift interval333We have drawn galaxies ages randomly from a grid that spans the age range 0.1 to 14 Gyr, with a spacing 0.1 Gyr. For our standard, baseline cosmology, this age spacing translates to the redshift interval seen in Figure 4.. The edge is blurred and smeared due to recent star formation contamination and because of the error in the age determination; nevertheless, it is clearly recognizable. The galaxies observed within a few 100 Myr of bursts have very small single-burst equivalent ages, as observed for some galaxies in the LRG and Treu et al. sample, but they do not interfere with the location of the old envelope.
The lower panel shows the distribution for the case where 60 early-types are observed per redshift bin (this is less than the number of galaxies in the SDSS LRG sample). The solid line shows the theoretical position of the edge, which is remarkably close to observed edge. Note also that increasing the number of galaxies has improved the agreement between the observed and theoretical edge. Thus we conclude that small, recent bursts of star formation do not introduce a significant bias on the edge position; our primary uncertainty in determining to high redshift is the sparse size of the sample of distant, early-types considered here. We can now attempt to recover from this simulation by looking at the shift in the edge position as a function of (see § 3.4 and Jimenez & Loeb, 2002) and thus deduce . We recover for the whole redshift range. This shows that, with a sample similar to the LRG sample extended to higher redshift, we should be able to measure within a few 10%. This is similar to what was already concluded in Jimenez & Loeb (2002).
Having established that the age–redshift relation for the old envelope is not significantly affected by the bias caused by later episodes of star formation, we now consider the observational limits that we can impose on . As a consistency check we note that the age at obtained here is in good agreement with GC ages (see §2) and that the Treu et al. galaxy ages agree with those from of SDSS LRG sample where they overlap. The solid line in Figure 4 corresponds to the age–redshift relation for our flat, reference CDM model: , , and . This is consistent with the observed age–redshift envelope, and it seems to indicate that we live in a universe with a classical vacuum energy density and that, on average, stars in the oldest galaxies formed about 0.7 Gyr after the Big Bang (e.g., at redshifts ). To make the observed age–redshift relation consistent with a model with widely different behavior, we would have to infer that early-type galaxies at different redshifts have very different formation epochs for their stellar populations. For example, the dotted line in Figure 4 indicates the age-redshift relation for an evolving population in a universe where for and grows linearly from at to at . For this model to work, we would have to conclude that the oldest galaxies at formed about 0.7 Gyr after the Big Bang, but that the oldest galaxies at formed Gyr after the Big Bang. Since the oldest galaxies in the LRG sample are as old as the oldest GCs, we consider this to be an unlikely explanation. Furthermore, not only would this scenario require that all local galaxies either formed their stars more recently than galaxies at high redshift or had a recent episodes of recent star formation, but would also require a remarkable fine-tuning for them all to obtain exactly the same age. We therefore conclude that this extreme model for is unlikely given the data.
Unfortunately, the small number of galaxies in our samples at does not allow us to compute with enough accuracy to constrain , and therefore this measurement will have to await better data. However, the region is well populated by LRG galaxies (Figure 4) and we can determine at . This is illustrated in the bottom panel of Figure 4 by the clear shift in the upper envelope of the age histogram between the two redshift ranges and . In the next section we will investigate this phenomenon in more detail and use it to determine .
3.4 The value of
By concentrating on the age–redshift relation for SDSS LRG galaxies at , we now determine the Hubble constant . This procedure relies upon determining the “edge” of the galaxy age distribution in different redshift intervals.
If the ages of the galaxies were known with infinite accuracy, for each galaxyi at redshift , one could associate an age . The probability for the age of the oldest stellar population in galaxyi, , would be given by a step function which jumps from 0 to 1 at . An age–redshift relation edge could then be obtained by dividing the galaxy sample into suitably-large redshift bins and multiplying the for all the galaxies in each bin.
In practice, the age of each galaxy is measured with some error . We thus assume if and where otherwise. We have divided the portion of the LRG sample into 51 redshift bins. For each bin, we obtain by multiplying the of the galaxies in that bin. We define the “edge” of the distribution to be where drops by from its maximum (i.e. . We associate an error to this determination given by where corresponds to where drops by from its maximum (i.e. , this approximately corresponds to the 68% confidence level). This procedure makes the determination of the “edge” less sensitive to the outliers (see also Raychaudhury et al. (1997)). Figure 6 presents the resultant relation.
For , we fit with a straight line whose slope is related to the Hubble constant at an effective redshift by . This fit is performed by standard minimization. We also compute , the probability of obtaining equal or greater value of the reduced if the points were truly lying on a straight line. Values of means that a straight line is not a good fit to the points.
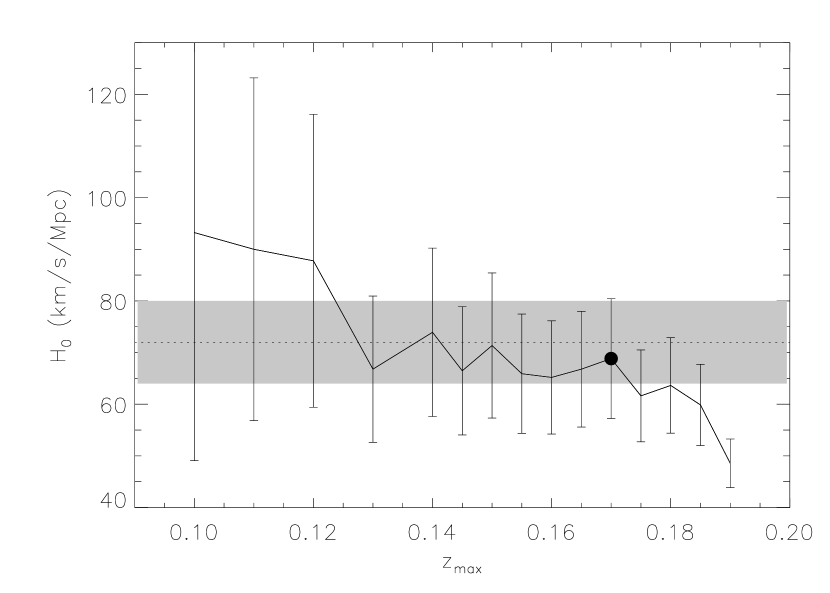
For , we obtain where , . Figure 7 shows how the measurement depends on . For not only the value for drifts but also a straight line is not a good fit to the points ( suddenly drops below ). For our determination, , , , and the correction from to is a effect. We obtain km s-1 Mpc-1.
Our determination is in good agreement with the Hubble Key Project measurement (; Freedman et al., 2001), with the valued derived from the joint likelihood analysis of WMAP + 2dFGRS + Lyman- forest power spectrum (; Spergel et al., 2003), with gravitational lens time delay determinations (; Treu & Koopmans, 2002), and Sunyaev-Zeldovich measurements (; Reese et al., 2002). We emphasize that our method is fully independent from any of the above measurements; it is reassuring that so many different methods yield such a consistent value for .
4 Conclusions
We have obtained tight constraints on the effective value of using solely the determination of the ages of the oldest Galactic globular clusters and the observed position of the first acoustic peak of the CMB power spectrum. Our constraint on is in good agreement with that of Spergel et al. (2003), but is subject to different possible systematics and is very weakly model dependent. Our constraint is slightly less stringent than that obtained by Spergel et al. (2003) from a joint likelihood analysis of WMAP with six external data sets (WMAP + CBI + ACBAR + 2dFGRS + Lyman forest power spectrum + Type Ia supernovae + HST Key Project determination), but is tighter than the CMB-only (WMAP+CBI+ACBAR) determination and comparable to the WMAP + ACBAR + CBI + HST constraint (Spergel et al., 2003). We speculate that the joint constraint from WMAP and all the external data sets considered in Spergel et al. (2003) could be further improved by adding stellar populations age determination as an additional external data set. We have restricted our analysis to values of since theoretical models for seem difficult to construct (Carroll et al., 2003). The use of external data sets (see e.g. Kujat et al. (2002) and references therein for other approaches to measure ) could help to remove this restriction and constrain for values .
We have dated a large sample of galaxies and shown that a clear age–redshift envelope exists. By computing the relative ages of SDSS red galaxies at we obtain an estimate of independent of and in good agreement with determinations from the Hubble Key Project, gravitational lensing time delays, Sunyaev-Zeldovich, and WMAP. We also show that when surveys with a substantial number of high spectra of old galaxies at become available, a determination of the possibly time-dependent equation of state parameter will be obtainable.
References
- Benoit et al. (2002) Benoit et al., A. 2002, astro-ph/0210306
- Bower et al. (1992) Bower, R. G., Lucey, J. R., & Ellis, R. S. 1992, MNRAS, 254, 601
- Bullock et al. (2001) Bullock, J. S., Kolatt, T. S., Sigad, Y., Somerville, R. S., Kravtsov, A. V., Klypin, A. A., Primack, J. R., & Dekel, A. 2001, MNRAS, 321, 559
- Caldwell et al. (1998) Caldwell, R. R., Dave, R., & Steinhardt, P. J. 1998, Physical Review Letters, 80, 1582
- Carroll et al. (2003) Carroll, S., Hoffman, M., & Trodden, M. 2003, astro-ph/0301273
- Chaboyer & Krauss (2002) Chaboyer, B. & Krauss, L. M. 2002, ApJL, 567, L45
- Croft et al. (2002) Croft et al., R. A. C. 2002, ApJ, 581, 20
- Davies et al. (1993) Davies, R. L., Sadler, E. M., & Peletier, R. F. 1993, MNRAS, 262, 650
- Dunlop et al. (1996) Dunlop, J., Peacock, J., Spinrad, H., Dey, A., Jimenez, R., Stern, D., & Windhorst, R. 1996, Nature, 381, 581
- Efstathiou et al. (2002) Efstathiou et al. 2002, MNRAS, 330, L29
- Eisenstein et al. (2001) Eisenstein et al., D. J. 2001, AJ, 122, 2267
- Freedman et al. (2001) Freedman, W. L., Madore, B. F., Gibson, B. K., Ferrarese, L., Kelson, D. D., Sakai, S., Mould, J. R., Kennicutt, R. C., Ford, H. C., Graham, J. A., Huchra, J. P., Hughes, S. M. G., Illingworth, G. D., Macri, L. M., & Stetson, P. B. 2001, ApJ, 553, 47
- Garnavich et al. (1998) Garnavich et al., P. M. 1998, ApJ, 509, 74
- Gnedin & Hamilton (2002) Gnedin, N. Y. & Hamilton, A. J. S. 2002, MNRAS, 334, 107
- Goldstein et al. (2002) Goldstein et al., J. 2002, astro-ph/0212517
- Gratton et al. (1997) Gratton, R. G., Fusi Pecci, F., Carretta, E., Clementini, G., Corsi, C. E., & Lattanzi, M. 1997, ApJ, 491, 749
- Hansen et al. (2002) Hansen, B. M. S., Brewer, J., Fahlman, G. G., Gibson, B. K., Ibata, R., Limongi, M., Rich, R. M., Richer, H. B., Shara, M. M., & Stetson, P. B. 2002, ApJL, 574, L155
- Hu et al. (2001) Hu, W., Fukugita, M., Zaldarriaga, M., & Tegmark, M. 2001, ApJ, 549, 669
- Im et al. (2002) Im, M., Simard, L., Faber, S. M., Koo, D. C., Gebhardt, K., Willmer, C. N. A., Phillips, A., Illingworth, G., Vogt, N. P., & Sarajedini, V. L. 2002, ApJ, 571, 136
- Jimenez et al. (2003a) Jimenez, R., Dunlop, J., MacDonald, J., Padoan, P., & Peacock, J. 2003a, MNRAS
- Jimenez et al. (2003b) Jimenez, R., Flynn, C., MacDonald, J., & Gibson, B. K. 2003b, Science, in press
- Jimenez et al. (1999) Jimenez, R., Friaca, A. C. S., Dunlop, J. S., Terlevich, R. J., Peacock, J. A., & Nolan, L. A. 1999, MNRAS, 305, L16
- Jimenez & Loeb (2002) Jimenez, R. & Loeb, A. 2002, ApJ, 573, 37
- Jimenez & Padoan (1998) Jimenez, R. & Padoan, P. 1998, ApJ, 480, in press
- Jimenez et al. (1998) Jimenez, R., Padoan, P., Matteucci, F., & Heavens, A. F. 1998, MNRAS, 299, 123
- Knox et al. (2001) Knox, L., Christensen, N., & Skordis, C. 2001, ApJL, 563, L95
- Kodaira et al. (2003) Kodaira et al., K. 2003, astro-ph/0301096
- Kogut et al. (2003) Kogut et al., A. 2003, astro-ph/0302213
- Kotoneva et al. (2002) Kotoneva, E., Flynn, C., & Jimenez, R. 2002, MNRAS, 335, 1147
- Krauss & Chaboyer (2003) Krauss, L. M. & Chaboyer, B. 2003, Science, 299, 65
- Kujat et al. (2002) Kujat, J., Linn, A. M., Scherrer, R. J., & Weinberg, D. H. 2002, ApJ, 572, 1
- Kuo et al. (2002) Kuo et al., C. L. 2002, ApJ, submitted (astro-ph/0212289)
- Menanteau et al. (2001) Menanteau, F., Abraham, R. G., & Ellis, R. S. 2001, MNRAS, 322, 1
- Nolan et al. (2003) Nolan, L., Dunlop, J., Jimenez, R., & Heavens, A. F. 2003, MNRAS, in press
- Oke et al. (1995) Oke, J. B., Cohen, J. G., Carr, M., Cromer, J., Dingizian, A., Harris, F. H., Labrecque, S., Lucinio, R., Schaal, W., Epps, H., & Miller, J. 1995, PASP, 107, 375
- Page et al. (2003) Page et al., L. 2003, astro-ph/0302220
- Pearson et al. (2002) Pearson et al., T. J. 2002, ApJ, submitted (astro-ph/0205388)
- Peebles & Ratra (1988) Peebles, P. J. E. & Ratra, B. 1988, ApJL, 325, L17
- Percival et al. (2001) Percival et al., W. J. 2001, MNRAS, 327, 1297
- Perlmutter et al. (1999) Perlmutter et al., S. 1999, ApJ, 517, 565
- Raychaudhury et al. (1997) Raychaudhury, S., von Braun, K., Bernstein, G. M., & Guhathakurta, P. 1997, AJ, 113, 2046
- Reese et al. (2002) Reese, E. D., Carlstrom, J. E., Joy, M., Mohr, J. J., Grego, L., & Holzapfel, W. L. 2002, ApJ, 581, 53
- Renzini et al. (1996) Renzini, A., Bragaglia, A., Ferraro, F. R., Gilmozzi, R., Ortolani, S., Holberg, J. B., Liebert, J., Wesemael, F., & Bohlin, R. C. 1996, ApJ(Lett), 465, L23
- Riess et al. (1998) Riess et al., A. G. 1998, AJ, 116, 1009
- Riess et al. (2001) —. 2001, ApJ, 560, 49
- Ruhl et al. (2002) Ruhl et al., J. 2002, astro-ph/0212229
- Seljak & Zaldarriaga (1996) Seljak, U. & Zaldarriaga, M. 1996, ApJ, 469, 437
- Spergel et al. (2003) Spergel et al., D. 2003, astro-ph/0302209
- Spinrad et al. (1997) Spinrad, H., Dey, A., Stern, D., Dunlop, J., Peacock, J., Jimenez, R., & Windhorst, R. 1997, ApJ, 484, 581
- Stanford et al. (1998) Stanford, S. A., Eisenhardt, P. R. M., & Dickinson, M. 1998, ApJ, 492, 461
- Trager et al. (2000) Trager et al., S. 2000, AJ, 120, 165
- Treu & Koopmans (2002) Treu, T. & Koopmans, L. V. E. 2002, MNRAS, 337, L6
- Treu et al. (1999) Treu, T., Stiavelli, M., Casertano, S., Møller, P., & Bertin, G. 1999, MNRAS, 308, 1037
- Treu et al. (2002) —. 2002, ApJL, 564, L13
- Treu et al. (2001) Treu, T., Stiavelli, M., Møller, P., Casertano, S., & Bertin, G. 2001, MNRAS, 326, 221
- Verde et al. (2002) Verde et al. 2002, MNRAS, 335, 432
- Verde et al. (2003) Verde et al., L. 2003, astro-ph/0302218
- Wang et al. (2002) Wang, X., Tegmark, M., Jain, B., & Zaldarriaga, M. 2002, astro-ph/0212417
- Willis et al. (2002) Willis, J. P., Hewett, P. C., Warren, S. J., & Lewis, G. F. 2002, MNRAS, 337, 953
- Zoccali et al. (2001) Zoccali, M., Renzini, A., Ortolani, S., Bragaglia, A., Bohlin, R., Carretta, E., Ferraro, F. R., Gilmozzi, R., Holberg, J. B., Marconi, G., Rich, R. M., & Wesemael, F. 2001, ApJ, 553, 733