Chandra and XMM-Newton observations of the first quasars: X-rays from the age of cosmic enlightenment
Abstract
We report on Chandra and XMM-Newton observations of a sample of 13 quasars at 4.7–5.4 mostly taken from the Sloan Digital Sky Survey (SDSS). The present sample complements previous X-ray studies of quasars, in which the majority of the objects are optically more luminous and at lower redshifts. All but two of our quasars have been detected in the X-ray band, thus doubling the number of X-ray detected quasars. The two non-detections are likely to be due to a short exposure time (SDSSp J033829.31002156.3) and to the presence of intrinsic absorption (SDSSp J173744.87582829.5). We confirm and extend to the highest redshifts the presence of a correlation between magnitude and soft X-ray flux for quasars, and the presence of a steeper optical-to-X-ray spectral energy distribution (parameterized by ) for high-luminosity, high-redshift quasars than for lower-luminosity, lower-redshift quasars. The second effect is likely due to the known anti-correlation between and rest-frame 2500 Å luminosity, whose significance is confirmed via partial correlation analysis. The joint 2.5–36 keV rest-frame spectrum of the SDSS quasars observed thus far by Chandra is well parameterized by a power-law with photon index =1.84; this photon index is consistent with those of 0–3 quasars and that obtained from joint spectral fitting of 4.1–4.5 optically luminous Palomar Digital Sky Survey quasars. No evidence for widespread intrinsic X-ray absorption has been found ( cm-2 on average at 90% confidence). We also obtained Hobby-Eberly Telescope (HET) photometric observations for eight of our target quasars. None of these shows significant () optical variability over the time interval of a few years (in the observed frame) between the SDSS and HET observations.
The Astronomical Journal, 2003 June, astro-ph/0302558
1 Introduction
One of the main themes in modern astronomy is the study of the earliest massive objects to form in the Universe, now known as far back as the end of the reionization epoch (e.g., Rees 1999; Loeb & Barkana 2001; Fan et al. 2002; Hu et al. 2002). Quasars at can be studied in detail; because of their large broad-band luminosities, they are typically detectable at most wavelengths [e.g., in the radio, Schmidt et al. 1995; Stern et al. 2000; in the millimeter, Omont et al. 2001; Carilli et al. 2001; in the sub-millimeter, McMahon et al. 1999; Isaak et al. 2002; in the near-infrared, Barkhouse & Hall 2001; Pentericci et al. 2003; in the optical, Schneider, Schmidt, & Gunn 1989; Fan et al. 2001; in the X-ray band, Kaspi, Brandt, & Schneider 2000 (hereafter KBS00); Vignali et al. 2001, 2003 (hereafter V01a, V03); Bechtold et al. 2003]. Ground-based, large-area optical surveys such as the Sloan Digital Sky Survey (SDSS; York et al. 2000), the Automatic Plate Measuring facility survey (BRI; Irwin, McMahon, & Hazard 1991), and the Palomar Digital Sky Survey (PSS; Djorgovski et al. 1998) have discovered more than 300 quasars at thus far up to (Fan et al. 2003).111See http://www.astro.caltech.edu/george/z4.qsos for a listing of known high-redshift quasars.
To extend our knowledge of the X-ray properties of quasars, we have started a program to observe, with Chandra and XMM-Newton, both the optically most luminous ( 28.4 to 30.2) 4.1–4.5 PSS/BRI quasars (e.g., V03) and the higher-redshift, optically fainter SDSS quasars (V01a; Brandt et al. 2002; see Brandt et al. 2003 for a recent review). Selecting quasar samples for X-ray observations in two different regions of the luminosity-redshift parameter space allows study of any dependence of the X-ray properties upon the optical selection criteria. In particular, it is possible to test for dependencies of quasar X-ray continua on optical luminosity or redshift.
Here we report the results obtained from 11 Chandra observations and one XMM-Newton observation of a sample of 13 high-redshift ( 4.7–5.4), moderately luminous ( 26.1 to 28.5) quasars, mostly discovered by the SDSS and published in Anderson et al. (2001). One of these quasars (RD 657; Djorgovski et al. 2003) was serendipitously observed and detected in the XMM-Newton observation (i.e., there were two objects in one field). The only target quasar not coming from the SDSS data is BR B03054957 (Storrie-Lombardi et al. 2001; Peroux et al. 2001). Given that the accretion rate (relative to the Eddington rate) of quasars may increase with redshift (e.g., Kauffmann & Haehnelt 2000), the first quasars could show unusual phenomena such as “trapping radius” effects (e.g., Begelman 1979) or accretion-disk instabilities (e.g., Lightman & Eardley 1974). Furthermore, our targets are bright enough to assure in most cases X-ray detections with snapshot (e.g., 4–10 ks) observations, given the correlation found between magnitude and soft X-ray flux (see, e.g., V01a; V03). The number of X-ray detected quasars is approximately doubled by the objects presented here. As shown in Figure 1, where the magnitude is plotted as a function of redshift, the objects presented in this paper suitably complement previous X-ray studies of quasars. All but one of these quasars are likely radio-quiet (see 3 for details).
![[Uncaptioned image]](/html/astro-ph/0302558/assets/x1.png)
versus redshift for the known AGNs [small dots; taken from Djorgovski as of 2002 July (see Footnote 6)]. The X-ray detected (undetected) quasars presented in this paper are shown as filled (open) triangles (Chandra observations) and a filled (open) square (XMM-Newton observation). Filled and open circles indicate X-ray detected AGNs and tight upper limits, respectively, from previous observations [Schneider et al. 1998; Waddington et al. 1999 (note that this identification is still debated; L. L. Cowie 2002, private communication); KBS00; V01a; Brandt et al. 2001, 2002; Silverman et al. 2002; Vignali et al. 2002 (V02); Barger et al. 2002; Bechtold et al. 2003; V03; Castander et al. 2003], most of which were performed by Chandra and ROSAT.
Hereafter we adopt =70 km s-1 Mpc-1 in a -cosmology with =0.3 and =0.7 (e.g., Turner 2002).
2 Observations and Data Reduction
2.1 Chandra Observations
Eleven of the 13 quasars were observed by Chandra during Cycle 3 with 3.7–9.8 ks observations (see Table 1; hereafter all of the quasars will be referred to via their abbreviated names).
TABLE 1
Chandra and XMM-Newton Observation Log
Object
Optical
Optical
X-ray
Exp. Time
HET
Name
(arcsec)
Obs. Date
(ks)
Obs. Date
Ref.
SDSSp J020651.37121624.4
4.81
02 06 51.4
12 16 24.4
0.8
2001 Dec 29
5.88
2001 Dec 10
(1)
SDSSp J023137.65072854.5
5.41
02 31 37.6
07 28 54.5
0.2
2002 Sep 27
4.20
(1)
BR B03054957
4.73
03 07 22.9
49 45 47.8
0.4
2002 Sep 22
3.71
(2,3)
SDSSp J033829.31002156.3
5.00
03 38 29.3
00 21 56.3
2002 Feb 22
5.49
(4)
RD 657
4.96
03 38 30.0
00 18 39.9
1.7
2002 Feb 22
4.85
(5)
SDSSp J075618.14410408.6
5.09
07 56 18.1
41 04 08.6
0.2
2002 Feb 08
7.33
2001 Dec 09
(1)
SDSSp J075652.07450258.9
4.80
07 56 52.1
45 02 58.9
0.5
2002 Oct 04
6.97
2001 Dec 10
(1)
SDSSp J091316.56591921.5
5.11
09 13 16.6
59 19 21.5
0.7
2002 Mar 07
9.84
2002 Feb 07
(1)
SDSSp J094108.36594725.8
4.82
09 41 08.4
59 47 25.8
0.2
2001 Oct 25
4.16
2001 Nov 16–18
(1)
SDSSp J095151.17594556.2
4.86
09 51 51.2
59 45 56.2
0.3
2002 Apr 14
5.13
2002 Feb 07
(1)
SDSSp J102332.08633508.1
4.88
10 23 32.1
63 35 08.1
0.1
2002 Oct 09
4.70
(1)
SDSSp J173744.87582829.5
4.94
17 37 44.9
58 28 29.5
2002 Aug 05
4.62
2002 Jun 08
(1)
SDSSp J221644.02001348.3
4.99
22 16 44.0
00 13 48.3
0.4
2002 Nov 01
7.41
2002 Jun 14
(1)
Note. —
The optical information for the quasars presented here can be found in the papers cited in the
reference column.
For BR B03054957 we use the redshift from Peroux et al. (2001) derived from
two emission lines (Si iv–O iv] and C iv) in their high-quality optical spectrum.
Storrie-Lombardi et al. (2001) reported (see their Table 1) and (see their Fig. 3)
derived from a lower-quality optical spectrum with less wavelength coverage.
a Distance between the optical and X-ray positions;
a blank entry indicates no X-ray detection.
b The Chandra exposure time has been corrected for detector dead time.
The XMM-Newton exposure time, computed from the exposure maps (i.e., taking into account
the decreasing effective exposure at increasing off-axis angles from the aimpoint),
is for the observation after the background flares have been removed (see 2.2).
c XMM-Newton observation.
References. —
Anderson et al. 2001; (2) Peroux et al. 2001; (3) Storrie-Lombardi et al. 2001;
(4) Fan et al. 1999; (5) Djorgovski et al. 2003.
| X-ray Countsa | ||||
| Object | [0.3–0.5 keV] | [0.5–2 keV] | [2–8 keV] | [0.5–8 keV] |
| SDSS 02061216 | 5.9 | 6.9 | ||
| SDSS 02310728 | 22.0 | 23.9 | ||
| BR 03054957 | 4.0 | |||
| SDSS 07564104 | 10.0 | 3.9 | 14.8 | |
| SDSS 07564502 | 2.0 | 2.0 | ||
| SDSS 09135919 | 5.0 | 6.0 | ||
| SDSS 09415947 | 4.8 | 4.2 | ||
| SDSS 09515945 | 3.0 | 3.9 | ||
| SDSS 10236335 | 3.0 | 4.0 | ||
| SDSS 17375828 | ||||
| SDSS 22160013 | 6.0 | 6.9 | ||
a Errors on the X-ray counts were computed according to Tables 1 and 2 of Gehrels (1986) and correspond to the 1 level; these were calculated using Poisson statistics. The upper limits are at the 95% confidence level and were computed according to Kraft, Burrows, & Nousek (1991).
All of the sources were observed with the Advanced CCD Imaging Spectrometer (ACIS; Garmire et al. 2003) with the S3 CCD at the aimpoint. Faint mode was used for the event telemetry format, and ASCA grade 0, 2, 3, 4 and 6 events were used in the analysis. This particular grade selection is standard and appears to optimize the signal-to-background ratio (see 6.3 of the Chandra Proposers’ Observatory Guide). Source detection was carried out with wavdetect (Freeman et al. 2002). We used wavelet transforms (using a Mexican hat kernel) with wavelet scale sizes of 1, 1.4, 2, 2.8, and 4 pixels and a false-positive probability threshold of 10-4. Given the small number of pixels being searched due to the known source positions and the excellent angular resolution of Chandra, the probability of spurious detections is extremely low; most of the sources were in fact detected at a false-positive probability threshold of 10-6. Typically, detections were achieved with a wavelet scale of 1.4 pixels or less.
Source searching was performed in four energy ranges for consistency with our previous work (V01a; V03): the ultrasoft band (0.3–0.5 keV), the soft band (0.5–2 keV), the hard band (2–8 keV), and the full band (0.5–8 keV); in the redshift range of 4.7–5.4 covered by our sample, the full band corresponds to the 2.8–51 keV rest-frame band. All but one of the sources observed by Chandra were detected. The Chandra positions of the detected quasars were found to lie within 0.2′′–0.8′′ of their optical positions (see Table 1); this is consistent with the expected positional error. Given the X-ray weakness of SDSS 07564502 (two full-band counts), we will discuss the reliability of its detection in more detail in 2.1.1. The Chandra non-detection, SDSS 17375828, will be discussed further in 4.1.
The wavdetect photometric measurements are shown in Table 2; they are consistent with independent measurements obtained using manual aperture photometry and a 2′′ radius circular cell. Background is typically negligible in the source extraction region, except for SDSS 09415947, where the observation is partially affected by a background flare; this is taken into account in Table 2. The only object with enough counts to derive a useful power-law photon index via direct X-ray spectral analysis is SDSS 02310728. Assuming only Galactic absorption, it has using the unbinned data and the C-statistic (Cash 1979) with xspec Version 11.2.0 (Arnaud 1996); errors are at the 90% confidence level for one interesting parameter (; Avni 1976; Cash 1979).222To account for the quantum efficiency decay of ACIS at low energies, possibly caused by molecular contamination of the ACIS filters, we have applied a time-dependent correction to the ACIS quantum efficiency. We generated new ancillary response files which have been used in the X-ray spectral analyses presented throughout this paper. This photon index is consistent, within the errors, with those of 0–3 quasars in the rest-frame 2–10 keV band ( 1.7–2.3; e.g., George et al. 2000; Mineo et al. 2000; Reeves & Turner 2000; Page et al. 2003).
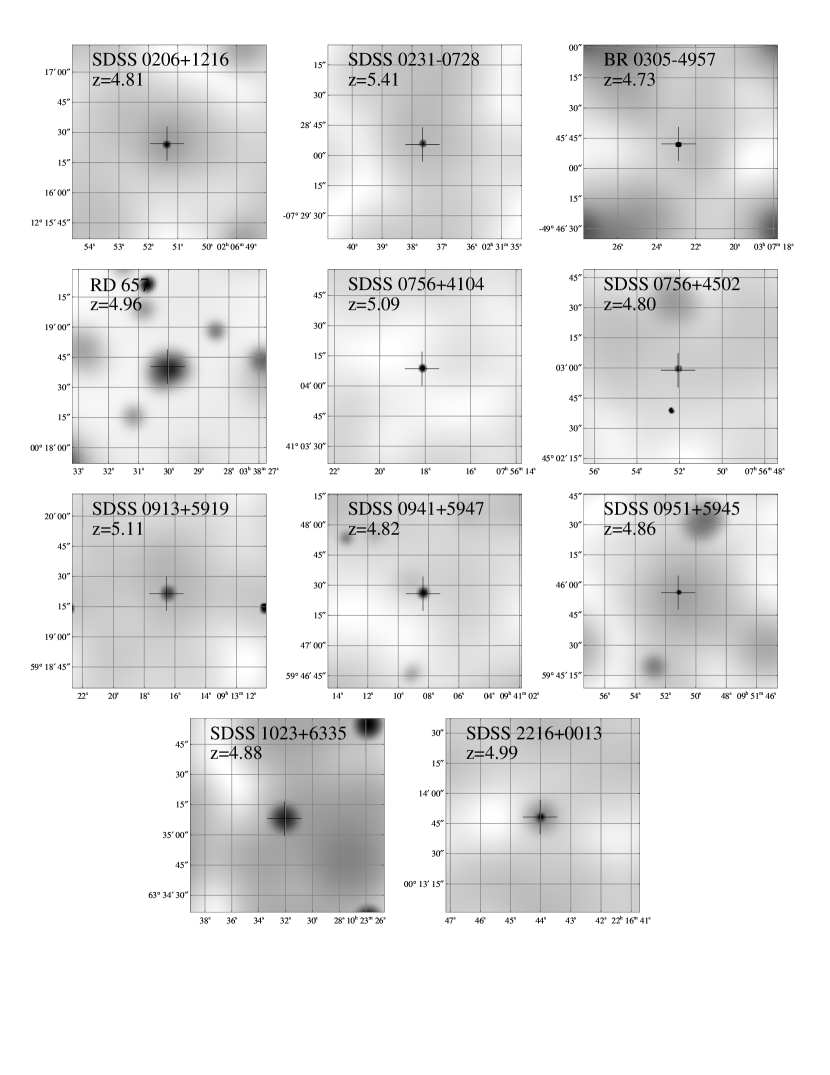
The soft-band images of the detected quasars (full-band image for BR 03054957), adaptively smoothed using the algorithm of Ebeling, White, & Rangarajan (2003), are shown in Figure 2.
2.1.1 Chandra Detection of SDSS 07564502
Similarly to the quasar SDSS 12080010 presented in 2.2 of V01a, SDSS 07564502 () shows only two X-ray photons (both in the observed 0.5–2 keV band) within 0.7′′ of the optical position of the source. The source is detected by wavdetect using a false-positive threshold of 10-4. To investigate further whether the SDSS 07564502 X-ray detection can be considered real, we extracted a 400400 pixel2 ( 200200 arcsec2) region centered on the optical position of the quasar, excluding the immediate vicinity of the quasar itself. We covered this region with 30,000 circles of 1′′ radius whose centers were randomly chosen. The choice of the 1′′ radius aperture appears reasonable, since the full-band 80% encircled-energy radius for on-axis sources is 0.69′′ (see Fig. 6.3 of the Chandra Proposers’ Observatory Guide) and the average positional error for the other quasars detected by Chandra is 0.5′′. The counts obtained in each circle were averaged, giving 0.060 counts circle-1 in the full band and 0.022 counts circle-1 in the soft band. The Poisson probabilities of obtaining two counts or more when 0.060 and 0.022 counts are expected are and , corresponding to one-tailed Gaussian probabilities of 3.3 and 3.9, respectively.
We have directly verified the validity of the Poisson approximation for the SDSS 07564502 field using the count distribution from the 30,000-circle analysis described above. The results of our simulations are in reasonable agreement with the Poisson probabilities. Therefore, in the following, SDSS 07564502 will be considered detected by Chandra.
2.1.2 X-ray Sources Close to the Quasars
Following the method used in 3.4 of V03, we have searched for possible companions for all of the objects observed by Chandra over a region of 100′′100′′ centered on the quasars (see Fig. 2), corresponding to a physical scale of kpc2 at the average redshift of our sample (). Approximately one faint serendipitous X-ray source is found in each quasar field. A comparison of their 0.5–2 keV cumulative number counts (excluding, of course, the quasars themselves) with those obtained from the ROSAT deep survey of the Lockman Hole (Hasinger et al. 1998) and the XMM-Newton moderately deep survey HELLAS2XMM (Baldi et al. 2002) indicates that in the proximity of the SDSS quasars there is no evidence for an X-ray source overdensity. We found a surface density of )=751 deg-2 for the X-ray sources surrounding our SDSS targets (where is the soft X-ray flux limit we reached with the present observations: 2 ).
2.1.3 X-ray Extension of the Quasars
To constrain the presence of gravitational lensing (e.g., Barkana & Loeb 2000; Comerford, Haiman, & Schaye 2002; Wyithe & Loeb 2002), X-ray jets close to the quasars (e.g., Schwartz 2002), and X-ray scattering by dust in the intergalactic medium (e.g., Telis et al. 2003), we performed an analysis of X-ray extension for all the quasars observed by Chandra following the procedure described in 3.5 of V03. All of the quasars’ X-ray images are consistent with the sources being point-like. The separation between multiply imaged sources at 4–5 is expected to be 1–2′′ (Barkana & Loeb 2000). Typical flux ratios of multiply imaged quasars at high redshift are 2–8 (G. Chartas 2003, private communication), being strongly dependent on the shape, mass, redshift, and location of the lensing system. Given the limited number of counts for our detected sources, we expect that only in 30% of the present sample would we be able to detect such multiple images.
2.1.4 X-ray Variability of the Quasars
Given tentative reports of increasing quasar X-ray variability with redshift (in the sense that quasars of the same X-ray luminosity are more variable at ; Manners, Almaini, & Lawrence 2002), we have searched for X-ray variability by analyzing the photon arrival times in the 0.5–8 keV band using the Kolmogorov-Smirnov test. No significant variability was detected from any of our quasars. We note, however, that the analysis of X-ray variability for the quasars studied here is limited by both the short X-ray exposures in the rest frame ( 15 min; see Table 1) and the low X-ray fluxes of most of our quasars.
2.2 XMM-Newton Observation
The SDSS 03380021 field was observed by XMM-Newton for a nominal exposure time of 20.0 ks with the European Photon Imaging Camera (EPIC) pn (Strüder et al. 2001) and for 22.3 ks with the EPIC MOS (Turner et al. 2001) instruments. The data obtained with the Reflection Grating Spectrometer (RGS; den Herder et al. 2001), with a nominal exposure time of 22.8 ks, will not be considered in the following given the weakness of the target. Both the pn and MOS data were acquired in the “full-frame mode” using the thin filter (due to the likely weakness of the target in the X-ray band). The data were reduced with the XMM-Newton Science Analysis Software (sas, Version 5.3.3) with the latest calibration products; we used the epchain and emproc tasks to generate valid photon lists. We filtered the data to avoid background flares (due to 100 keV protons; e.g., De Luca & Molendi 2002) which affect most of this XMM-Newton observation. To select good time intervals, we apply thresholds of 0.35 counts s-1 and 0.15 counts s-1 to pn and MOS data in the 10–12.4 keV and 10–13 keV energy bands, respectively (A. Baldi 2002, private communication). In these energy bands, the counts are mostly from the background. The final, on-axis useful exposure time for this observation is 5.5 ks for pn and MOS. Both single-pixel and double-pixel events (patterns 0–4) were used when extracting the pn counts, while patterns 0–12 were used for the MOS.
We performed source detection in the 0.3–2 keV, 0.5–2 keV, 0.5–10 keV, 2–10 keV, and 0.3–12 keV bands using the tasks eboxdetect and emldetect and adopting a detection likelihood threshold of 10, corresponding to the 4 detection level. We did not consider the energy range below 0.3 keV because of the enhanced background at low photon energies. The target, SDSS 03380021, was detected in none of the bands; its X-ray non-detection will be discussed further in 4.1.
After our XMM-Newton observation was assigned, Djorgovski et al. (2003) found a quasar (RD 657) located 196′′ from the optical position of SDSS 03380021. In the XMM-Newton pn field-of-view we found a 4.3 X-ray source detected 1.7′′ from the optical position of RD 657 (see Table 1) in the 0.3–12 keV band (15.3 counts). We note the XMM-Newton positional error is larger ( 4–5′′; Metcalfe 2002) than that of Chandra; therefore the X-ray and optical positions are consistent. Assuming the integral 0.5–2 keV number counts of Hasinger et al. (1998) and an X-ray error circle of 1.7′′, we expect spurious associations given the soft X-ray flux of this source (3.6 ; see Table 3). Therefore, we are confident that the serendipitously detected X-ray emission is associated with RD 657. For this source we compared the 4.3 detection obtained by the sas detection tasks with that obtained in a different way with SExtractor (Bertin & Arnouts 1996), finding similar results in both the number of counts and the significance of the source (3.6).
Inspection of the X-ray image at the source position confirms the X-ray detection (see Fig. 2 for the 1.5 level adaptively smoothed image in the 0.3–12 keV band). RD 657 also seems to be present in the 0.3–2 keV adaptively smoothed image, although the quasar is not detected in this band by the sas procedure described above. Even though there has been speculation that SDSS 03380021 and RD 657 mark a large-scale structure, perhaps a proto-cluster at 5 (Djorgovski et al. 2003), we found no clear evidence for diffuse X-ray emission or an over-density of X-ray sources around these two quasars. Our constraints are not tight, however, due to the short exposure time and relatively high background of XMM-Newton. Since the background in the XMM-Newton observation is higher and more complex than in the Chandra observations, for SDSS 03380021 and RD 657 we do not report the counts in individual bands but directly derived the main X-ray parameters in Table 3 (see 3). We have also analyzed the XMM-Newton data with less conservative background screening choices and our main results are unchanged; SDSS 03380021 is not detected and RD 657 is detected.
2.3 Hobby-Eberly Telescope Observations
Given that quasars frequently vary in both the optical and X-ray bands, one must be concerned about the reliability of the frequently employed optical-to-X-ray power-law slope whenever observations in the two bands are not simultaneous. To search for optical variability, eight of the 13 quasars in our sample were observed with the 9-m Hobby-Eberly Telescope (Ramsey et al. 1998).333HET observations were not performed for SDSS 02310728, BR 03054957, SDSS 03380021, RD 657, and SDSS 10236335. Short (2 min; 4 min for SDSS 09415947) -band images of the quasar fields were taken with the HET’s Marcario Low-Resolution Spectrograph (LRS; Hill et al. 1998a,b; Cobos Duenas et al. 1998) generally within 1–2 months of the X-ray observations (1–2 weeks in the rest frame; see Table 1).444The only exception is SDSS 07564502, observed by the HET 10 months before the X-ray observation. The HET images covered fields on a side, and using the published finding charts of the fields it was possible to obtain an approximate photometric calibration using stellar objects in the fields. Although it is difficult to give precise estimates given the difference between the LRS and SDSS bandpasses, it is clear that none of the quasars observed with the HET has varied significantly (by %) in brightness from its published value. These constraints on the optical flux variability allow for at most an uncertainty of 0.05 in the determination (see 3). The lack of large brightness variations in the sample is not surprising considering the relatively small
| Object | aaFrom Dickey & Lockman (1990) in units of cm-2 . | bbRest-frame 2500 Å flux density in units of erg cm-2 s-1 Hz-1. | Count rateccObserved count rate computed in the 0.5–2 keV band in units of counts s-1. | ddGalactic absorption-corrected flux in the observed 0.5–2 keV band in units of erg cm-2 s-1. These fluxes and the following X-ray parameters have been corrected for the ACIS quantum efficiency decay at low energy. | eeRest-frame 2 keV flux density in units of erg cm-2 s-1 Hz-1. | ffRest-frame 2–10 keV luminosity corrected for Galactic absorption in units of erg s-1. | ggErrors have been computed following the “numerical method” described in 1.7.3 of Lyons (1991); both the statistical uncertainties on the X-ray count rates and the effects of the observed ranges of the X-ray and optical continuum shapes have been taken into account (see the text for details; see also 3 in V01a). | hhRadio-loudness parameter, defined as = (rest frame; e.g., Kellermann et al. 1989). The rest-frame 5 GHz flux density is computed from the observed 1.4 GHz flux density assuming a radio power-law slope of with . | ||||
|---|---|---|---|---|---|---|---|---|---|---|---|---|
| (1) | (2) | (3) | (4) | (5) | (6) | (7) | (8) | (9) | (10) | (11) | (12) | (13) |
| SDSS 02061216 | 6.82 | 19.7 | 0.74 | 46.6 | 27.5 | 1.00 | 4.4 | 3.83 | 44.9 | 45.1 | ii1.4 GHz flux density from NVSS (Condon et al. 1998). | |
| SDSS 02310728 | 3.05 | 19.3 | 1.06 | 46.8 | 28.1 | 5.24 | 21.3 | 20.36 | 45.7 | 45.9 | jj1.4 GHz flux density from FIRST (Becker et al. 1995). | |
| BR 03054957 | 2.05 | 18.6 | 2.03 | 47.0 | 28.5 | 0.54 | 2.1 | 1.82 | 44.5 | 44.8 | kkNo radio data are available. | |
| SDSS 03380021 | 8.11 | 20.0 | 0.56 | 46.5 | 27.2 | ii1.4 GHz flux density from NVSS (Condon et al. 1998). | ||||||
| RD 657 | 8.05 | 21.1 | 0.20 | 46.0 | 26.1 | 3.6llThe soft X-ray flux and the subsequent X-ray parameters have been computed from the 0.3–12 keV counts, where the source is detected. | 3.21 | 44.8 | 45.0 | ii1.4 GHz flux density from NVSS (Condon et al. 1998). | ||
| SDSS 07564104 | 4.76 | 20.0 | 0.56 | 46.5 | 27.3 | 1.36 | 5.7 | 5.18 | 45.1 | 45.3 | jj1.4 GHz flux density from FIRST (Becker et al. 1995). | |
| SDSS 07564502 | 4.95 | 20.0 | 0.56 | 46.4 | 27.2 | 0.29 | 1.2 | 1.07 | 44.3 | 44.5 | jj1.4 GHz flux density from FIRST (Becker et al. 1995). | |
| SDSS 09135919 | 3.81 | 20.3 | 0.42 | 46.4 | 27.0 | 0.51 | 2.1 | 1.89 | 44.6 | 44.8 | 410.8ii1.4 GHz flux density from NVSS (Condon et al. 1998). | |
| SDSS 09415947 | 2.16 | 19.2 | 1.17 | 46.8 | 28.0 | 1.15 | 4.4 | 3.84 | 44.9 | 45.1 | ii1.4 GHz flux density from NVSS (Condon et al. 1998). | |
| SDSS 09515945 | 1.44 | 19.6 | 0.81 | 46.6 | 27.6 | 0.59 | 2.2 | 1.96 | 44.6 | 44.8 | ii1.4 GHz flux density from NVSS (Condon et al. 1998). | |
| SDSS 10236335 | 1.01 | 19.5 | 0.88 | 46.7 | 27.7 | 0.64 | 2.4 | 2.15 | 44.6 | 44.8 | ii1.4 GHz flux density from NVSS (Condon et al. 1998). | |
| SDSS 17375828 | 3.58 | 19.1 | 1.28 | 46.8 | 28.1 | jj1.4 GHz flux density from FIRST (Becker et al. 1995). | ||||||
| SDSS 22160013 | 4.68 | 20.1 | 0.51 | 46.4 | 27.1 | 0.81 | 3.5 | 3.09 | 44.8 | 45.0 | jj1.4 GHz flux density from FIRST (Becker et al. 1995). |
Note. — Luminosities are computed using =70 km s-1 Mpc-1, =0.3, and =0.7.
2
amount of time in the rest frame (several months) between the SDSS photometry and the X-ray/HET observations.
To investigate the nature of SDSS 17375828, the only quasar that was not detected in the Chandra observations, we performed a 30-min LRS spectroscopic observation. This was taken with the 300 line mm-1 grating, an OG515 blocking filter, and a slit width of 2′′ (with a seeing of 1.6′′), providing a spectrum in the wavelength range 5100–10200 Å at a resolving power of 240–300. The spectroscopic data were reduced using standard iraf routines. The wavelength calibration was performed using a Ne arc lamp, while the flux calibration was achieved using the standard star BD 17 4708, observed during the same night. The HET spectrum (black curve in Fig. 3) is discussed in 4.1 along with the SDSS spectrum (adapted from Anderson et al. 2001; grey curve in Fig. 3).
![[Uncaptioned image]](/html/astro-ph/0302558/assets/x3.png)
Optical spectra of SDSS 17375828 obtained with the HET (30-min exposure; black curve) and by the SDSS (adapted from Anderson et al. 2001; grey curve). No correction for the telluric lines has been applied to the HET spectrum (the affected regions of the HET spectrum are shaded). The likely absorption features from N v and Ly are shown (see 4.1 for details).
A direct comparison of the continuum levels of the two spectra is difficult. While the uncertainty in the calibration of the SDSS spectrum is less than 20%, it is hard to obtain an accurate HET flux calibration mostly because of the variations of effective aperture produced by its optical design (in addition to problems due to slit losses).
3 Multi-wavelength Properties of Quasars
The principal optical, X-ray, and radio properties of the quasars in our sample are shown in Table 3.
A description is as follows:
Column (1). — The abbreviated name of the source.
Column (2). — The Galactic column density (from Dickey & Lockman 1990)
in units of 1020 cm-2.
Column (3). — The monochromatic rest-frame magnitude (defined in 3b of
Schneider et al. 1989) with estimated errors 0.1 mag. The absolute photometry is correct
to within 0.05 mag (Anderson et al. 2001), while the computation of the magnitude
using the photometric measurements and the composite SDSS quasar spectrum (Vanden Berk et al. 2001)
is correct to within 0.05–0.10 mag.
Columns (4) and (5). — The 2500 Å rest-frame flux density and luminosity.
These were computed from the magnitude assuming an optical power-law slope of
( ; Fan et al. 2001)
to allow direct comparison with the results presented in V01a and V03.
The 2500 Å rest-frame flux densities and luminosities are reduced by 15%
when the power-law slope of the optical continuum is changed to (e.g., Vanden Berk et al. 2001;
Schneider et al. 2001).
Column (6). — The absolute -band magnitude computed using .
If is adopted for the extrapolation,
the absolute -band magnitudes are fainter by 0.35 mag.
Columns (7) and (8). — The observed count rate in the 0.5–2 keV band and the corresponding
flux (), corrected for Galactic absorption.
This flux has been calculated using pimms (Version 3.2d; Mukai 2002) and
a power-law model with , as derived for samples of 0–3 quasars
(e.g., George et al. 2000; Mineo et al. 2000; Reeves & Turner 2000; Page et al. 2003) and
optically luminous, PSS quasars (V03); see also 4.3.
The X-ray fluxes reported in this paper have been corrected for the ACIS quantum efficiency decay at low energy (see Footnote 7). For each quasar, we produced an ancillary response file (ARF) assuming an exponential decay for the ACIS quantum efficiency. From each ARF we derived an effective area that was used to replace the original ACIS-S effective area in pimms. The 0.5–2 keV flux correction is 20% for the Chandra observations presented here. All of the parameters derived from the measured soft X-ray flux have been corrected. Following this procedure, we also corrected all of the X-ray fluxes of the quasars previously observed by Chandra (see Table A1 in the Appendix for an updated version of the relevant numbers for quasars; also see http://www.astro.psu.edu/users/niel/papers/).
The soft X-ray flux changes by 1–2% over a reasonable range in the adopted power-law photon index, 1.7–2.3. The soft X-ray flux derived from the 0.5–2 keV counts is generally similar (to within 5–20%) to that derived from the 0.5–8 keV counts.
For RD 657,
the 0.5–2 keV flux and subsequent X-ray parameters reported below have been derived
using the counts in the 0.3–12 keV band, where it was detected.
Columns (9) and (10). — The rest-frame 2 keV flux density and luminosity, computed assuming .
Column (11). — The 2–10 keV rest-frame luminosity, corrected for Galactic absorption.
Column (12). — The optical-to-X-ray power-law slope, , defined as
| (1) |
where and are the rest-frame flux densities at 2 keV and 2500 Å,
respectively. The errors on have been computed
following the “numerical method” described in 1.7.3 of Lyons (1991).
Both the statistical uncertainties on the X-ray count rates
and the effects of possible changes in the X-ray ( 1.7–2.3)
and optical ( 0.5 to 0.9; Schneider et al. 2001) continuum shapes
have been taken into account (see 3 of V01a for further details).
Changing the power-law slope of the optical continuum from to
induces a small increase in the values (more positive by 0.03).
Column (13). — The radio-loudness parameter (e.g., Kellermann et al. 1989),
defined as = (rest frame).
The rest-frame 5 GHz flux density was computed from the FIRST (Becker, White, & Helfand 1995) or NVSS
(Condon et al. 1998) observed 1.4 GHz flux density assuming a radio power-law slope of .
The upper limits reported in the table are at the 3 level.
The rest-frame 4400 Å flux density was computed from the magnitude assuming an
optical power-law slope of .
Radio-loud quasars (RLQs) have , whereas radio-quiet quasars (RQQs)
are characterized by (e.g., Kellermann et al. 1989).
SDSS 09135919 is the only radio-loud object ( 411) in our sample and is also the highest redshift () RLQ thus far detected in the X-ray band. For one quasar, BR 03054957, no radio data are available. None of the remaining quasars is a RLQ, although in some cases the observed-frame 1.4 GHz flux-density constraints provided by the NVSS are not sufficiently tight to prove that a quasar is radio quiet (); at most these objects could be radio moderate (see Table 3). Given that 85–90% of the quasar population is radio quiet (e.g., Stern et al. 2000), we expect the majority of the quasars with radio-loudness upper limits of 10–100 to be radio quiet.
4 Discussion
Thanks mostly to Chandra (e.g., V01a; Brandt et al. 2002; Bechtold et al. 2003; V03) and ROSAT (e.g., KBS00; V03) observations, we have seen a substantial growth in the data needed to study the X-ray properties of quasars. At present, there are 70 quasars at with X-ray detections.555See http://www.astro.psu.edu/users/niel/papers/highz-xray-detected.dat for a regularly updated compilation of X-ray detections at .
![[Uncaptioned image]](/html/astro-ph/0302558/assets/x4.png)
Observed-frame, Galactic absorption-corrected 0.5–2 keV flux versus magnitude for AGNs. Object types are shown in the key. In particular, the objects presented in this paper are plotted as filled triangles (Chandra detections) and a filled square (XMM-Newton detection), while large, thick, downward-pointing arrows indicate X-ray upper limits for the objects of our sample. Chandra RLQs are plotted as circled triangles. ROSAT upper limits (small downward-pointing arrows) are at the 3 confidence level. The slanted dashed lines show the =1.5 and =1.8 loci at (the average redshift of the present sample). The dotted line shows the best-fit correlation reported in 4 [Equation (2)] for the whole sample of optically selected RQQs.
Figure 4 shows the observed-frame, Galactic absorption-corrected 0.5–2 keV flux versus magnitude for a compilation of Active Galactic Nuclei (AGNs). The detected objects presented in this paper are shown as filled triangles (10 Chandra detections) and a filled square (one XMM-Newton detection), while large and thick downward-pointing arrows indicate the two quasars in our sample with X-ray upper limits. Because this figure is constructed from directly observed physical quantities, it is robust and useful for planning future X-ray observations of high-redshift quasars. We present a complementary discussion based on , a parameter somewhat less directly tied to observation, in 4.2.
Quasars are well-known X-ray emitters at 0–3 (e.g., Vignali et al. 1999; Reeves & Turner 2000; Page et al. 2003). Figure 4 indicates that X-ray emission is also a universal property of quasars.
Previous studies of quasars have shown that there is a significant correlation between and 0.5–2 keV flux (V01a; V03). The new X-ray detections and upper limits provided by the present work significantly improve the study of this correlation at fainter optical magnitudes. The average magnitude of the sample presented here is 19.7, whereas the average for the bright PSS sample of V03 is 17.9. The presence of this correlation indicates that the same engine (namely accretion onto a supermassive black hole) is powering both the ultraviolet and X-ray emission. To study this correlation using all the available X-ray detections (41) and upper limits (52) for optically selected RQQs (the majority of the objects plotted in Fig. 4), we have used the asurv software package Rev 1.2 (LaValley, Isobe, & Feigelson 1992). To evaluate the significance of the correlation, we used several methods available in asurv, namely the Cox regression proportional hazard (Cox 1972), the generalized Kendall’s (Brown, Hollander, & Korwar 1974), and the Spearman’s models. We have chosen to use only optically selected RQQs in order to have a homogeneous sample (see 4 of Vignali et al. 2002, hereafter V02, for the results of a sample of X-ray selected quasars; also see Silverman et al. 2002 and Castander et al. 2003). Once the Broad Absorption Line quasars (BALQSOs), which are known to be absorbed in the X-ray band (e.g., Brandt, Laor, & Wills 2000; Gallagher et al. 2001, 2002; Green et al. 2001; V01a), are excluded from the analysis (there are four in the original sample), we find that the versus correlation is significant at the % level (all the tests above provide similar results). According to the EM (Estimate and Maximize) regression algorithm (Dempster, Laird, & Rubin 1977), the correlation is parameterized by
| (2) |
which is plotted as a dotted line in Figure 4. Since =, the previous equation may also be written as
| (3) |
In Figure 5 the quantity / is shown as a function of magnitude for the optically selected RQQs observed by Chandra. represents the measured, Galactic absorption-corrected 0.5–2 keV flux, and the flux expected from the best-fit correlation above. The majority of the quasars observed by Chandra are within a factor of two of the best-fit correlation. The only quasar clearly showing a large difference between the measured and expected fluxes is SDSS 02310728 (the brightest X-ray source in our sample). Since its X-ray emission is unlikely to be contaminated by nearby X-ray sources (see Fig. 2), it appears plausible that its unusually large X-ray flux is due to an episode of variability. Unfortunately, the lack of an HET observation for SDSS 02310728 does not allow us to examine this hypothesis further (assuming that the X-ray and optical variability are correlated).
![[Uncaptioned image]](/html/astro-ph/0302558/assets/x5.png)
Plot of / as a function of magnitude for the optically selected RQQs observed by Chandra. represents the Galactic absorption-corrected 0.5–2 keV flux observed by Chandra and the flux expected on the basis of the best-fit correlation between the soft X-ray flux and magnitude discussed in 4 [Equation (2)]. Symbols are the same as in Figure 4. The dotted line indicates where the measured and expected fluxes are the same. To avoid symbol crowding, we have only shown a representative average uncertainty on the flux ratios (the error bar near the middle right).
A constant fit to the data points of Figure 5 (including the associated errors, but excluding the upper limits) is statistically unacceptable ( for 33 degrees of freedom). Excluding SDSS 02310728 improves the quality of the fit (), although it remains unacceptable. This indicates that there is a real dispersion in the quantity plotted in Figure 5 above the statistical noise (see also 4.2).
4.1 X-ray Non-Detections: Likely Explanations
All but two (SDSS 03380021 and SDSS 17375828) of the quasars presented here have been detected in the X-ray band. The non-detection of SDSS 03380021 is probably due to the short exposure time of the XMM-Newton observation once the flaring-background intervals have been removed. Assuming the best-fit parameters of the versus 0.5–2 keV flux correlation reported in Equation (2), we would expect a 0.5–2 keV flux of . Although SDSS 03380021 was observed at the aimpoint, the on-axis flux limit of the XMM-Newton EPIC pn in a 5.5 ks exposure (see Table 1) is a factor of 2 higher than that achieved with Chandra in the same amount of time.
No Chandra source counts were detected at the optical position of SDSS 17375828. The faint ROSAT source reported as a possible counterpart of SDSS 17375828 by Anderson et al. (2001) is clearly present in the Chandra observation, but its X-ray position is 45′′ from the quasar’s optical position. There are two possible explanations for the SDSS 17375828 non-detection: this quasar is either strongly absorbed or intrinsically X-ray weak. If the non-detection is due to the presence of intrinsic X-ray absorption, a column density of cm-2 is necessary to reproduce the Chandra constraints (see Tables 2 and 3) assuming the average = of the sample (see 4.2) and an X-ray photon index of . The absorption possibility finds partial support from the published SDSS 17375828 optical spectrum (Anderson et al. 2001; see the grey curve in Fig. 3), which shows evidence of a strong, narrow N V absorption feature at 4.92. This absorption feature has a fairly high formal significance in the SDSS spectrum, but given the importance of the intrinsic absorption interpretation, we wished to acquire an independent confirmation of the line; the new observation would also allow an investigation of any line variability. We therefore obtained a 30-min spectroscopic observation of SDSS 17375828 with the HET (see 2.3). The resulting spectrum (black curve in Fig. 3) confirms the presence of a clear narrow N V absorption feature. This line is unresolved (the spectral resolution is 1000 km s-1) and has a blueshift of 700 km s-1 relative to the quasar redshift of 4.94 reported by Anderson et al. (2001). In both the SDSS and HET spectra we see evidence for narrow Ly absorption spanning the redshift of the N V absorption feature with the strongest absorption appearing at 4.90 and 4.945. There may be features at similar redshifts in Si IV and C IV, but the signal-to-noise ratio of the spectra prevents us from unambiguously identifying these systems. Nevertheless, the N V line alone strongly suggests that significant internal absorption is present in SDSS 17375828, since N V absorption of this strength is rarely caused by intervening galaxies (e.g., York et al. 1991) and the absorption is blueshifted with respect to the emission-line redshift. The Ly emission line appears weak; the rest-frame equivalent width is only 35 Å. On average, the rest-frame equivalent width of Ly N V in high-redshift quasars is 70–80 Å (Schneider, Schmidt, & Gunn 1991; Fan et al. 2001). The evidence from the HET and SDSS spectra strongly suggests that significant internal absorption is present in SDSS 17375828, but the quasar is clearly not a strong high-redshift BALQSO such as SDSS 08565252 (; Anderson et al. 2001), SDSS 10440125 (; Fan et al. 2000; Brandt et al. 2001; Maiolino et al. 2001; Goodrich et al. 2001), or SDSS 11290142 (; Zheng et al. 2000).
4.2 Results
Previous reports (e.g., V01a; Bechtold et al. 2003; V03) of steeper indices for quasars than for lower-luminosity, lower-redshift quasars are confirmed by the present analysis; see Figure 6. The 12 RQQs of our sample have =1.71 (the error represents the standard deviation of the mean). This average value is considerably steeper than that obtained for, e.g., the Bright Quasar Survey (BQS; Schmidt & Green 1983) RQQs at (=1.56; see Brandt et al. 2000 and V01a). The sample of eight optically luminous PSS RQQs presented in V03 has an even steeper average (=1.77).666This average value is flatter by 0.04 than that originally reported in V03 because of the flux correction discussed in 3. The PSS sample of V03 has , while the one presented here has . According to the known anti-correlation between and 2500 Å luminosity (e.g., Avni, Worrall, & Morgan 1995; Vignali, Brandt, & Schneider 2003, hereafter VBS03; also see the discussion later in this subsection) following the equation777This is an updated version of Equation (2) of VBS03, taking into account the correction for the quantum efficiency decay of ACIS.
| (4) |
we expect an average of 1.70 for the sample of RQQs presented here, in good agreement with the average value reported above. A summary of these results is shown in Figure 6: the distribution for the BQS RQQs (top panel) is clearly different from that of the RQQs observed by Chandra thus far (bottom panel). In both distributions, some of the quasars with the steepest values are BALQSOs or mini-BALQSOs; areas with arrows indicate upper limits.
![[Uncaptioned image]](/html/astro-ph/0302558/assets/x6.png)
distributions for the BQS RQQs observed by ROSAT (top) and RQQs observed by Chandra (bottom). The shaded areas indicate the BALQSOs or mini-BALQSOs; the areas with arrows indicate 95% confidence upper limits. The average uncertainty in the measurements from the Chandra observations is shown in the bottom panel as the error bar near the upper right.
The principal properties (redshifts, rest-frame 2500 Å and 2–10 keV luminosities, and values) of representative samples of RQQs at low and high redshifts are reported in Table 4.
We find no significant correlation of with either rest-frame 2500 Å luminosity or redshift using only the available RQQs. However, we can also use the new X-ray detections and upper limits presented here to extend the VBS03 study of dependence upon 2500 Å luminosity and redshift.888See 2.2 of VBS03 for discussion about the method used to derive 2500 Å fluxes from the SDSS filters. As in VBS03, we mostly use the SDSS RQQs taken from the Early Data Release (EDR) quasar catalog (Schneider et al. 2002). In particular, at we use the 128 EDR RQQs of VBS03 (see their 3.1.1) covered by pointed ROSAT PSPC and HRI observations, with an overall X-ray detection fraction of 48%. At we use all published Chandra (V01a; Brandt et al. 2002; Bechtold et al. 2003) and XMM-Newton (Brandt et al. 2001) observations of SDSS RQQs in addition to the ones presented in this paper.
TABLE 4
Principal Properties of Three Optically Selected Samples
of RQQs at Low and High Redshifts
Sample Name
BQS
SDSS
PSSBRI
46
16
19
45
13
18
1
3
1
Range of
0.061–0.472
4.62–6.28
4.00–4.73
0.17
5.11
4.28
Median
0.16
4.96
4.23
Range of
29.14–30.70
31.22–31.75
31.54–32.59
29.66
31.53
31.96
Median
29.60
31.55
31.92
Range of
43.36–44.79
44.53–45.89
44.75–45.82
44.07
44.99
45.34
Median
44.13
45.03
45.41
Range of
to
to
to
Median
References
(1,2,3,4)
(4,5,6,7,8)
(5,7,9)
Note. —
The luminosities are in the quasars’ rest frames and have been obtained (or converted)
adopting =70 km s-1 Mpc-1 in a -cosmology
with =0.3 and =0.7.
is in units of erg s-1 Hz-1 and is in units of erg s-1.
Corrections for the Chandra ACIS quantum efficiency decay at low energies have been applied in the computation
of the X-ray luminosities and values (see 3 for details).
BALQSOs and mini-BALQSOs have been excluded from all of the samples used here.
For the SDSS and PSSBRI samples at , the values presented here have been obtained
using Chandra and XMM-Newton results.
For the BQS sample, the rest-frame 2–10 keV luminosities have been obtained from a representative
subsample of 21 BQS RQQs observed by ASCA (George et al. 2000) and BeppoSAX (Mineo et al. 2000)
in the observed 0.5–10 keV and 0.1–10 keV bands, respectively.
This subsample covers approximately the same range in redshift as the original
sample of 46 BQS RQQs with used in 3.1.1 of Brandt et al. (2001).
a The errors on average values represent the
standard deviation of the mean.
b = represents the slope of PG 2214139.
See Appendix A of Laor & Brandt (2002) for a discussion about possible absorption in this quasar.
References. —
(1) Brandt et al. 2000; (2) George et al. 2000; (3) Mineo et al. 2000;
(4) Brandt et al. 2001; (5) V01a; (6) Brandt et al. 2002;
(7) Bechtold et al. 2003; (8) this paper; (9) V03.
In total we have 20 SDSS RQQ observations at (including RD 657, observed in one of the fields surveyed by the SDSS; see 2.2 and Djorgovski et al. 2003), 16 of which have X-ray detections. To improve the statistics at high luminosities and redshifts without introducing any evident bias (see 3.2 of VBS03), we also include 15 PSS RQQs and seven BRI RQQs at observed by Chandra (V01a; Bechtold et al. 2003; V03; Priddey et al., in preparation); only one of these is not detected in the X-ray band (V01a). Therefore, the final sample used in the present analysis is comprised of 170 RQQs ( 58% with X-ray detections) over the redshift range 0.2–6.3 and the rest-frame 2500 Å luminosity range 29.0–32.6. Eleven of these quasars are known BALQSOs; results obtained both including and excluding BALQSOs are presented below. As luminosity is correlated with redshift in flux-limited samples, we use a partial correlation analysis technique developed for use with censored data (Akritas & Siebert 1996). Partial correlation analyses confirm previous findings (e.g., Avni et al. 1995; VBS03): depends primarily upon rest-frame 2500 Å luminosity. The significance of this anti-correlation is 3.5–4.0 (slightly higher than in VBS03), depending upon whether PSS/BRI quasars and BALQSOs are included in the analyses (see Table 5).
TABLE 5
Dependencies of upon redshift and 2500 Å luminosity density
from partial correlation analysis
Sample Name
Number
–
–
of RQQs
SDSS only, with BALQSOs
148
1.2
3.7
SDSS only, without BALQSOs
138
0.9
3.5
SDSS PSS, with BALQSOs
163
1.3
3.9
SDSS PSS, without BALQSOs
152
1.2
3.9
SDSS PSS BRI, with BALQSOs
170
1.4
4.0
SDSS PSS BRI, without BALQSOs
159
1.1
4.0
No significant correlation of with redshift is found. These results suggest that the mechanism driving quasar broad-band emission is similar in the local and early Universe, with no evidence for unusual phenomena in high-redshift quasar nuclei such as “trapping radius” effects (e.g., Begelman 1979) or accretion-disk instabilities (e.g., Lightman & Eardley 1974).
Although we did not find a significant correlation of with either rest-frame 2500 Å luminosity or redshift using only the RQQs, the spread of for RQQs is unlikely to be explained solely by measurement errors. To demonstrate this, we have applied the likelihood method described in Section IV of Maccacaro et al. (1988) to calculate the intrinsic dispersion of (accounting for measurement errors). Ignoring upper limits, we find an intrinsic dispersion of (68% confidence errors for two interesting parameters; see Maccacaro et al. 1988). Accounting for upper limits would only increase the intrinsic dispersion (see the bottom panel of Fig. 6). For comparison, the “straight” dispersion (not accounting for measurement errors) is .
SDSS 02310728 and RD 657 have the flattest values in our sample. It is possible (see 4) that they experienced variability over the period between the optical and X-ray observations. An alternative explanation could be the presence of some dust obscuring the optical/ultraviolet radiation but not the X-ray emission. The optical spectra of these quasars, however, do not show any clear evidence supporting this scenario. Radio emission can affect the quasar broad-band spectral energy distributions producing flatter values. Although significant radio emission can be ruled out for SDSS 02310728 (see Table 3), the radio-loudness upper limit for RD 657 is not sufficiently tight to exclude some radio emission from this quasar.
SDSS 09135919, the only radio-loud object in our sample and the highest redshift RLQ with an X-ray detection, has the highest parameter ( 411) and the steepest () among the RLQs observed thus far by Chandra at (V01a; V03). X-ray absorption might be an explanation for the steep value, although the detection of five of the six source counts in the soft band (see Table 2) suggests a different interpretation. The anti-correlation between and rest-frame 2500 Å luminosity (e.g., Avni et al. 1995; VBS03) cannot explain its steep (for a RLQ) value, since SDSS 09135919 is also the optically faintest RLQ observed by Chandra to date.
4.3 Joint X-ray Spectral Fitting of SDSS Quasars at
To define the average X-ray spectral properties of high-redshift SDSS quasars and to make a comparison with those obtained for a sample of nine optically luminous PSS quasars at 4.1–4.5 (V03), we have selected a sample of 13 SDSS quasars at detected by Chandra (). Their total exposure time is 81.6 ks. The quasars in this sample are selected to have more than two counts in the full band; this choice excludes SDSS 07564502 (presented in this paper) and SDSS 12080010 (V01a). Five of the quasars used in this sample have been previously published: the three highest redshift SDSS quasars observed thus far (SDSS 10300524, SDSS 13060356, and SDSS 08360054; Brandt et al. 2002); SDSS 12040021 (Bechtold et al. 2003); and SDSS 02110009 (V01a). Eleven of the 13 quasars are radio quiet; the exceptions are SDSS 08360054 (radio moderate with 10) and SDSS 09135919 (radio loud with 411; see Table 3). In the following we present the joint X-ray spectral analysis both with and without RLQs, since RLQs often appear to be characterized by flatter X-ray photon indices (e.g., Cappi et al. 1997). The sample does not appear to be biased by the presence of a few high signal-to-noise ratio objects. For example, the removal of the radio-moderate quasar SDSS 08360054, the second brightest source in the present sample, does not provide significantly different results (see below).
Source counts were extracted from 2′′ radius circular apertures centered on the X-ray position of each quasar. The background was taken from annuli centered on the quasars, avoiding the presence of nearby X-ray sources. In total we have 120 counts (in the rest-frame 2.5–36 keV band) from the source extraction regions and five counts from the background regions normalized to the size of those used for the sources; half of the background counts are from the SDSS 09415947 field (see 2.1). All of the ARFs used in the spectral analysis have been corrected to account for the low-energy quantum efficiency decay of ACIS (see 2.1). As in 2.1, spectral analysis was carried out with xspec using the background-subtracted data and C-statistic (Cash 1979). Since C-statistic fitting is performed using the unbinned data, it retains all the spectral information and allows one to associate with each quasar its own Galactic absorption column density and redshift (for the fitting with intrinsic absorption).
Joint spectral fitting with a power-law model (leaving the normalizations free to vary) and Galactic absorption provides a good fit to the data as judged by the small data-to-model residuals and checked with 10,000 Monte-Carlo simulations. The resulting photon index is . Excluding the two non-RQQs from the joint spectral fitting gives a similar result (). These photon indices are consistent with those obtained for 0–3 samples of RQQs in the rest-frame 2–10 keV band (e.g., George et al. 2000; Mineo et al. 2000; Reeves & Turner 2000; Page et al. 2003) and the 4.1–4.5 optically luminous PSS quasars presented in V03 (). As a consistency check, we compared the photon index obtained from joint spectral fitting with that derived from band-ratio analysis (i.e., the ratio of the 2–8 keV to 0.5–2 keV counts; we have assumed for the Galactic column density the average value for the 13 quasars weighted by their number of counts). In this case we obtain .999If we increase the number of soft-band counts by 10% to take into account crudely the quantum efficiency decay of ACIS at soft energies, we obtain . The small differences in the photon indices obtained via joint spectral fitting and band-ratio analysis (with a 10% increment in the number of soft-band counts) are probably due to the fact that only the former retains all the spectral information.
We also constrained the presence of neutral intrinsic absorption; the joint-fitting technique described above provides a counts-weighted average column density. Solar abundances have been assumed, although previous optical studies indicate that high-redshift quasar nuclei are often characterized by supersolar abundances of heavy elements (e.g., Hamann & Ferland 1999; Constantin et al. 2002; Dietrich et al. 2003). Doubling the abundances in the fit gives a reduction in the column density of a factor of 2. No evidence for absorption in excess of the Galactic column density has been found, as shown by the 68, 90, and 99% confidence regions plotted in Figure 7.
![[Uncaptioned image]](/html/astro-ph/0302558/assets/x7.png)
Confidence regions for the photon index and intrinsic column density derived from joint spectral fitting of the 13 SDSS quasars (11 RQQs, two non-RQQs) at thus far detected by Chandra with more than two full-band counts (solid contours; see 4.3 for details). Dashed contours indicate the results obtained when only the 11 SDSS RQQs at are considered in the joint spectral fitting.
On average, it appears that any neutral X-ray absorption in X-ray detected SDSS quasars has a column density of cm-2 (at the 90% confidence level; cm-2 when only the RQQs are used in the spectral analysis). For comparison, X-ray absorption of (2–5) cm-2 has been detected in a few RQQs and some RLQs at 1–3 (e.g., Cappi et al. 1997; Reeves & Turner 2000). Given the limited counting statistics available for the present sample, it is not possible to obtain useful spectral constraints for more complex absorption models (e.g., ionized absorption). The typical upper limits on the equivalent widths of narrow iron K lines (either neutral or ionized) are in the range 420–950 eV.
The X-ray spectral results at presented here and in V03 allow us to place constraints on any spectral changes in the X-ray continua of RQQs as a function of redshift. In Figure 8 we plot the photon index as a function of redshift for some optically selected samples of RQQs. The photon indices plotted in the figure are for the nuclear, high-energy ( keV) component, in order to avoid spectral complexities such as soft excesses. The ASCA RQQs have been taken from Vignali et al. (1999; V99 in the key), George et al. (2000; G00), Reeves & Turner (2000; RT00), and Vignali et al. (2001b; V01b). The BeppoSAX RQQs are from Mineo et al. (2000; M00). At the highest redshifts we plot the gravitationally lensed BALQSO APM 082795255 (Chartas et al. 2002; C02), the results obtained from joint X-ray spectral fitting of nine PSS quasars in the redshift range 4.1–4.5 (V03), and the 11 SDSS RQQs at presented in this paper. The distribution of X-ray photon indices is characterized by significant scatter, so precise parametric modeling of any versus redshift relation is difficult. However, according to a Spearman’s correlation test, a correlation between and redshift is not significant (2.3). Applying a linear regression algorithm that accounts for intrinsic scatter and measurement errors (Akritas & Bershady 1996), we obtain .
![[Uncaptioned image]](/html/astro-ph/0302558/assets/x8.png)
Plot of photon index versus redshift for optically selected RQQs. The ASCA RQQs have been taken from Vignali et al. (1999; V99 in the key), George et al. (2000; G00), Reeves & Turner (2000; RT00), and Vignali et al. (2001b; V01b). The BeppoSAX RQQs are from Mineo et al. (2000; M00). At the highest redshifts we plot the gravitationally lensed BALQSO APM 082795255 (Chartas et al. 2002; C02), the results obtained from joint X-ray spectral fitting of nine PSS quasars in the redshift range 4.1–4.5 (V03), and the 11 SDSS RQQs at presented in this paper (the latter two data points are plotted at the average redshifts of the relevant papers). Error bars are at the 68% confidence level for all data points. The object with the steepest X-ray photon index in this plot, PG 1543489 (George et al. 2000), is known to be a narrow-line type 1 quasar (Boroson & Green 1992).
5 Summary
We have reported the Chandra and XMM-Newton observations of a sample of 13 quasars
at 4.7–5.4, the majority of them selected by the SDSS, and compared their properties
with those of all the quasars previously observed in the X-ray band.
The principal results are the following:
-
•
Eleven quasars have been detected in the X-ray band, doubling the number of X-ray detected quasars. The X-ray detections include SDSS 09135919, the highest redshift () RLQ thus far detected in the X-ray band. Two quasars, SDSS 03380021 and SDSS 17375828, were not detected by the present observations. The former non-detection is probably due to the short exposure time of the XMM-Newton observation after removal of flaring-background intervals. For the latter quasar, strong X-ray absorption ( cm-2 at the source redshift) is a likely explanation. An HET spectrum of this source, revealing absorption features, seems to support this hypothesis. For our sample, no evidence for source extension or an overdensity of companion objects has been found.
-
•
The presence of a significant correlation between the soft X-ray flux and magnitude has been extended to the highest redshifts. This indicates that the same engine (namely accretion onto a supermassive black hole) is powering the ultraviolet and X-ray emission.
-
•
The anti-correlation between and rest-frame 2500 Å luminosity density found for SDSS RQQs over the redshift range 0.2–6.3 (VBS03) has been confirmed (3.5–4.0 significance level) after the inclusion of the RQQs presented in this paper. Similarly to VBS03, no significant correlation between and redshift has been found. These results suggest that the mechanism driving quasar broad-band emission is similar in the local and early Universe, with no evidence for unusual phenomena in high-redshift quasar nuclei such as “trapping radius” effects or accretion-disk instabilities.
-
•
The joint 2.5–36 keV rest-frame X-ray spectrum of the 13 SDSS quasars at observed thus far by Chandra is well parameterized by a simple power-law model with and no evidence for intrinsic absorption ( cm-2 at 90% confidence).
-
•
There is no evidence for significant () optical variability over the time interval of a few years (in the observed frame) between the SDSS and HET observations.
Among the quasars presented in this paper, the only object suitable for moderate-quality ( 1000 photons) X-ray spectroscopy in a 50 ks XMM-Newton observation is SDSS 02310728. X-ray spectroscopy of the other quasars will be possible only with future missions such as Constellation-X, XEUS, and Generation-X (see V03 for some relevant simulations).
References
- (1) Akritas, M. G., & Bershady, M. A. 1996, ApJ, 470, 706
- (2) Akritas, M. G., & Siebert, J. 1996, MNRAS, 278, 919
- (3) Anderson, S. F., et al. 2001, AJ, 122, 503
- (4) Arnaud, K. A. 1996, in ASP Conf. Ser. 101, Astronomical Data Analysis Software and Systems V, ed. G. Jacoby, & J. Barnes (San Francisco: ASP), 17
- (5) Avni, Y. 1976, ApJ, 210, 642
- (6) Avni, Y., Worrall, D. M., & Morgan Jr., W. A. 1995, ApJ, 454, 673
- (7) Baldi, A., Molendi, S., Comastri, A., Fiore, F., Matt, G., & Vignali, C. 2002, ApJ, 564, 190
- (8) Barger, A. J., Cowie, L. L., Brandt, W. N., Capak, P., Garmire, G. P., Hornschemeier, A. E., Steffen, A. T., & Wehner, E. H. 2002, AJ, 124, 1839
- (9) Barkana, R., & Loeb, A. 2000, ApJ, 531, 613
- (10) Barkhouse, W. A., & Hall, P. B. 2001, AJ, 121, 2843
- (11) Bechtold, J., et al. 2003, ApJ, in press (astro-ph/0204462)
- (12) Becker, R. H., White, R. L., & Helfand, D. J. 1995, ApJ, 450, 559
- (13) Begelman, M. C. 1979, MNRAS, 187, 237
- (14) Bertin, E., & Arnouts, S. 1996, A&AS, 117, 393
- (15) Boroson, T. A., & Green, R. F. 1992, ApJS, 80, 109
- (16) Brandt, W. N., Laor, A., & Wills, B. J. 2000, ApJ, 528, 637
- (17) Brandt, W. N., Guainazzi, M., Kaspi, S., Fan, X., Schneider, D. P., Strauss, M. A., Clavel, J., & Gunn, J. E. 2001, AJ, 121, 591
- (18) Brandt, W. N., et al. 2002, ApJ, 569, L5
- (19) Brandt, W. N., et al. 2003, in New X-ray Results from Clusters of Galaxies and Black Holes, ed. C. Done, E. M. Puchnarewicz, & M. J. Ward, in press (astro-ph/0212082)
- (20) Brown, B. W. M., Hollander, M., & Korwar, R. M. 1974, in Reliability and Biometry, ed. F. Proschan, & R. J. Serfling (Philadelphia: SIAM), 327
- (21) Cappi, M., Matsuoka, M., Comastri, A., Brinkmann, W., Elvis, M., Palumbo, G. G. C., & Vignali, C. 1997, ApJ, 478, 492
- (22) Carilli, C. L., et al. 2001, ApJ, 555, 625
- (23) Castander, F. J., Treister, E., Maccarone, T. J., Coppi, P. S., Maza, J., Zepf, S. E., & Guzman, R. 2003, AJ, in press (astro-ph/0301584)
- (24) Cash, W. 1979, ApJ, 228, 939
- (25) Chartas, G., Brandt, W. N., Gallagher, S. C., & Garmire, G. P., 2002, ApJ, 579, 169 (C02)
- (26) Cobos Duenas, F. J., Tejada, C., Hill, G. J., & Perez, G. F. 1998, Proc. SPIE, 3355, 424
- (27) Comerford, J. M., Haiman, Z., & Schaye, J. 2002, ApJ, 580, 63
- (28) Condon, J. J., Cotton, W. D., Greisen, E. W., Yin, Q. F., Perley, R. A., Taylor, G. B., & Broderick, J. J. 1998, AJ, 115, 1693
- (29) Constantin, A., Shields, J. C., Hamann, F., Foltz, C. B., & Chaffee, F. H. 2002, ApJ, 565, 50
- (30) Cox, D. R. 1972, J. Roy. Stat. Soc. B, 34, 187
- (31) De Luca, A., & Molendi, S. 2002, in New Visions of the X-ray Universe in the XMM-Newton and Chandra era, in press (astro-ph/0202480)
- (32) Dempster, A. P., Laird, N. M., & Rubin, D. B. 1977, J. Roy. Stat. Soc. B, 39, 1
- (33) den Herder, J. W., et al. 2001, A&A, 365, L7
- (34) Dickey, J. M., & Lockman, F. J. 1990, ARA&A, 28, 215
- (35) Dietrich, M., Appenzeller, I., Hamann, F., Heidt, J., Jäger, K., Vestergaard, M., & Wagner, S. J. 2003, A&A, 398, 891
- (36) Djorgovski, S. G., Gal, R. R., Odewahn, S. C., de Carvalho, R. R., Brunner, R., Longo, G., & Scaramella, R. 1998, in Wide Field Surveys in Cosmology, ed. S. Colombi, & Y. Mellier (Paris: Editions Frontieres), 89
- (37) Djorgovski, S. G., Stern, D., Mahabal, A. A., & Brunner, R. 2003, ApJ, submitted
- (38) Ebeling, H., White, D. A., & Rangarajan, F. V. N. 2003, MNRAS, submitted
- (39) Fan, X., et al. 1999, AJ, 118, 1
- (40) Fan, X., et al. 2000, AJ, 120, 1167
- (41) Fan, X., et al. 2001, AJ, 121, 31
- (42) Fan, X., Narayanan, V. K., Strauss, M. A., White, R. L., Becker, R. H., Pentericci, L., & Rix, H. 2002, AJ, 123, 1247
- (43) Fan, X., et al. 2003, AJ, in press (astro-ph/0301135)
- (44) Freeman, P. E., Kashyap, V., Rosner, R., & Lamb, D. Q. 2002, ApJS, 138, 185
- (45) Gallagher, S. C., Brandt, W. N., Laor, A., Elvis, M., Mathur, S., Wills, B. J., & Iyomoto, N. 2001, ApJ, 546, 795
- (46) Gallagher, S. C., Brandt, W. N., Chartas, G., & Garmire, G. P. 2002, ApJ, 567, 37
- (47) Garmire, G. P., Bautz, M. W., Ford, P. G., Nousek, J. A., & Ricker, G. R. 2003, Proc. SPIE, 4851, in press
- (48) Gehrels, N. 1986, ApJ, 303, 336
- (49) George, I. M., Turner, T. J., Yaqoob, T., Netzer, H., Laor, A., Mushotzky, R. F., Nandra, K., & Takahashi, T. 2000, ApJ, 531, 52 (G00)
- (50) Goodrich, R. W., et al. 2001, ApJ, 561, L23
- (51) Green, P. J., Aldcroft, T. L., Mathur, S., Wilkes, B. J., & Elvis, M. 2001, ApJ, 558, 109
- (52) Hamann, F., & Ferland, G. 1999, ARA&A, 37, 487
- (53) Hasinger, G., Burg, R., Giacconi, R., Schmidt, M., Trumper, J., & Zamorani, G. 1998, A&A, 329, 482
- (54) Hill, G. J., Nicklas, H. E., MacQueen, P. J., Mitsch, W., Wellem, W., Altmann, W., Wesley, G. L., & Ray, F. B. 1998a, Proc. SPIE, 3355, 433
- (55) Hill, G. J., Nicklas, H. E., MacQueen, P. J., Tejada, C., Cobos Duenas, F. J., & Mitsch, W. 1998b, Proc. SPIE, 3355, 375
- (56) Hu, E. M., Cowie, L. L., McMahon, R. G., Capak, P., Iwamuro, F., Kneib, J.-P., Maihara, T., & Motohara, K. 2002, ApJ, 568, L75
- (57) Irwin, M., McMahon, R. G., & Hazard, C. 1991, in ASP Conf. Ser. 21, The space distribution of quasars, ed. D. Crampton (San Francisco: ASP), 117
- (58) Isaak, K. G., Priddey, R. S., McMahon, R. G., Omont, A., Peroux, C., Sharp, R. G., & Withington S. 2002, MNRAS, 329, 149
- (59) Kaspi, S., Brandt, W. N., & Schneider, D. P. 2000, AJ, 119, 2031 (KBS00)
- (60) Kauffmann, G., & Haehnelt, M. 2000, MNRAS, 311, 576
- (61) Kellermann, K. I., Sramek, R., Schmidt, M., Shaffer, D. B., & Green, R. F. 1989, AJ, 98, 1195
- (62) Kraft, R. P., Burrows, D. N., & Nousek, J. A. 1991, ApJ, 374, 344
- (63) Laor, A., & Brandt, W. N. 2002, ApJ, 569, 641
- (64) LaValley, M., Isobe, T., & Feigelson, E. D. 1992, in ASP Conf. Ser. 25, Astronomical Data Analysis Software and Systems, ed. D. M. Worrall, C. Biemesderfer, & J. Barnes (San Francisco: ASP), 245
- (65) Lightman, A. P., & Eardley, D. M. 1974, ApJ, 187, L1
- (66) Loeb, A., & Barkana, R. 2001, ARA&A, 39, 19
- (67) Lyons, L. 1991, Data Analysis for Physical Science Students, (Cambridge: Cambridge University Press)
- (68) Maccacaro, T., Gioia, I. M., Wolter, A., Zamorani, G., & Stocke, J. T. 1988, ApJ, 326, 680
- (69) Maiolino, R., Mannucci, F., Baffa, C., Gennari, S., & Oliva, E. 2001, A&A, 372, L5
- (70) Manners, J., Almaini, O., & Lawrence, A. 2002, MNRAS, 330, 390
- (71) McMahon, R. G., Priddey, S. R., Omont, A., Snellen, I., & Withington, S. 1999, MNRAS, 309, L1
- (72) Metcalfe, L. 2002, XMM-Newton Users Group Meeting Presentations
- (73) Mineo, T., et al. 2000, A&A, 359, 471 (M00)
- (74) Mukai, K. 2002, pimms Users’ Guide (Greenbelt: NASA/GSFC)
- (75) Omont, A., Cox, P., Bertoldi, F., McMahon, R. G., Carilli, C., & Isaak, K. G. 2001, A&A, 374, 371
- (76) Page, K. L., Turner, M. J. L., Reeves, J. N., O’Brien, P. T., & Sembay, S. 2003, MNRAS, in press (astro-ph/0210140)
- (77) Pentericci, L., et al. 2003, AJ, submitted
- (78) Peroux, C., Storrie-Lombardi, L. J., McMahon, R. G.; Irwin, M., & Hook, I. M. 2001, AJ, 121, 1799
- (79) Ramsey, L. W., et al. 1998, Proc. SPIE, 3352, 34
- (80) Rees, M. J. 1999, in After the Dark Ages: When Galaxies were Young (the Universe at ), ed. S. Holt, & E. Smith (New York: American Institute of Physics), 13
- (81) Reeves, J. N., & Turner, M. J. L. 2000, MNRAS, 316, 234 (RT00)
- (82) Schmidt, M., & Green, R. F. 1983, ApJ, 269, 352
- (83) Schmidt, M., van Gorkom, J. G., Schneider, D. P., & Gunn, J. E. 1995, AJ, 109, 473
- (84) Schneider, D. P., Schmidt, M., & Gunn, J. E. 1989, AJ, 98, 1951
- (85) Schneider, D. P., Schmidt, M., & Gunn, J. E. 1991, AJ, 101, 2004
- (86) Schneider, D. P., Schmidt, M., Hasinger, G., Lehmann, I., Gunn, J. E., Giacconi, R., Trümper, J., & Zamorani, G. 1998, AJ, 115, 1230
- (87) Schneider, D. P., et al. 2001, AJ, 121, 1232
- (88) Schneider, D. P., et al. 2002, AJ, 123, 567
- (89) Schwartz, D. A. 2002, ApJ, 571, L71
- (90) Silverman, J. D., et al. 2002, ApJ, 569, L1
- (91) Stern, D., Djorgovski, S. G., Perley, R. A., de Carvalho, R. R., & Wall, J. V. 2000, AJ, 119, 1526
- (92) Storrie-Lombardi, L. J., Irwin, M. J., McMahon, R. G., & Hook, I. M. 2001, MNRAS, 322, 933
- (93) Strüder, L., et al. 2001, A&A, 365, L18
- (94) Telis, G. A., Petric, A., Paerels, F., & Helfand, D. J. 2003, ApJ, submitted
- (95) Turner, M. J. L., et al. 2001, A&A, 365, L27
- (96) Turner, M. S. 2002, ApJ, 576, L101
- (97) Vanden Berk, D. E., et al. 2001, AJ, 122, 549
- (98) Vignali, C., Comastri, A., Cappi, M., Palumbo, G. G. C., Matsuoka, M., & Kubo, H. 1999, ApJ, 516, 582 (V99)
- (99) Vignali, C., Brandt, W. N., Fan, X., Gunn, J. E., Kaspi, S., Schneider, D. P., & Strauss, M. A. 2001a, AJ, 122, 2143 (V01a)
- (100) Vignali, C., Comastri, A., Cappi, M., Palumbo, G. G. C., & Matsuoka, M. 2001b, in AIP Conf. Proc. 599, X–ray astronomy: Stellar Endpoints, AGN, and the X-ray background, ed. N. White, G. Malaguti, & G. Palumbo (New York: New York: American Institute of Physics), 999 (V01b)
- (101) Vignali, C., Bauer, F. E., Alexander, D. M., Brandt, W. N., Hornschemeier, A. E., Schneider, D. P., & Garmire, G. P. 2002, ApJ, 580, L105 (V02)
- (102) Vignali, C., Brandt, W. N., & Schneider, D. P. 2003, AJ, 125, 433 (VBS03)
- (103) Vignali, C., Brandt, W. N., Schneider, D. P., Garmire, G. P., & Kaspi, S. 2003, AJ, 125, 418 (V03)
- (104) Waddington, I., Windhorst, R. A., Cohen, S. H., Partridge, R. B., Spinrad, H., & Stern, D. 1999, ApJ, 526, L77
- (105) York, D. G., Yanny, B., Crotts, A., Carilli, C., Garrison, E., & Matheson, L. 1991, MNRAS, 250, 24
- (106) York, D. G., et al. 2000, AJ, 120, 1579
- (107) Wyithe, S., & Loeb, A. 2002, Nature, 417, 923
- (108) Zheng, W., et al. 2000, AJ, 120, 1607
Here we report the updated X-ray flux values (and derived quantities) for quasars observed by Chandra in the past. The X-ray values have been corrected for the ACIS quantum energy decay at low energies.
| Object | aaRest-frame 2500 Å luminosity density (erg s-1 Hz-1). | bbRest-frame 2 keV luminosity density (erg s-1 Hz-1). | |||||||||
|---|---|---|---|---|---|---|---|---|---|---|---|
| PSS 00590003 | 4.16 | 19.3 | 1.06 | 31.54 | 27.62 | 10.2 | 7.88 | 27.41 | 45.30 | 1.59 | |
| BR 01030032 | 4.43 | 18.7 | 1.85 | 31.82 | 28.33 | 20.1 | 16.28 | 27.77 | 45.66 | 1.56 | 2.9 |
| PSS 01210347 | 4.13 | 18.5 | 2.22 | 31.86 | 28.41 | 41.3 | 31.65 | 28.01 | 45.90 | 1.48 | 300.3 |
| PSS 01330400 | 4.15 | 18.2 | 2.93 | 31.98 | 28.72 | 20.8 | 16.01 | 27.72 | 45.61 | 1.64 | |
| PSS 01343307 | 4.53 | 18.5 | 2.22 | 31.92 | 28.57 | 11.5 | 9.45 | 27.55 | 45.44 | 1.68 | |
| PSS 02090517 | 4.14 | 17.8 | 4.24 | 32.14 | 29.12 | 15.2 | 11.66 | 27.58 | 45.47 | 1.75 | |
| SDSS 02100018 | 4.77 | 19.3 | 1.06 | 31.63 | 27.85 | 37.3 | 32.12 | 28.11 | 46.00 | 1.35 | 86.1 |
| SDSS 02110009 | 4.90 | 20.0 | 0.56 | 31.37 | 27.20 | 3.8 | 3.36 | 27.15 | 45.04 | 1.62 | |
| BR 02410146 | 4.06 | 18.4 | 2.44 | 31.88 | 28.48 | 4.3 | 3.26 | 27.01 | 44.84 | 1.87 | |
| PSS 02481802 | 4.43 | 18.1 | 3.21 | 32.06 | 28.93 | 21.2 | 17.16 | 27.79 | 45.68 | 1.64 | |
| BR 03081734 | 4.00 | 18.1 | 3.21 | 31.99 | 28.76 | 4.1 | 3.06 | 26.97 | 44.86 | 1.93 | |
| BR 04011711 | 4.23 | 18.9 | 1.54 | 31.71 | 28.05 | 12.9 | 10.07 | 27.53 | 45.42 | 1.61 | |
| SDSS 08360054 | 5.82 | 18.8 | 1.67 | 31.96 | 28.67 | 12.3 | 12.50 | 27.83 | 45.73 | 1.58 | 9.8 |
| PSS 09263055 | 4.19 | 16.7 | 11.67 | 32.59 | 30.24 | 33.5 | 25.94 | 27.93 | 45.82 | 1.79 | |
| PSS 09555940 | 4.34 | 18.4 | 2.44 | 31.93 | 28.60 | 6.0 | 4.79 | 27.22 | 45.12 | 1.81 | |
| PSS 09573308 | 4.20 | 18.2 | 2.93 | 31.99 | 28.74 | 11.3 | 8.78 | 27.46 | 45.36 | 1.74 | |
| SDSS 10300524 | 6.28 | 19.7 | 0.76 | 31.67 | 27.94 | 2.5 | 2.73 | 27.22 | 45.12 | 1.71 | |
| BR 10330327 | 4.51 | 18.8 | 1.69 | 31.80 | 28.26 | 8.4 | 6.87 | 27.41 | 45.30 | 1.69 | |
| PSS 10574555 | 4.12 | 17.6 | 5.09 | 32.22 | 29.31 | 25.3 | 19.34 | 27.80 | 45.68 | 1.70 | 2.3 |
| SDSS 11290142 | 4.85 | 19.2 | 1.17 | 31.68 | 27.98 | ||||||
| SDSS 12040021 | 5.03 | 19.1 | 1.28 | 31.75 | 28.14 | 4.6 | 4.13 | 27.26 | 45.15 | 1.72 | |
| SDSS 12080010 | 5.27 | 20.5 | 0.35 | 31.22 | 26.82 | 1.3 | 1.24 | 26.77 | 44.66 | 1.71 | |
| PC 12473406 | 4.90 | 19.2 | 1.17 | 31.69 | 28.00 | 11.0 | 9.66 | 27.61 | 45.50 | 1.57 | |
| SDSS 13060356 | 5.99 | 19.6 | 0.85 | 31.68 | 27.97 | 5.7 | 5.94 | 27.53 | 45.42 | 1.59 | |
| PSS 13173531 | 4.36 | 18.9 | 1.54 | 31.73 | 28.10 | 3.6 | 2.91 | 27.01 | 44.90 | 1.81 | |
| PSS 13260743 | 4.09 | 17.2 | 7.36 | 32.37 | 29.70 | 29.4 | 22.32 | 27.85 | 45.74 | 1.73 | |
| PSS 13474956 | 4.51 | 17.4 | 6.12 | 32.36 | 29.66 | 17.5 | 14.35 | 27.73 | 45.62 | 1.78 | 0.1 |
| PSS 14353057 | 4.35 | 19.1 | 1.28 | 31.65 | 27.90 | ||||||
| PSS 14432724 | 4.42 | 19.0 | 1.40 | 31.70 | 28.03 | 11.3 | 9.10 | 27.51 | 45.41 | 1.61 | |
| PSS 14435856 | 4.26 | 17.7 | 4.64 | 32.20 | 29.26 | 4.7 | 3.66 | 27.09 | 44.99 | 1.96 | |
| SDSS 15320039 | 4.62 | 19.4 | 0.97 | 31.57 | 27.70 | ||||||
| SDSS 16050112 | 4.92 | 19.4 | 0.97 | 31.61 | 27.80 | ||||||
| BR 22121626 | 4.00 | 18.6 | 2.03 | 31.79 | 28.25 | 13.4 | 9.95 | 27.48 | 45.38 | 1.65 |
Note. — Units are the same as in Table 3.