The Optical and Near-Infrared Properties of Galaxies: I. Luminosity and Stellar Mass Functions
Abstract
We use a large sample of galaxies from the Two Micron All Sky Survey (2MASS) and the Sloan Digital Sky Survey (SDSS) to calculate galaxy luminosity and stellar mass functions in the local Universe. We estimate corrections for passband shifting and galaxy evolution, as well as present-day stellar mass-to-light (M/L) ratios, by fitting the optical–near-infrared galaxy data with simple models. Accounting for the 8% galaxy overdensity in the SDSS early data release region, the optical and near-infrared luminosity functions we construct for this sample agree with most recent literature optical and near-infrared determinations within the uncertainties. We argue that 2MASS is biased against low surface brightness galaxies, and use SDSS plus our knowledge of stellar populations to estimate the ‘true’ -band luminosity function. This has a steeper faint end slope and a slightly higher overall luminosity density than the direct estimate. Furthermore, assuming a universally-applicable stellar initial mass function (IMF), we find good agreement between the stellar mass function we derive from the 2MASS/SDSS data and that derived by Cole et al. (2001; MNRAS, 326, 255). The faint end slope slope for the stellar mass function is steeper than , reflecting the low stellar M/L ratios characteristic of low-mass galaxies. We estimate an upper limit to the stellar mass density in the local Universe by assuming an IMF as rich in low-mass stars as allowed by observations of galaxy dynamics in the local Universe. The stellar mass density may be lower than this value if a different IMF with fewer low-mass stars is assumed. Finally, we examine type-dependence in the optical and near-infrared luminosity functions and the stellar mass function. In agreement with previous work, we find that the characteristic luminosity or mass of early-type galaxies is larger than for later types, and the faint end slope is steeper for later types than for earlier types. Accounting for typing uncertainties, we estimate that at least half, and perhaps as much as 3/4, of the stellar mass in the Universe is in early-type galaxies.
As an aid to workers in the field, we present in an appendix the relationship between model stellar M/L ratios and colors in SDSS/2MASS passbands, an updated discussion of near-infrared stellar M/L ratio estimates, and the volume-corrected distribution of and -band stellar M/L ratios as a function of stellar mass.
1 Introduction
The distribution of galaxy luminosities and stellar masses in the present-day Universe is of fundamental importance for studying the assembly of galaxies over cosmic time, both observationally and theoretically (e.g., Lilly et al., 1995; Lin et al., 1999; Cole et al., 2000; Brinchmann & Ellis, 2000; Somerville, Primack, & Faber, 2001; Wolf et al., 2003). In addition to providing the zero redshift baseline for luminosity function (LF) evolution, the local LF constrains powerfully much of the important physics affecting the assembly of baryons in dark matter halos. For example, gas accretion and cooling dominates the bright end of the LF, whereas feedback and photoionization affect primarily fainter galaxies (e.g., Cole et al., 2000; Benson et al., 2002). Near-infrared (NIR) luminosities of galaxies are particularly useful as the mass-to-light (M/L) ratios in the NIR vary only by a factor of two or less across a wide range of star formation (SF) histories (Bell & de Jong, 2001, see also the Appendix), contrasting with a factor of ten change in M/L ratio at the blue end of the optical regime. Therefore, NIR luminosities provide a cleaner estimate of galaxy stellar masses, which are more robustly predicted by the theoretical models (e.g., Gardner et al., 1997; Cole et al., 2001; Kochanek et al., 2001). The goal of this paper is to use the NIR Two Micron All Sky Survey (2MASS; Skrutskie et al., 1997) in conjunction with optical data and redshifts from the Sloan Digital Sky Survey (SDSS; York et al., 2000) to explore the distribution of galaxy luminosities in the optical and NIR, and to use these data to estimate the distribution of stellar masses in the local Universe.
There have been a number of recent studies that have estimated LFs and mass functions (MFs), based on a number of recent large surveys. Around the knee of the LF, which represents the dominant contribution to the overall luminosity density, the agreement between the LFs from different surveys is good. In the optical, luminosity densities agree at typically the 20% level or better, accounting for differences in filter bandpasses and median redshift (e.g., Norberg et al., 2002; Liske et al., 2003; Blanton et al., 2003c). A similar conclusion is found for the NIR -band (e.g., Gardner et al., 1997; Cole et al., 2001; Kochanek et al., 2001). There are some indications that the behavior of the difficult-to-measure fainter galaxies may depend on environment (Tully et al., 2002), although these galaxies do not exist in sufficient numbers to contribute significantly to the luminosity density of the local Universe (e.g., Zabludoff & Mulchaey, 2000; Trentham & Tully, 2002).
Three notable exceptions to this concordance of recent LF measurements are the Las Campanas Redshift Survey (LCRS; Lin et al., 1996), the early SDSS LF from Blanton et al. (2001), and the -band LF estimate of Huang et al. (2003). The LCRS estimates are relatively consistent with more recent estimates of the optical LFs (e.g., Blanton et al., 2003c), but because of two offsetting effects: (i) the neglect of evolution, which biases the luminosity density to higher values; and (ii) the use of isophotal magnitudes, which biases the luminosity density back down to lower values (Blanton et al., 2001, 2003c). Blanton et al. (2001) find 50% more luminosity density in the local Universe than more recent SDSS or Two Degree Field Galaxy Redshift Survey (2dFGRS; Colless et al., 2001) estimates. This offset is due mostly to the neglect of galaxy evolution and partially to the use of crude -corrections (Blanton et al., 2003c). The difference between the -band LF of Huang et al. (2003) and other local estimates is less well-understood, but could stem from the neglect of evolution corrections, LF fitting uncertainties and/or large-scale structure (their LF estimate comes from an area of sky 50 times smaller than the area studied in this work; we discuss this issue in more detail in §4.2).
Furthermore, it is unclear if the optical and NIR LFs are mutually consistent. Cole et al. (2001) compared the optical -band LF from Blanton et al. (2001) with their hybrid -band LF, finding poor agreement. Wright (2001) finds over a factor of two offset between extrapolations from the optical LFs of Blanton et al. (2001) and 2MASS-derived -band LFs (Cole et al., 2001; Kochanek et al., 2001). Given the above argument that luminosity densities in the optical and NIR are basically known to within 20%, it is unclear whether this discrepancy can be simply accounted for by the neglect of evolution corrections by Blanton et al. (2001), or whether, for example, this is an indication of gross global incompleteness in -band LFs. Furthermore, the landmark stellar MFs derived by Cole et al. (2001) have not been, as yet, tested systematically.
In this paper, the first in a series of papers focusing on the optical and NIR properties of galaxies in the local Universe, we use the NIR 2MASS in conjunction with optical data and redshifts from SDSS to explore in detail the LFs of galaxies over a factor of 6 in wavelength from the -band (0.35µm) to the -band (2.15µm). We then, following the methodology of Bell & de Jong (2000, 2001), use the constraints on the optical-NIR spectral energy distributions (SEDs) in conjunction with state-of-the-art stellar population synthesis (SPS) models to investigate in detail the stellar MF of galaxies over a factor of 1000 in stellar mass, assuming a universally-applicable stellar initial mass function (IMF). We used these stellar mass estimates in conjunction with a statistically-estimated cold gas masses (Hi and H2) to construct the cold baryonic MF in the local Universe and the efficiency of galaxy formation (Bell et al., 2003a, see also, e.g., Salucci & Persic 1999). In subsequent papers we will examine, e.g., the -band size distribution of galaxies, the photometric properties of a -selected sample, the dust contents and SF histories of disk galaxies, and the -band LF of bulges and disks separately, amongst other goals.
This paper is arranged as follows. In §2, we discuss the data, focusing on the most important sources of error and incompleteness. In §3, we discuss our method for deriving -corrections, evolution corrections and stellar M/L ratios. In §4, we construct and discuss optical and NIR LFs for our sample of galaxies. We construct stellar MFs in §5 and discuss these further in §6. We summarize in §7. In the Appendix, we present the distribution of color-derived stellar M/L ratio estimates as a function of galaxy mass and fits to the color-M/L ratio correlations in the SDSS/2MASS passbands as aids to workers in the field. We assume , , and km s-1 Mpc-1. For estimating evolution corrections, we assume . Sections 2, 3, and the Appendix go into considerable detail regarding the uncertainties and stellar M/L ratios; thus, readers interested mainly in the results should read §2.1 and then skip directly to §4.
2 The Data, Data Quality, and Selection Effects
2.1 Overview
We use the SDSS Early Data Release (EDR; Stoughton et al., 2002) to provide a nearly complete sample of 22679 galaxies over 414 square degrees with accurate fluxes and magnitudes. We match these SDSS spectroscopic sample galaxies with the 2MASS extended source catalog (XSC; Jarrett et al., 2000) and point source catalog (PSC)111http://www.ipac.caltech.edu/2mass/releases/second/doc/ancillary/pscformat.html. To match the catalogs, we choose the closest galaxy within 2″as the best match (for reference, the random and systematic positional uncertainties of 2MASS and SDSS are 200 and 50 milliarcseconds, respectively; Pier et al., 2003). In this way, we have a reasonably complete sample of galaxies with redshifts, 12085 of which have a match in the 2MASS XSC (and therefore have fluxes, half-light radii and concentrations in and -bands), 6629 of which have a match in the 2MASS PSC (and therefore have fluxes, and half-light radii and concentration parameters in -band), and 3965 of which have no match in either 2MASS catalog (and thus have the optical data only). We choose to use only the 2MASS -band at the present time.
A complete description of these catalogs is far beyond the scope of this paper (see e.g., Jarrett et al., 2000; Blanton et al., 2001; Cole et al., 2001; Stoughton et al., 2002, for more details). Here, we discuss the most important aspects for our purposes: the accuracy of the magnitudes, concentrations and surface brightnesses, and the completeness of the catalogs.
2.2 Magnitude Accuracy


An important focus of this paper is the discussion of the offset between optical and 2MASS -band LFs (e.g., Wright, 2001). Because the NIR luminosity density seemed a factor of two below expectations, one of the principal concerns was a large shortfall in either the magnitudes or numbers of galaxies in 2MASS. In this section, we discuss the accuracy of the 2MASS -band magnitudes in detail, and briefly summarize the expected accuracy of magnitudes in the other passbands.
In many respects, -band data from 2MASS is the ideal tool for constraining galaxy LFs and the stellar MF. 222We note that, strictly speaking, 2MASS adopts a -band that peaks at rather shorter wavelengths than the standard -band, but we we will call it -band for brevity in this paper. -band galaxy luminosities are five to ten times less sensitive to dust and stellar population effects than optical luminosities, allowing an accurate census of stellar mass in the local Universe (e.g., Bell & de Jong, 2001). Furthermore, 2MASS covers the entire sky homogeneously, with 1% systematic variations in zero point (Nikolaev et al., 2000). However, in the NIR the sky background is roughly a factor of 100 times brighter than the mean surface brightness of luminous galaxies, and the exposure time of 2MASS is short (7.8 seconds with a 1.3-m telescope; Skrutskie et al., 1997). Thus, low surface brightness (LSB) features, such as LSB galaxies or the outer regions of normal galaxies, may be missed by 2MASS.
To test how much light 2MASS misses in the LSB outer parts of galaxies, we compare 2MASS -band magnitudes from the XSC with -band magnitudes from deeper imaging data. Following Cole et al. (2001), we show Loveday’s -band Kron333Kron (1980) magnitudes are measured in apertures that are related to the galaxy radius (for 2MASS, not less than 5″). magnitude from relatively deep data (10 minutes on the Cerro Tololo International Observatory 1.5-m telescope) against 2MASS -band Kron magnitudes (Fig. 1). At , 2MASS Kron magnitudes seem quite accurate, with a systematic offset of 0.010.04 mag. At fainter magnitudes, 2MASS Kron magnitudes underestimate the true magnitude by 0.100.02 mag (scatter 0.2 mag). Cole et al. (2001) found a larger offset between Second Incremental Data Release 2MASS -band and total magnitudes; since the Second Incremental Data Release there have been improvements to the reduction pipeline that have improved the quality of 2MASS -band Kron magnitudes.
We check this offset by comparison with a larger sample of galaxies imaged in the -band by Gavazzi et al. (1996a, b, 2000) and Boselli et al. (2000)444This sample was used to test the circular isophotal magnitudes used by Kochanek et al. (2001) for their -band derived LF.. We adopt the 2MASS color to estimate the total -band magnitude; the typical value is , almost independent of galaxy type. The average offset brighter (fainter) than mag is 0.06 (0.17) mag, in the sense that Gavazzi’s magnitudes are slightly brighter than the 2MASS Kron magnitudes (see Fig. 2). We do not adopt this correction in this paper owing to uncertainties in transforming -band data into -band. We do, nevertheless, choose to adopt an offset of 0.1 mag for all galaxies (not just galaxies with ) to better match Gavazzi’s offset. We note that magnitudes corrected in this way will be within 0.1 mag of total, independent of whether one compares them to Gavazzi’s or Loveday’s total magnitudes. We adopt a 0.1 mag uncertainty in the correction to total -band fluxes, added in quadrature with the 2MASS random magnitude error. We tested whether the correction to total is a function of -band surface brightness, as one could imagine that the fraction of light lost may be larger for lower surface brightness galaxies. We found no correlation between the correction to total flux and -band surface brightness within the errors, supporting our use of a blanket 0.1 mag offset.
We also choose to match to the 2MASS PSC. There are very few matches to the comparison samples: 8 from Loveday (2000) and 8 from the sample from Gavazzi and coworkers. We find mean offsets of mag (0.3 mag RMS) and mag (0.3 mag RMS) for the two samples. We disregard two outliers (with no offset and a mag offset) from the eight of the Gavazzi sample. We account for the large PSC offsets by subtracting 0.85 mag from the 2MASS PSC -band magnitudes, and setting their -band errors to 0.5 mag. These magnitudes are clearly of very limited use. We use them primarily to constrain only roughly the -correction, evolution correction, and stellar M/L ratio estimates. In particular, our choice of -band magnitude limit (extinction-corrected -band Kron magnitude of 13.57, with the offset included after galaxy selection) includes only 66 galaxies from the PSC, or just over 1% of our -band selected sample.
Because of its high signal-to-noise, SDSS Petrosian555SDSS Petrosian magnitudes are estimated within an aperture that is twice the radius at which the local surface brightness is 1/5 of the mean surface brightness within that radius (Strauss et al., 2002). magnitudes are expected to be accurate to better than 0.05 mag in a random and systematic sense (Strauss et al., 2002; Blanton et al., 2003c). Sloan papers typically make the distinction between preliminary magnitudes presented by the EDR in the natural Sloan 2.5-m telescope system, denoted , and the ‘true’ Sloan magnitudes . We denote the EDR Petrosian magnitudes for brevity. Petrosian magnitudes of well-resolved early-type galaxies (with close to law luminosity profiles) underestimate the total flux by 0.1 mag because their surface brightness profiles fall off very slowly at large radii (Strauss et al., 2002; Blanton et al., 2003c). In this paper, we crudely correct for this effect by subtracting 0.1 mag from the magnitude of any galaxy with an -band concentration parameter of (defined in the next section). While simplistic, it allows us to estimate the total fluxes for early-type galaxies to within 0.05 mag. We adopt a magnitude error of 0.05 mag for all galaxies, added in quadrature to the (tiny) internal SDSS random magnitude errors. Note that we apply all magnitude offsets after galaxy selection.
2.3 Concentration Parameters and Surface Brightnesses
In this paper, we study primarily the overall luminosities and stellar masses of galaxies, choosing not to focus on their structural parameters, such as concentration parameter or surface brightness. Nevertheless, we do use concentration parameter as a crude discriminant between early and late-type galaxies and surface brightnesses when examining the completeness of the galaxy samples.
We adopt as our primary morphological classifier the -band concentration parameter, , where and are the circular aperture radii within which 90% and 50% of the Petrosian flux are contained, respectively. The concentration parameter has been extensively used within the SDSS collaboration to separate between early and late-type galaxies in a rudimentary fashion; early-type galaxies have higher than later types. This is motivated by the work of Strateva et al. (2001) and Shimasaku et al. (2001), who find a scattered but reasonable correlation between qualitative morphological classifications and . Strateva et al. (2001) suggest a selection for early-type galaxies and this cut has been adopted by Kauffmann et al. (2003a). We also adopt this criterion, primarily because it is easily reproducible, facilitating easy comparison with our results by other workers. Blanton et al. (2003b) note the sensitivity of the the concentration parameter to seeing; more heavily smoothed early-type galaxies appear less concentrated than they would be either if they were observed with better seeing or were closer. Because of this, the early type definition is conservative; intrinsically smaller or more distant early types maybe misclassified as later types owing to seeing effects.

2MASS also gives a concentration parameter , where and are the elliptical aperture within which 75% and 25% of the flux are contained. In Fig. 3, we compare the SDSS to the 2MASS in an effort to explore systematic uncertainties in the use of concentration parameters as a morphological typing tool (we compare to color selection later also in §4.4). We restrict our comparison to galaxies, which have sufficient S/N to estimate . It is clear that there are systematic differences between the two definitions, which are manifested by zero point shifts, a non-unity slope, and a substantial scatter. Nevertheless, making the crude approximation that (the solid line), we can compare the fractions classified as early-type with both definitions. Using , we find that 401/603 EDR galaxies are classified as early-type. Using , we find that 439/603 galaxies are classified as early-type. Furthermore, 355/401 galaxies (89%7%) of -band classified early-types are classified as early type using the -band classification.
We use , , and -band surface brightnesses only as a rough check on the completeness properties of the 2MASS-matched sample and on the -band LF. These surface brightnesses are defined to be the average surface brightness within the half-light radii. Since the magnitudes for SDSS and 2MASS XSC are accurate to at worst 20%, we expect that the half-light surface brightnesses will be accurate to %, given the 20% error in total magnitude, added in quadrature with the effect of a 20% scale size error, which is typical of scale-size comparisons between different authors (see, e.g., Bell & de Jong, 2000). Accuracies of this order are more than sufficient for our present purposes.
2.4 Completeness
The homogeneity and completeness of SDSS and 2MASS make them powerful tools for understanding the characteristics of galaxies in the local Universe. To construct meaningful LFs from these datasets, we must understand the completeness characteristics of each survey. We choose SDSS EDR spectroscopic sample galaxies with Galactic foreground extinction-corrected (Schlegel, Finkbeiner, & Davis, 1998), following Stoughton et al. (2002). This galaxy sample is nearly complete, as discussed in much more detail by e.g. Blanton et al. (2001), Stoughton et al. (2002) or Strauss et al. (2002). We find that the area covered by the SDSS spectroscopic sample is 414 square degrees, 90% of the 462 square degrees covered by the EDR imaging data (Stoughton et al., 2002). This is quite consistent with the the statement by Stoughton et al. (2002) that only 93% of the spectroscopic tiles were attempted; we adopt the 3% difference as our systematic error in determining the sky coverage of this sample. We estimate a total completeness within this area by querying SDSS EDR photometric catalog galaxies satisfying the spectroscopic catalog inclusion criteria as outlined by Strauss et al. (2002). This value is 78%, which is consistent with a 2% loss of galaxies due to bright stars, a % redshift success rate, and between 80% and 90% targeting efficiency (e.g., Blanton et al., 2001; Stoughton et al., 2002). A value of 85% was recently found by Nakamura et al. (2003) for bright SDSS galaxies () in the EDR: we adopt the difference between our and Nakamura et al.’s measurements as the systematic error in the completeness, which is propagated through into the and estimates later. We do not take account of the detailed, position-dependent completeness of the sample. While a detailed accounting for the completeness as a function of position is pivotal for estimating galaxy clustering properties, it is of only minor importance for estimating the overall LF. Finally, we note that there is little systematic bias within SDSS against galaxies within the selection limits. Of order 0.1% of the lowest surface brightness galaxies are not targeted because a spectrum would be impossible to obtain, and because over 3/4 of the lowest surface brightness features in the SDSS imaging survey are artifacts (Strauss et al., 2002). Also, % of bright galaxies are rejected because they overlap a bright, saturated star, or because they have a very bright fiber magnitude and are not targeted to avoid severe cross-talk between the fiber spectra. Neither of these biases will significantly affect our analysis.
In addition to estimating the completeness of SDSS internally, we determine whether the SDSS EDR area is overdense using the full coverage of 2MASS. We estimate overdensities by comparing the number of 2MASS extended sources with in the sky outside of the Galactic Plane () with the number of similar sources in the SDSS EDR region. We use an area that is slightly less than the 414 square degrees that we calculate for the spectroscopic EDR coverage because we choose rectangular areas that are fully enclosed by the SDSS EDR boundaries. We show in Fig. 4 that the EDR is overdense over the entire magnitude range . We include the estimated density in the 2dFGRS region for comparison and give the number counts for each region in Table 1. The SDSS EDR is 8% overdense (with a 1% Poisson uncertainty), and the 2dFGRS region (used by Cole et al., 2001) is 2% underdense, compared to the whole sky. Although this estimate is admittedly rough because galaxies are a somewhat different set of galaxies than those with , the overdensity estimate is accurate given that we compare to half of the entire sky (). Furthermore, our estimate is insensitive to Galactic foreground extinction. We account for the EDR region overdensity in our analysis by multiplying the effective survey area by 1.08 when constructing our LFs.
| Region | Area (deg2) | ||
|---|---|---|---|
| XSC | 363803 | 20630 | 17.63 |
| 2dFGRS | 32568 | 1887 | 17.26 |
| Sloan EDR | 7078 | 369.6 | 19.15 |


We focus our study on the 2MASS matches to the SDSS catalog. As stated earlier, out of the 22679 galaxies in the EDR spectroscopic sample, we match 12085 galaxies in the 2MASS XSC and 6629 galaxies in the 2MASS PSC. In Fig. 5, we explore the properties of the 2MASS matched and unmatched galaxies in more detail. In the upper panels, we show the distribution of galaxy color (left) and -band surface brightness (right). The solid histograms show galaxies with 2MASS counterparts, the dashed histograms show those without. We give the -band surface brightness (left) and apparent magnitude (right) in the lower panels. We estimate and for galaxies that have no 2MASS data using the SDSS and -band apparent magnitude in conjunction with the color of the best-fit SED model (as described in §3). We test this procedure by using the optical data only to predict the -band magnitudes of the 12085 galaxies with -band XSC data. We find that this procedure is accurate to 0.4 mag RMS. We see that the galaxies that are unmatched in 2MASS are preferentially blue and LSB in the optical and NIR. There are 84 LSB galaxies ( mag arcsec-2) with estimated , thus, there may be a small population of LSB galaxies missed by 2MASS. Faint, LSB galaxies are visible only in the very nearest parts of an apparent magnitude-limited survey (such as 2MASS), and therefore carry a large weight . Therefore, this small bias (%) may translate into a larger bias when considering the LF or luminosity density. This bias would affect all published 2MASS LFs (e.g., Cole et al., 2001; Kochanek et al., 2001), as well as our own. We show later that this bias affects the faint end of the LF, as one would expect given the surface brightness dependence of the LF (see, e.g., de Jong & Lacey, 2000; Cross & Driver, 2002). We also estimate the degree of incompleteness using the optical data in conjunction with our knowledge of stellar populations to push the -band LF and stellar MF down to lower galaxy masses.
We select samples for estimating LFs in different passbands using passband-dependent magnitude limits, following Blanton et al. (2003c). Specifically, when constructing LFs, we select the magnitude limit in so that the for each galaxy is constrained by the limit for 98% of the sample, and is defined by the limit for the other 2% of the galaxies. Functionally, these limits are 18.50, 17.74, 16.94, 16.59, and 13.57.
3 Methodology: -Corrections, Evolution Corrections, and Stellar M/L ratios
3.1 The Method
To estimate LFs and stellar MFs using the redshift and data for the SDSS EDR galaxies, we must estimate -corrections and stellar M/L ratios. Furthermore, Blanton et al. (2003c) and Norberg et al. (2002) stress the need to include the effects of galaxy evolution. We estimate -corrections, evolution corrections, and galaxy stellar M/L ratios by comparing the galaxy fluxes with state-of-the art stellar population synthesis (SPS) models.
For each galaxy, we construct a grid of stellar populations with a range of metallicities and star formation histories (SFHs) at both the real galaxy redshift and at redshift zero. We use the Pégase model (see Fioc & Rocca-Volmerange, 1997, for a description of an earlier version of the model), choosing ten galaxy metallicities from 0.5% to 250% solar. The SFHs vary exponentially with time : where is the star formation rate (SFR), is the exponential -folding time of the SFR, and is the age of the galaxy (the time since SF commenced). The term in the square brackets is simply a normalization to keep the total mass of stars formed by the present day at one solar mass. We choose a grid of 29 values between 0 (single burst) and (continuous), continuing through to and then to Gyr (strongly increasing to the present day). Our grid covers color space relatively uniformly.
This grid is produced at both redshift zero and at the real galaxy redshift. The galaxy age is 12 Gyr for the redshift zero model, and is younger for the non-zero redshift model assuming (in essence, we choose a formation redshift of ). For example, this gives an age of 10.7 Gyr for a galaxy at . We least-squares fit the model galaxies at the real galaxy redshift to the observed galaxy colors to choose the best model galaxy template. We then estimate the evolution correction, -correction, and present-day stellar M/L ratio by comparing the non-zero redshift model with the evolved redshift zero model. Thus, in essence, we correct for evolution by assuming that the SFH indicated by the colors of the galaxy at the observed redshift continues smoothly to the present day.
To estimate stellar masses, we adopt the model galaxy M/L ratios in each passband, assuming solar absolute magnitudes of (6.41, 5.15, 4.67, 4.56, 4.53, 3.32) in respectively, estimated using the Pégase SPS model. Those wishing to convert our luminosity densities into physical units or SDSS or 2MASS-calibrated absolute magnitudes per cubic Mpc can easily use the above solar absolute magnitudes for conversion without loss of accuracy. We estimate uncertainties in -corrections, evolutionary corrections, and stellar M/L ratio values via three methods: (i) omitting one passband at a time from the SED fit (the jackknife method; 6 fits); (ii) uniformly weighting all data points in the fit for each galaxy (1 fit); and (iii) adding random magnitude offsets with sizes corresponding to the magnitude error to all the galaxy photometry and re-doing the fits (5 times). We then compute the errors from the RMS difference between these 12 different fits to the SED and our original SED fit. Typical -correction and evolution correction random errors derived in this way for the -band selected sample are (0.06, 0.03, 0.03, 0.03, 0.03, 0.02) mag in respectively. Typical random errors in stellar M/L ratio are (0.08, 0.06, 0.05, 0.04, 0.04, 0.05) dex, again in .
We adopt a ‘diet’ Salpeter (1955) stellar IMF (following Bell & de Jong, 2001) that has the same colors and luminosity as a normal Salpeter IMF, but with only 70% of the mass due to a lower number of faint low-mass stars. This yields stellar M/L ratios 30% lower at a given color than a Salpeter IMF. Bell & de Jong (2001) show that this IMF is ‘maximum disk’, inasmuch as IMFs richer in low-mass stars over-predict the rotation velocity of Ursa Major Cluster galaxies with -band photometry and well-resolved Hi rotation curves. This prescription thus gives the maximum possible stellar M/L ratio. Naturally, a different choice of IMF allows lower M/L ratios. For example, the popular Kennicutt (1983) or Kroupa, Tout & Gilmore (1993) IMFs have roughly 30% lower M/L ratios than this IMF, and are thus ‘submaximal’. We discuss this issue in more detail in §6.1.
3.2 Comparison with Other Constraints

Our -corrections and evolution corrections are quite robust. -band -corrections are insensitive to galaxy spectral type. In particular, we find , which is in good agreement with from Glazebrook et al. (1995). We test the optical -corrections by comparing with a simple power-law interpolation, including the effects of bandpass widening. Blanton et al. (2003a) find that this approximation is good to around 0.1 mag in all passbands, but better in as the spectral shapes are simpler there. We find also that our optical and NIR -corrections are consistent with the simple power-law recipe to within 0.1 mag in all passbands. These offsets decrease to 0.05 mag in . This agreement is more than adequate, bearing in mind our 0.05–0.1 mag -correction errors. We quantify our evolution corrections by comparing the mean evolution correction with the mean -correction for our -band selected galaxy sample. The mean evolution corrections are in , in the sense that galaxies are fainter at the present day, owing mostly to passive evolution. This can be compared to the values derived by Blanton et al. (2003c), who estimate the evolution by fitting for it explicitly in their LF estimation. They find an evolution of in . Therefore, we find satisfactory agreement between our color-based evolutionary corrections and direct estimates from the LF evolution by Blanton et al. (2003c), except perhaps in the -band, where the photometric and -correction uncertainties are largest, and our assumption of smoothly-varying SFHs could easily prove inadequate. Independently, Bernardi et al. (2003a) find evolution of in for early-type galaxies using a similar (but totally independent) technique to Blanton et al. (2003c), again within mag of our corrections over the redshift interval of interest.
Bell & de Jong (2001) demonstrate that for galaxies with relatively smooth SFHs, stellar M/L ratio and optical color should correlate quite tightly. We present a test of our stellar M/L ratio estimates in Fig. 6. Using an independent method that accounts for bursts of SF based on the strengths of the 4000Å break and the H line, Kauffmann et al. (2003a) construct stellar M/L ratios for over 120,000 SDSS galaxies. In Fig. 19 of that paper, they compare their M/L ratios in -band with the color, estimated at , and find a strong correlation. To compare to the Kauffmann et al. (2003a) correlation we estimate a color correction , assuming a power-law -correction. Moreover, we account for the IMF difference; our ‘diet’ Salpeter IMF is 0.15 dex heavier at a given color, because of its larger number of low-mass stars, than the Kennicutt IMF that Kauffmann et al. (2003a) adopt. To within 20% random scatter our multi-color method gives results consistent with their spectral method (comparing the points with the solid line in Fig. 6). This is particularly impressive given the very different methodologies and the different stellar population models used666Lee, McCall & Richer (2003) show a comparison of their color-derived two-population -band stellar M/L ratio estimates (Lee et al., 2003) with optical color in the Appendix to that paper. They find excellent agreement with color-derived stellar M/L ratios from Bell & de Jong (2001), showing again that different methodologies yield consistent estimates of stellar M/L ratio..
With the low scatter in the versus M/Lg ratio correlation it is possible to predict stellar mass to within 20% using - and -band data alone, compared to the maximum-likelihood SED fits of up to 6 optical/NIR passbands. Kauffmann et al. (2003a) find a scatter closer to 50%; this is likely due to the different methods adopted to derive stellar M/L ratios by our group and Kauffmann et al. (2003a). Kauffmann et al. (2003a) use 3″ aperture spectra, plus an color that is emission-line sensitive for dust estimation. Thus, they are sensitive to the aperture mismatch between the spectra and colors, and model mismatches between color and spectral features. In contrast, we minimize the residuals explicitly between our galaxy model colors and the observed colors; therefore, we explicitly minimize the spread in the color–M/L ratio correlation with our method. Either way, it is clear that we can use SDSS color data alone, plus a redshift, to estimate the stellar mass of galaxies to between 20% and 50%, relative to the answer that one obtains using -band data or spectra. In particular, this allows us to use the SDSS data to ‘fill in’ areas of parameter space not covered as completely by 2MASS, such as blue LSB galaxies.
We can independently check these M/L ratios using recent results from Bernardi et al. (2003b). They construct estimates of total M/L ratio (including the potentially non-negligible contribution of dark matter) using kinematic constraints, by multiplying the half-light radius by the velocity dispersion squared, and then dividing by half the luminosity. Assuming the Hubble Space Telescope Key Project distance scale (Freedman et al., 2001), they then compare these M/L ratios with color, finding a strong correlation (the lower right-hand panel of their Fig. 5). Correcting for their application of a 0.08 mag bluewards offset in color, we estimate their . Over the range of interest (), this is within 25% at the blue end and 5% of the red end of our maximum-disk tuned stellar population model expectation (see the Appendix for details): . Furthermore, their total scatter (including contributions from observational error) is dex, or 40% in terms of M/L ratio, in agreement with our earlier estimate of 20% to 50%. The agreement between these two totally independent methodologies, each with their own sources of systematic and random error, is astonishing; both predict roughly a factor of five change in stellar M/L ratio from the blue to the red end of the galaxy population, and both have the same absolute stellar M/L ratio scale. This agreement is another, powerful argument in favor of a color-based stellar M/L ratio of the type discussed in the Appendix, or by Bell & de Jong (2001).
3.3 Systematic uncertainties
The above prescription for estimating -corrections, evolution corrections, and stellar M/L ratios assumes that the colors of a stellar population are driven by star formation history (SFH) and metallicity alone. What are the systematic uncertainties introduced by neglecting the effects of dust and more complex SFHs? Our -corrections are robust, inasmuch as we simply use a physically-motivated model to interpolate between the observations (a simple power-law interpolation suffices also to roughly 0.1 mag). Furthermore, our evolutionary corrections agree with independent estimates, and since they are a relatively small correction ( mag typically), small errors in the evolutionary correction will not substantially affect our results.
However, there may be a significant uncertainty in stellar M/L ratio estimates that is not accounted for by our prescription. Overall galaxy age (i.e. the time since SF started) can change the stellar M/L ratio at a given color in a systematic sense by a small but non-negligible amount, e.g. dex for an age difference of Gyr. Furthermore, it is not a priori clear what effects dust may have on the stellar M/L ratios. Bell & de Jong (2001) show that, to first order, the effects of dust cancel out to within 0.1–0.2 dex when estimating color-derived stellar M/L ratios. This cancellation occurs because the stellar populations and dust each predict roughly the same amount of reddening per unit fading in most passbands. However, the random uncertainties of this technique are only 20% in terms of M/L ratio (see above earlier in §3), so the second order difference between the effects of dust and stellar populations could be significant.
We explore the possible effects of dust on our results in a simple way, following Tully et al. (1998). Tully et al. (1998) estimate the luminosity-dependent dust content of disk galaxies by minimizing the scatter in the color-magnitude relation (CMR) in passbands. They find that luminous galaxies suffer from a 1.7 (0.3) mag dimming in their -band (-band) flux when going from face-on to nearly edge-on, while faint galaxies show very little evidence for dust. We adopt a rough dimming of (1.6, 1.3, 0.3) mag from face-on to edge-on () in passbands for massive disk galaxies (masses and ). We allow this dimming to decrease linearly with logarithmic mass to zero for stellar masses below . We assume a simple slab model, with an optical depth at arbitrary inclination of , where is the optical depth at edge-on derived from the above quoted difference between edge-on and face-on. Concentrated, i.e. early-type, galaxies are assigned a factor of 3 less dust. We assume a random distribution of orientations.
In Fig. 6, we show schematically the effect of the average (short arrow) and maximum possible (long arrow) dust contents, according to our admittedly ad hoc description. The arrows show the bluing of color and reduction of M/L ratio when dust is taken into account. It is clear that the effects of dust and stellar population are mostly degenerate in agreement with Bell & de Jong (2001). Nevertheless, there is a slight systematic difference between the two effects. For this dust prescription, we overestimate the average stellar M/L ratio in -band by 0.06 dex when we fit dust-reddened colors with pure stellar populations.
Another source of systematic uncertainty is from bursts of SF. Bell & de Jong (2001) find that large bursts of SF can cause an over-estimate of the true M/L ratio of the stellar population, if the stellar population is interpreted in terms of smoothly varying SFHs. We attempt to constrain the magnitude of this error for our purposes using a simple model. We choose two solar metallicity stellar populations, one with a decreasing SFR to the present day ( Gyr), and one with constant SF ( Gyr). We then apply random variations in SFR over timescales of 108 yr, distributed in a log-normal fashion with a dispersion of a dex, i.e. the SFR can easily change by more than an order of magnitude from its baseline rate. We then examine the offset from the color and M/Lg ratio correlation of these bursty models, compared to smooth SFH models. For both SF models we find that SF bursts generate a % scatter about the color–M/L ratio relation, and a % offset to slightly lower M/L ratio at a given color. A full order of magnitude variation in SFH over 108 yr timescales is likely to be an upper limit for all but the strongest present-day star-bursting galaxies; therefore, we demonstrate that the bias we impose by assuming such simplistic SFHs is %.
To summarize, the random uncertainties of color-based stellar M/L ratio estimation are %. Systematic uncertainties from galaxy age, dust, and bursts of SF are dex, or %. These systematic uncertainties will not cancel out with larger galaxy samples, and will dominate, along with stellar IMF, the error budget of the stellar mass density of the Universe.
4 Luminosity Functions
| Quantity | Error | Source | Ref. |
|---|---|---|---|
| (1) | (2) | (3) | (4) |
| Luminosity Function | |||
| 10% | Uncertainty in exact sky coverage (3%), completeness (7%), Poisson error in normalization | §2.4, §4.1 | |
| (1%), and differences between behavior of the sample and our EDR sample | |||
| 5% | Uncertainty in absolute calibration of system | (1) | |
| 10% | only: Extrapolation to total | §2.2 | |
| 0.1? | Optical: from departures from a Schechter function | §4.3 | |
| NIR: from strong departures from a Schechter function, and LSB galaxy incompleteness | §2.4, §4.2 | ||
| 15% | Optical: from and uncertainty | above | |
| NIR: from , and uncertainty | above & §4.2 | ||
| Stellar Mass Function | |||
| & | 30% | Dust, bursts of SF, galaxy age, and absolute calibration uncertainty | above & §3.3 |
| Stellar IMF | §6.1 | ||
| Band | Ref. | |||||||||
|---|---|---|---|---|---|---|---|---|---|---|
| (1) | (2) | (3) | (4) | (5) | (6) | (7) | (8) | (9) | (10) | |
| 18.50 | 5347 | 0.5320.004 | 0.055 | 0.0238(8) | 18.13(3) | 0.95(3) | 1.51 | 1.45 | a | |
| 17.74 | 11848 | 0.5090.003 | 0.070 | 0.0172(5) | 19.73(3) | 1.03(3) | 1.57 | 1.47 | a | |
| 17.50 | 22679 | 0.5090.002 | 0.096 | 0.0137(7) | 20.57(3) | 1.07(3) | 1.80 | 1.69 | a | |
| 16.94 | 17984 | 0.5080.002 | 0.093 | 0.0118(4) | 21.00(3) | 1.11(3) | 2.14 | 2.19 | a | |
| 16.59 | 15958 | 0.5200.002 | 0.092 | 0.0119(4) | 21.34(2) | 1.06(2) | 2.75 | 3.22 | a | |
| 13.57 | 6282 | 0.520 0.004 | 0.078 | 0.0143(7) | 23.29(5) | 0.77(4) | 5.9,7 | b,c |
4.1 LF estimation
We estimate LFs using the simple and intuitive formalism of, e.g., Felten (1977). This method has the disadvantage that it is somewhat sensitive to galaxy density variations. For example, if the near part of the survey is rather overdense, where a magnitude-limited survey is most sensitive to low-luminosity galaxies, then the estimator will yield a somewhat larger number of low-luminosity galaxies than it should. Both the Step-Wise Maximum Likelihood (SWML) method of Efstathiou et al. (1988) and the parametric method of Sandage et al. (1979) are insensitive to density fluctuations of this type (although both methods are sensitive to density fluctuations when calculating the overall LF normalization). Nevertheless, both the SWML and parametric method make the assumption that the shape of the LF is independent of environment, yet there is impressive evidence against this assumption, at least in the optical (De Propris et al., 2003; Hütsi et al., 2003). In contrast, the method does not make this assumption. Furthermore, it does not make any a priori assumptions regarding the form of the LF, unlike Sandage et al. (1979) parametric method. Therefore, we use the method and note, that among others, Cole et al. (2001) find with a similar dataset that LFs derived using and SWML are identical within the errors.
For an unbiased estimate of , we estimate the maximum distance that a galaxy of a given absolute magnitude would be visible, accounting for Galactic foreground extinction and - and evolution-corrections, not including the early-type and -band-to-total corrections. Due to slight inaccuracies in the - and evolution corrections, we find a few galaxies with distances that are larger by a few observational sigma than expected, which gives a few galaxies with . Not including these galaxies does not affect any of the results in this paper. Our formal error estimates include Poisson, Monte-Carlo magnitude, evolution, -correction, and bootstrap uncertainties, plus random stellar M/L ratio errors for the MFs. There are also systematic sources of error: e.g., the % systematic uncertainty from dust and bursts of SF, and the % systematic uncertainty in absolute magnitude calibration (see, e.g., Fukugita et al., 1996). We have to first order avoided uncertainties from galaxy clustering because we have renormalized the luminosity functions to account for the EDR’s 8% overdensity (§2.4). However, we neither sample all of the EDR region, nor can we securely extrapolate to different galaxy populations (e.g., the population as opposed to the population), so we attach a 10% percent systematic uncertainty to the normalization and luminosity density to account for clustering. We summarize the systematic error budget in Table 2.
We calculate LFs using pseudo--limited samples (where 98% of the galaxies are limited in the passband of interest, and only 2% of the galaxies are limited by their -band flux). We present our results in Table 3 and include some relevant comparisons from the literature. We discuss two sets of LFs in more detail in this paper: a joint and -band selected sample, and a joint and -band selected sample such that only 2% of galaxies are -band limited, and 98% are limited by the magnitude limit in the other passband. We do not calculate the LF or stellar MF for magnitude bins with less than 5 galaxies.
4.2 The -band limited sample
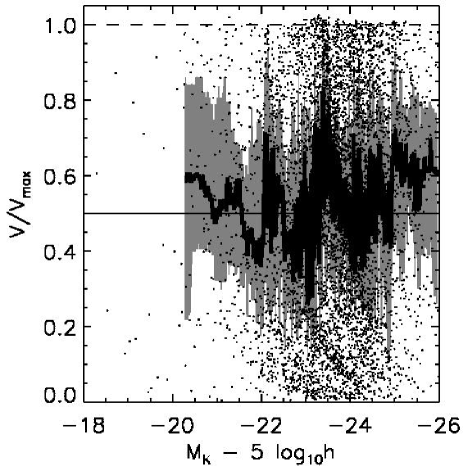
In Fig. 7, we plot versus -band absolute magnitude. In an unbiased sample, an average value of is expected, as galaxies uniformly fill the volume. For our sample, the average value is . Excluding the 66/6282 (1%) of galaxies with gives . This indicates a slight tendency for galaxies to be in the more distant half of the sample, perhaps reflecting uncertainty in the evolution correction or small amounts of large-scale structure. Nevertheless, any bias in the sample is weak; for example, Cole et al. (2001) find for their sample of 2MASS/2dFGRS galaxies, yet obtain excellent agreement between and SWML estimates of the LF.
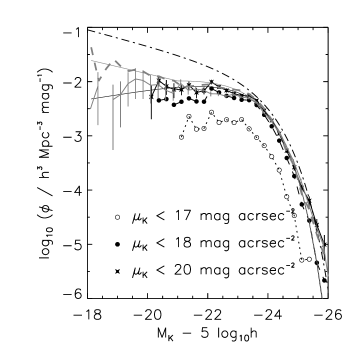
We plot the LFs derived using the -band limited sample in Figs. 8 and 9. In Fig. 8, we show the -band LF for samples using different -band surface brightness cuts. All galaxies in our sample (solid line) have mag arcsec-2. We fit the Schechter (1976) function to the data points:
| (1) |
where is the LF normalization, is the characteristic luminosity at the ‘knee’ of the LF where the form changes from exponential to power law, and is the ‘faint end slope’. In common with other work (e.g., de Jong & Lacey, 2000; Cross & Driver, 2002), we find that a fainter surface brightness limit increases somewhat and substantially affects . The -band luminosity density for our galaxy sample is 5.77 Mpc-3 (formal error only). As discussed in Table 2, we estimate a % systematic uncertainty from our extrapolation to total flux, absolute magnitude calibration, and sky coverage uncertainty. Thus, our raw estimate of -band luminosity density is 5.8 Mpc-3, including the sources of random and systematic error.
Earlier, we expressed concern regarding incompleteness in 2MASS for LSB galaxies. It is interesting to use the full SDSS2MASS dataset to estimate what the -band LF should look like, in the absence of selection bias. We use the -band selected galaxy sample to construct a -band LF using 9307 real -band magnitudes and 2541 synthesized -band magnitudes (estimated to mag accuracy using as a constraint). This is denoted in Fig. 8 as a thick grey dashed line. The agreement is excellent at the bright end; nevertheless, the faint end slope of the predicted -band LF is substantially steeper. A Schechter function is a poor fit to this LF owing to the ‘kink’ at , thus we fit a power law to the faint end between , which has a slope of . This bias against faint, LSB galaxies affects all 2MASS-derived estimates of not just the faint end slope, but also the total -band luminosity density. Using this rough hybrid Schechterpower law, which has brightwards of and continues with power law slope faintwards of this limit (the solid grey line in Fig. 8), we estimate that the total -band luminosity density may be as high as 7.6 Mpc-3. Thus, we see that 2MASS’s bias against LSB galaxies may bias the faint end slope downwards, and the luminosity density estimates downwards by 25%. This conclusion is qualitatively and quantitatively consistent with a more direct assessment of light missed by 2MASS’s relatively shallow exposures by Andreon (2002) 777There is another argument that suggests that 2MASS misses LSB galaxies. The luminosity-density weighted color (AB-Vega) of the galaxy population is 2.750.05 (when either or -band luminosity weighted), and is dominated by luminous, galaxies. SDSS should not miss large numbers of LSB galaxies, therefore we can use the -band luminosity density (which should be quite complete) plus the luminosity density-weighted color (which reflects the behavior of galaxies) to estimate the -band luminosity density. This estimate is , somewhat higher than the uncorrected value of . The virtue of this -based estimate is that the faint end slope is determined by the well-constrained -band LF, whereas in the direct approach we are forced to estimate the faint end slope from the -band data directly. .
How do our luminosity functions and luminosity density estimates of 5.8 Mpc-3 compare with the literature? In Fig. 8 (solid grey line) we compare with the LF estimate of Cole et al. (2001) and find excellent agreement in both the shape of the LF and the overall normalization. Cole et al. (2001) find 5.9 Mpc-3 but do not account for the bias against LSB galaxies inherent in the 2MASS data. We compare our LF with Kochanek et al. (2001) in Fig. 9 (shown as a solid grey line), finding that their LF is well within our error bars.888They also do not account for 2MASS’s bias against LSB galaxies but still find a relatively steep faint end slope to the LF, making it hard to estimate the effect of the LSB bias in their case. They find a somewhat steeper faint end slope than we do, leading them to a slightly high luminosity density of Mpc-3. Therefore, accounting for all of the sources of error, it is clear that we are consistent with both Cole et al. (2001) and Kochanek et al. (2001). Our determination has the advantage, however, that we have considerably reduced the large-scale structure uncertainty by renormalizing our LF to the whole sky, and that we understand in detail 2MASS’s bias against LSB galaxies. It will indeed be interesting to see if large, deep -band surveys will converge towards the steeper faint end slope predicted by our analysis.
In this context, comparison to the rather deeper survey of Huang et al. (2003) is particularly interesting. They have a sample of galaxies over an area of sky 50 times smaller than our area, and are unable to normalize their luminosity function to the whole sky. Thus, their luminosity function is highly susceptible to the effects of large-scale structure. We disagree with their luminosity function (see Fig. 8) and total luminosity density of Mpc-3. We attribute much of this mismatch to large-scale structure. Two other effects may also contribute. First, the knee of their LF is mag brighter than ours, which is likely caused by the uncorrected galaxy evolution in their sample. Given a median redshift of , a mag offset is needed to correct for this evolution. Furthermore, ignoring even modest evolution can cause faint end slope over-estimation with the maximum-likelihood SWML and STY methods (Blanton et al., 2003c). Second, a Schechter fit poorly represents their dataset; an improved fit would have a sharper knee and a shallower faint-end slope, giving a substantially lower luminosity density (see Fig. 2 of Huang et al., 2003). However, it is intriguing that with deeper data they find a steep faint end slope, roughly parallel with our predicted -band LF. We predict that further work will show that Huang et al. (2003) indeed found roughly the right faint end slope, but that they were adversely affected by large-scale structure and a small offset from ignoring evolution corrections.
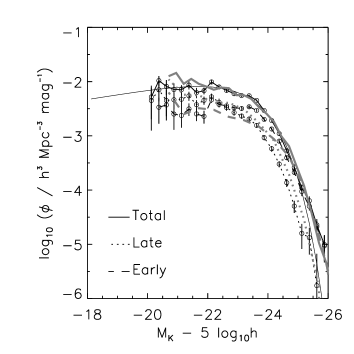
In Fig. 9, we show the LF split crudely by morphological type using the SDSS -band concentration parameter (§2.3). Recall that Strateva et al. (2001) and Hogg et al. (2002) show that most concentrated galaxies are early-type (earlier than Sa), although could be affected by seeing (see Blanton et al., 2003b, and §2.3). We recover the classic result that the LF for early types has a flat or decreasing faint end slope and has a brighter than late types, which have a somewhat steeper LF (e.g., Bromley et al., 1998; Blanton et al., 2001). Our type-split LFs agree qualitatively with Kochanek et al. (2001), who find a larger for early types, although their overall LF is slightly offset from ours. We explore the role of morphological selection in §4.4.
4.3 The -band limited sample
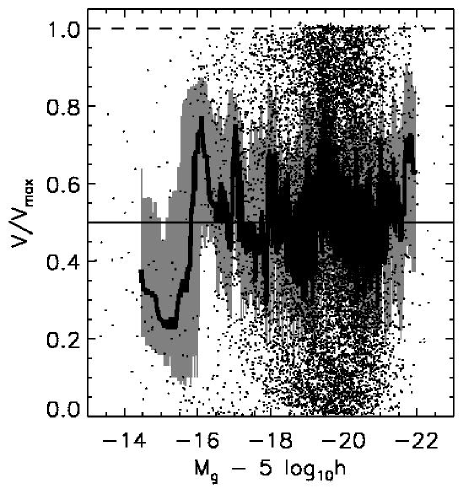


One strength of our combined SDSS and 2MASS sample is that we can construct LFs in the optical passbands to accompany our NIR -band LF. In this section, we derive a -band limited LF. The Schechter fits for other passbands are given in Table 3 for reference, and are discussed further in §4.5. Analogous to the -band limited sample, we show the distribution of galaxy with absolute -band magnitude (Fig. 10), the -band LF derived using different surface brightness limits (Fig. 11), and the -band LF split by morphological type (Fig. 12).
The -band limited sample has , which is slightly higher (by ) than the purely random distribution expectation of 0.5. Nevertheless, as with the sample, this departure is small and should not affect our results at more than the few percent level.999We note that there is substantial structure in the distribution at . This structure is likely caused by large scale structure, owing to the small characteristic of galaxies with faint absolute magnitudes in apparent magnitude-limited samples. Furthermore, this structure is the probable origin of the fluctuations in the -band LF at in Figs. 11 and 12. In Fig. 11, our -band LF (solid line) compares well with that of Blanton et al. (2003c), shown as the dash-dotted line. Furthermore, our -band luminosity density (see Table 3) is % larger than Blanton et al.’s value. Blanton et al. did not include light lost from the low surface brightness wings of early-type galaxies in their luminosity density estimate, however. When we account for the differences in technique by either neglecting the correction in our own analysis (resulting in a reduction of our luminosity density estimate by 4%) or by comparing to Blanton et al.’s estimated correction (making Blanton et al.’s estimate 3% higher), the agreement between our estimate and Blanton et al.’s is well within the expected uncertainties. It is worth noting that, similar to the -band LF, the inclusion of lower surface brightness galaxies in -band increases slightly and gives a steeper .
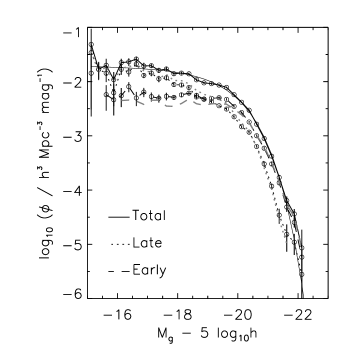
In Fig. 12, we show the -band LF split into early and late morphological types using . We find that the LF for early-types has a brighter and a flatter faint end slope than the later types, in agreement with many other studies of the local Universe (e.g., Bromley et al., 1998; Blanton et al., 2001). We find a flat faint-end slope for the early-type LF, which disagrees with the almost log-normal distribution seen for some local Universe early-type samples (e.g., Blanton et al., 2001; Wolf et al., 2003). Some of this discrepancy is almost certainly caused by a different sample selection. For example, a cut at a relatively red constant color will produce a log-normal LF because of the exclusion of faint, genuinely old early-type galaxies that are too blue to satisfy the color cut owing to their low metallicity (e.g., Bower, Lucey, & Ellis, 1992). In the next section, we show that the early-type LF selected from a magnitude-dependent color cut, which accounts for the CMR, is also relatively flat (see also Bell et al., 2003b).
4.4 Color-selection of early and late types


We explore the role of morphological selection further by using the broad-band colors of galaxies. We show the CMR of all -band selected galaxies in the left-hand panel of Fig. 13. Here, one can clearly see the ‘bimodality’ of the color distribution of galaxies (e.g. Strateva et al., 2001; Blanton et al., 2003b; Hogg et al., 2003; Bell et al., 2003b). The galaxies separate into coarse blue and red ‘sequences’. The blue sequence has redder colors at brighter magnitudes, reflecting the older ages, higher metallicities, and greater dust content in brighter, more massive late-type galaxies (e.g., Tully et al., 1998; Bell & de Jong, 2000). The red sequence is also redder at brighter magnitudes, reflecting a metallicity-magnitude relation for older stellar populations (e.g., Bower, Lucey, & Ellis, 1992; Kodama & Arimoto, 1997). The red sequence of galaxies from the field environment is known to contain predominantly early-type galaxies (Schweizer & Seitzer, 1992; Hogg et al., 2003). Thus, choosing galaxies along the red sequence is an excellent alternative method for selecting early-type galaxies.
In Fig. 13, the CMR of early-type galaxies has been marked using a solid line with a slope of . This slope is transformed from the CMR slope in local galaxy clusters (Bower, Lucey, & Ellis, 1992; Kodama & Arimoto, 1997) of in color using the Pégase stellar population synthesis models. This is in good agreement with the slope of to derived by Bernardi et al. (2003c). We define early-type galaxies as having colors redder than mag from CMR ridge line, i.e., everything above the dotted line in Fig. 13, which corresponds to mag following Bell et al. (2003b).
We compare our color-magnitude based definition with the subsample of early-type galaxies in the right-hand panel of Fig. 13. Clearly the majority of concentrated galaxies have colors that are indicative of old stellar populations. Fully 84% of concentrated galaxies have colors that are redder than our color cut. Furthermore, the fraction of concentrated galaxies satisfying the color cut increases towards brighter absolute magnitude, meaning that the overwhelming majority of the luminosity density in concentrated galaxies will be from galaxies on the CMR. Conversely, 70% of the color-selected early-types have , although concentration has limitations as a morphological-classifier (§2.3).
We show the -band LF of early and late-types defined using our color cut in Fig. 14. Although the color selection gives a larger number of early-type systems, the overall differences between early and late-type LFs are similar to those we find using concentration to divide our galaxy sample morphologically (§4.3). Thus, the basic result that late-types have fainter and steeper faint-end slopes than early-types is robust to different type definitions (see also Kochanek et al., 2001).
4.5 Comparing luminosity density estimates of the local Universe
In Table 3, we see that the luminosity densities we find for the passbands agree well with the densities of Blanton et al. (2003c). They compare their LFs and luminosity densities in detail with various other local Universe determinations, finding agreement to within 10% (whether or not one corrects for the extrapolation of early-type galaxy magnitudes to total in SDSS). In the -band, we find a % lower luminosity density than Blanton et al. (2003c). We agree well with Blanton et al.’s estimate at of Mpc-3; therefore, the origin of the -band discrepancy at is likely an unphysically large density evolution in their analysis. Additionally, our K-band luminosity density agrees with those of Cole et al. (2001) and Kochanek et al. (2001). They have also compared their LFs with literature determinations and find typically excellent agreement.
Wright (2001) claims an overall discrepancy between the optical LF determinations of Blanton et al. (2001) and the NIR LFs of Cole et al. (2001) or Kochanek et al. (2001), finding a factor of more luminosity density in the optical than in the NIR. Indeed, Huang et al. (2003) claim that they ‘solve’ this problem by declaring that the the local -band luminosity density is a factor of two higher. However, Blanton et al. (2003c) show that the luminosity density estimates of Blanton et al. (2001) were systematically too high by % (more in the bluer passbands). We investigate this issue through a luminosity density comparison using our galaxy sample in different passbands.

We show the luminosity density of galaxies in the local Universe in Fig. 15. The formal uncertainties are added in quadrature to a density and magnitude systematic uncertainty of 10% for the optical data, and 15% for the -band point (because of the additional 10% error in extrapolating to total; Table 2). The solid symbols show the results of our analysis, and the open symbols a variety of literature determinations of luminosity density, including the -band determination of Huang et al. (2003), which we have argued is artificially high. Overplotted are three stellar population models for 12 Gyr old stellar populations of solar metallicity, formed with exponentially-decreasing SFRs with -folding times of 2 Gyr (dotted line), 4 Gyr (solid line) and 8 Gyr (dashed line). All of the models are constrained to have the same stellar mass density as we derive in §5. Clearly our data reproduce many of the luminosity density determinations in the local Universe between and -bands, but with the dual advantages that we use one consistent dataset to determine the luminosity density in all passbands, and that we understand sources of bias in 2MASS better than previous work owing to the multi-passband coverage offered by SDSS and 2MASS. Furthermore, the shape of the cosmic mean spectrum is broadly consistent with a relatively metal-rich galaxy with a SFH peaked at early times and decreasing to a present day non-zero rate. This is in excellent agreement with the work of Baldry et al. (2002) and Glazebrook et al. (2003).
Fig. 15 illustrates that we have a good understanding of the luminosity density of the local Universe. Thus, it is worth spending a few words on why there has been such confusion surrounding its determination. Blanton et al. (2001) presented luminosity densities around a factor of two higher than the new, revised SDSS estimates; this discrepancy is caused primarily by evolution correction uncertainties (Blanton et al., 2003c). These high estimates are at variance with earlier luminosity density determinations at optical (see, e.g., Fig. 1 of Wright, 2001) and NIR wavelengths (e.g., Gardner et al., 1997; Kochanek et al., 2001). We now see that when evolution, -corrections, and systematic bias are properly and carefully accounted for (as in this work, or Blanton et al., 2003c), the luminosity density of the local Universe between 3500Å and 2.2µm is understood to within at a given wavelength.
5 Stellar Mass Functions

| Passband | ||||
|---|---|---|---|---|
| Mpc | Mpc-3 | |||
| All Galaxies | ||||
| 0.0102(5) | 10.70(2) | 1.10(2) | 5.47(11) | |
| 0.0133(6) | 10.63(1) | 0.86(4) | 5.26(12) | |
| Early-Type Galaxies | ||||
| 0.0083(4) | 10.62(2) | 0.60(4) | 3.08(6) | |
| 0.0107(8) | 10.60(4) | 0.70(7) | 3.84(9) | |
| 0.0089(4) | 10.61(2) | 0.52(7) | 3.19(8) | |
| Late-Type Galaxies | ||||
| 0.0059(3) | 10.51(2) | 1.27(3) | 2.40(4) | |
| 0.0027(2) | 10.59(3) | 1.45(3) | 1.70(4) | |
| 0.0071(6) | 10.48(3) | 0.94(8) | 2.10(9) | |
| Total | Early () | Late () | Early (color) | Late (color) | |
|---|---|---|---|---|---|
| 8.56 | |||||
| 8.69 | |||||
| 8.81 | |||||
| 8.94 | |||||
| 9.06 | |||||
| 9.19 | |||||
| 9.31 | |||||
| 9.44 | |||||
| 9.56 | |||||
| 9.69 | |||||
| 9.81 | |||||
| 9.94 | |||||
| 10.06 | |||||
| 10.19 | |||||
| 10.31 | |||||
| 10.44 | |||||
| 10.56 | |||||
| 10.69 | |||||
| 10.81 | |||||
| 10.94 | |||||
| 11.06 | |||||
| 11.19 | |||||
| 11.31 | |||||
| 11.44 | |||||
One of the strengths of our combined SDSS and 2MASS sample is that there are accurately measured colors for all the sample galaxies. Under the assumption of a universally-applicable stellar IMF, we can then constrain the stellar M/L ratios to within 25% in a systematic sense, given the uncertainties in galaxy age, dust content, and the role of bursts of SF (§3.3). From stellar M/L ratios, we construct galaxy stellar MFs from both the -band limited and optically-limited galaxy samples, which allows us to explore potential sources of systematic bias caused by the choice of passband.
In Fig. 16, we show an estimate of the stellar MF from our -band limited sample. The solid line shows the stellar MF for all galaxies. The dashed and dotted lines show early and late-type galaxies, respectively. A thin solid line denotes the Schechter function fit to the stellar MF, and the naked error bars show the -band-derived stellar MF from Cole et al. (2001). When expressed in terms of stellar mass, the early-type galaxies have a higher characteristic mass , and a shallower faint end slope , than the later types. Furthermore, the stellar MF that we derive is in excellent agreement with the estimate of Cole et al. (2001). Integrating under the MF, we find that our total -band stellar mass density estimate is (random and systematic errors, respectively; see §3.3), in excellent agreement with the estimate of Cole et al. (2001).
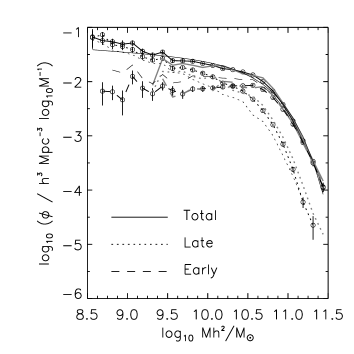
To explore 2MASS’s bias against LSB galaxies in a complementary way, we show a -band derived stellar MF in Fig. 17. The solid, dashed, and dotted black lines show the -band stellar MF for all galaxies, early-types and late-types, respectively. The grey lines show the results from Fig. 16 for the -band limited sample. A cursory inspection shows that the -band MF is relatively poorly fit by a Schechter function; the break in the MF is too sharp, and the stellar MF faintwards of is better fit by a single power law than a Schechter function. For this reason, we present the data points for the -band derived stellar mass functions in Table 5. The -band stellar MF shows excellent agreement at the knee of the MF with the -band stellar MF, and shows a steeper faint-end slope (below ), in agreement with our earlier prediction of the ‘real’ -band LF. This again argues that 2MASS misses faint LSB galaxies (§2.4). The -band stellar MF continues to much lower masses with better signal-to-noise than the -band stellar MF, showing that the stellar MF has a relatively steep faint end (). A steep stellar MF contrasts with most contemporary determinations of galaxy LFs over cosmologically-significant volumes, which have (e.g., Cole et al., 2001; Norberg et al., 2002; Blanton et al., 2003c). We expect a steeper stellar MF because late-type galaxies have lower stellar M/L ratios than earlier types, and there appears to be an increasing contribution from later types at low luminosities. An interesting implication of the Universal stellar MF is that, because of the strong variation in optical stellar M/L ratios with galaxy stellar mass (e.g., Kauffmann et al., 2003b), the faint end slope of optical LFs should be shallower than the faint end slope of NIR LFs. Deeper optical and especially NIR LFs will be in a good position to explore this issue in more detail.
6 Discussion
6.1 Changing the Stellar IMF
Bell & de Jong (2001) find that the dominant source of uncertainty in estimating stellar M/L ratios from galaxy luminosities and optical colors is the stellar IMF. Uncertainties in the slope of the stellar IMF for high-mass stars leave the color–M/L ratio correlation essentially unaffected. In contrast, uncertainties in the behavior of the stellar IMF for low-mass stars affects the overall M/L ratio scale. For example, an IMF richer in low-mass stars yields a higher stellar M/L ratio at a given color. Note that the uncertainties in the low-mass end of the IMF do not affect galaxy colors or luminosities, and hence, the color–M/L ratio correlation, because these stars are too faint.
Our stellar MFs are accurate to 30%, if we understand how the stellar IMF behaves at low stellar mass. This accuracy is useful for relative comparisons such as our estimate versus the stellar mass density of the Universe derived by Fukugita, Hogan, & Peebles (1998) or Glazebrook et al. (2003). However, to determine in an absolute sense the stellar MF, or stellar mass density of the Universe, or to compare with the Universal cold gas density, we must account for the full range of stellar M/L ratio uncertainty from uncertainties in stellar IMF.
We want to quantify a reasonable range of stellar IMF uncertainty. Bell & de Jong (2001) place a constraint on the stellar M/L ratios by demanding that the stellar mass in the central parts of spiral galaxies in the Ursa Major cluster not over-predict their rotation velocities. This ‘maximum-disk’ constraint forces there to be less low-mass stars than a Salpeter (1955) IMF, and motivates the ‘diet’ Salpeter IMF. Given the HST key project distance scale (Freedman et al., 2001), the Salpeter IMF is too rich in low-mass stars to satisfy dynamical constraints (e.g., Weiner, Sellwood, & Williams, 2001; Kauffmann et al., 2003a; Kranz, Slyz, & Rix, 2003). This result is strengthened by our earlier comparison with estimates of the total M/L ratios of early-types by Bernardi et al. (2003b), who find a color–M/L ratio correlation consistent with our ‘diet’ Salpeter IMF. There are considerable uncertainties in this kind of analysis, including aperture bias, the effects of a non-isotropic velocity ellipsoid on the measured velocity dispersion (e.g., Cretton, Rix, & de Zeeuw, 2000); nevertheless, it is encouraging that maximum disks and ‘maximum spheroids’ yield consistent results to the best of our knowledge. We therefore adopt the ‘diet’ Salpeter IMF as our default IMF, and the M/L ratios we derive from colors, assuming this IMF, will be good upper limits to the stellar M/L ratio.
Of course, the stellar M/L ratio can be lower than this maximal value. For example, Bottema (1993, 1997, 1999) argue for a substantially sub-maximal M/L ratio for all disk-dominated galaxies based on an analysis of the vertical velocity dispersion of stars. In a similar vein, Courteau & Rix (1999) argue that all disks are sub-maximal, based on a lack of surface-brightness dependence in the luminosity-linewidth relation (Tully & Fisher, 1977). In contrast, Athanassoula, Bosma, & Papaioannou (1987), Weiner, Sellwood, & Williams (2001), and Kranz, Slyz, & Rix (2003), use a variety of techniques to propose a scenario in which low rotation velocity galaxies are substantially sub-maximal (in agreement with Bottema, 1997; Courteau & Rix, 1999), and high rotation velocity ( massive) galaxies are essentially maximum-disk. The latter work is quite consistent with a constant, maximum-disk constrained IMF. Thus, it is the influence of a dark matter halo that will give sub-maximal M/L ratios for dark-matter dominated, LSB, slower rotators (e.g., de Blok & McGaugh, 1998).101010See Fig. 6 of Bell & de Jong (2001) for an illustration of the higher maximum disk M/L ratio estimates for LSB galaxies, plausibly indicating dark matter domination, even in the inner parts of the galaxies. We defer a clearly merited more detailed discussion of this issue to a future paper (de Jong & Bell, in preparation).
Attacking the problem from another angle, there is considerable and comparable uncertainty in the determinations of the IMF slope for low-mass stars in the Milky Way. These uncertainties are well-discussed in reviews by Scalo (1998) and Kroupa (2002). A fair assumption is that a universal IMF exists (although see, e.g., Scalo, 1998, for a differing view), and the range of proposed IMFs, from Salpeter (1955) to Kroupa, Tout & Gilmore (1993) to the 63% of maximum-disk velocity (Bottema, 1997), should bracket the possible IMF choices. To convert our maximum-disk constrained ‘diet’ Salpeter IMF to Salpeter (1955), Gould, Bahcall, & Flynn (1997), Scalo (1986), Kroupa, Tout & Gilmore (1993), Kroupa (2002), Kennicutt (1983), or Bottema 63% maximal IMFs, we should add roughly (0.15, 0.0, , 0.15, 0.15, 0.15, 0.35) dex to the stellar M/L ratios predicted using the maximal IMF111111Note that the Salpeter case violates the maximum disk constraints, however.. Thus, including the full range of systematic uncertainty, our stellar masses can be increased by dex, and decreased by dex, in a systematic sense. For comparison with other estimates of stellar mass density, our results are better constrained; they should be changed to the same IMF by adjusting the zero-point, and the full range of systematic uncertainty will then be dex.
6.2 The Stellar Mass Density of the Universe
It is interesting to consider at this stage the stellar mass density of the Universe. Adopting the ‘maximal’ diet Salpeter IMF, we find that (formal error), with a % systematic error due to LF uncertainties and the effects of dust and bursts of SF. This estimate of is an upper limit; if all galaxies are substantially sub-maximal, this estimate will need to be revised downwards. Splitting these into early and late types (by either concentration or color-selection), we find that and . This estimate accounts for classification and systematic stellar M/L ratio uncertainties, while assuming the same stellar IMF in early and late types. Thus, we find that between half and three quarters of the stellar mass in the local Universe is in early types (this is robust to exactly which universal IMF is chosen, as long as it applies to both early and late types). Of course, much of the stellar mass in late-type galaxies will also be old. This agrees with the conclusions of Hogg et al. (2002), who find a very similar result, but accounting for stellar M/L ratios in a less elaborate way. This conclusion is in qualitative agreement with the shape of the ‘cosmic SFH’ from direct (e.g. Madau et al., 1996; Yan et al., 1999; Blain et al., 1999), or indirect (Baldry et al., 2002; Glazebrook et al., 2003), estimates; all estimates agree that the bulk of SF in the Universe happened at early times, and is much slower at the present day.
Adopting the same ‘diet’ Salpeter maximum-disk tuned IMF as we do, Cole et al. (2001) find accounting for light missed by 2MASS, Persic & Salucci (1992) find , Fukugita et al. (1996) find , Kochanek et al. (2001) find , and Glazebrook et al. (2003) find values between and . Thus, our determination of is in excellent agreement with the literature determinations, and we have the advantage that we have estimated our stellar M/L ratios robustly, and our systematic uncertainties are better understood. We choose not to explore the quantitative consistency between our results and the integrated cosmic SFH, in part because the cosmic SFH is still poorly constrained in the particularly important epoch , where much of the stellar content in the Universe appears to have formed (e.g., Madau et al., 1996; Blain et al., 1999; Haarsma et al., 2000).
Bell et al. (2003a) discuss implications of this result for the baryonic MF of galaxies, the cosmic mean density of stellar and cold gas in the local Universe, and the mean ‘cold gas fraction’ in the local Universe, accounting again for the main sources of systematic uncertainty. Salucci & Persic (1999) present a complementary analysis of spiral galaxies using primarily dynamically-derived M/L ratios, finding a similar but slightly higher cosmic mean density of stellar and cold gas mass compared to Bell et al. (2003a). Either way, both works show the exciting potential offered by a detailed understanding of the mass-to-light ratios and stellar MFs in the local Universe.
It is interesting to use the stellar mass density estimate in conjunction with the luminosity densities that we derive to estimate the stellar M/L ratio of the local Universe. Taking the stellar mass density of the Universe to be , we find in passbands, with systematic errors of %, owing to uncertainties in SFHs and dust. These values agree well with 0.93 from Cole et al. (2001) using 2MASS -band (although we account for systematic error in the stellar M/L ratios), and the range 2.6–5.2 estimate of Glazebrook et al. (2003) in the -band using the cosmic mean galaxy spectrum as a constraint. Note that we scale both cases down from a Salpeter IMF to our maximally-massive ‘diet’ Salpeter IMF. Glazebrook et al. (2003) find a slightly larger range of possible M/L ratios than we do. Aperture effects may play a role, since they fit SFHs to the 3″fiber cosmic mean spectrum, which will be biased towards the inner (redder) parts of galaxies (e.g., Bell & de Jong, 2000). Another systematic difference is that Glazebrook et al. construct the M/L ratio from the cosmic mean spectrum, which increases the uncertainties in how much light comes from old stellar populations relative to the younger stars with lower M/L ratio. We do not suffer as much from this uncertainty because we see much of the old stellar population light directly from red early-type galaxies.121212Although note that Rudnick et al. (2003) find that the sum of individual color-derived stellar masses for intensely star-forming galaxies can overpredict the total stellar mass by nearly a factor of two, whereas estimating the stellar mass from the summed light of these star-forming galaxies yields a much more accurate estimate, as the composite SF history of many bursty galaxies is more nearly smooth than the SF histories of each individual galaxy. This uncertainty will affect us only minimally, bearing in mind that the total stellar mass is dominated by early-type galaxies at the present epoch (50%), and that the fraction of galaxies which are actively star-bursting is very low at the present epoch (e.g., Wolf et al., 2003).
7 Conclusions
A detailed understanding of the optical and NIR LFs and stellar MF is of fundamental importance to our understanding galaxy formation and evolution. We use a large sample of galaxies from 2MASS and the SDSS EDR to estimate the optical and NIR LFs and stellar MF in the local Universe, assuming a universally-applicable stellar IMF. We correct 2MASS extended source catalog Kron magnitudes to total by comparing 2MASS magnitudes with deeper data from a variety of sources. Using the complete sky coverage of 2MASS to maximal effect, we find that the SDSS EDR region is % overdense, and we correct for this overdensity when deriving LFs and stellar MFs.
We estimate -corrections, evolution corrections, and present-day stellar M/L ratios by comparison of galaxy magnitudes with galaxy evolution models at each galaxy’s redshift. The corrections and M/L ratios we derive are in excellent agreement with previous work, having the advantage that they incorporate the multi-passband information to maximal effect. We estimate 25% systematic errors in stellar M/L ratios from the effects of dust and bursts of SF, and we incorporate other random sources of error in our analysis. Assuming a universally-applicable stellar IMF, the limiting uncertainty in stellar M/L ratios is the overall uncertainty in the number of faint, low-mass stars. We conservatively adopt an IMF that has as many low-mass stars as possible without violating dynamical constraints in nearby galaxies. Of course, IMFs poorer in low-mass stars are possible, and can be well-approximated by subtracting a logarithmic constant from all stellar M/L ratios and stellar masses presented in this paper.
We construct optical and NIR LFs for galaxies in the local Universe using the formalism, which has the key advantage that it does not assume that galaxies in all environments have the same LF. The optical and NIR LFs that we estimate for this sample of galaxies agree to within the uncertainties with most recent literature optical and NIR LFs. We argue that 2MASS misses faint, LSB galaxies, leading to underestimates of up to 25% in the -band luminosity density. The optical and NIR luminosity densities in the local Universe look to be well-constrained to within %, and matches qualitatively a ‘cosmic SFH’ that peaks at early times and continues to the present day at a reduced rate, with metallicities of roughly solar.
We estimate the stellar MF using both -band and -band limited galaxy samples. The MFs we derive using both samples are consistent, given the bias against faint LSB galaxies in the 2MASS catalog. The -band derived stellar MF goes down to lower stellar masses than the -band MF. Both MFs agree with the Cole et al. (2001) stellar MF, if the same IMFs are assumed. The faint end slope of the stellar MF is steeper than , reflecting the relatively low stellar M/L ratios of low mass galaxies.131313Catalogs of stellar, estimated Hi and H2 gas masses (following Bell et al., 2003a) for SDSS EDR galaxies, along with electronic versions of the tables in this paper, are given at: http://www.mpia-hd.mpg.de/homes/bell/data.html
Under the assumption of a universally-applicable stellar IMF, the stellar mass density in the local Universe is , accounting for all sources of systematic and random error, except for IMF uncertainty. To change to a different IMF, we would reduce this estimate by a constant factor, as given in the text. Our stellar mass density estimate is consistent with earlier estimates, with the advantage that the systematic trends and errors in stellar M/L ratios are accounted for in this work. We find ‘cosmic’ stellar M/L ratios of , in solar units in , with % systematic errors, owing to the possible effects of bursts of SF and dust.
Finally, we examine type-dependence in the optical and NIR LFs and the stellar MF. In agreement with previous work, we find that the characteristic luminosity or mass of early-type galaxies is larger than for later types, and the faint end slope is steeper for later types than for earlier types. These results are robust to systematic differences in galaxy typing, although the overall numbers of early and late-type galaxies are somewhat dependent on the exact typing algorithm. Accounting for typing uncertainties, we estimate that at least half, and perhaps as much as 3/4, of the stellar mass in the Universe is in early-type galaxies.
References
- Andreon (2002) Andreon, S. 2002, A&A, 382, 495
- Athanassoula, Bosma, & Papaioannou (1987) Athanassoula, E., Bosma, A., & Papaioannou, S. 1987, A&A, 179, 23
- Baldry et al. (2002) Baldry, I. K., et al. 2002, ApJ, 569, 582
- Bell (2003) Bell, E. F. 2003, ApJ, 586, 794
- Bell & Bower (2000) Bell, E. F., & Bower, R. G. 2000, MNRAS, 319, 235
- Bell & de Jong (2000) Bell, E. F., & de Jong, R. S. 2000, MNRAS, 312, 497
- Bell & de Jong (2001) Bell, E. F., & de Jong, R. S. 2001, ApJ, 550, 212
- Bell et al. (2003a) Bell, E. F., McIntosh, D. H., Katz, N., & Weinberg, M. D. 2003a, ApJ, 585, L117
- Bell et al. (2003b) Bell, E. F., Wolf, C., Meisenheimer, K., Rix, H.-W., Borch, A., Dye, S., Kleinheinrich, M., McIntosh, D. H. 2003, submitted to ApJ (astro-ph/0303394)
- Benson et al. (2002) Benson, A. J., Lacey, C. G., Baugh, C. M., Cole, S., & Frenk, C. S. 2002, MNRAS, 333, 156
- Bernardi et al. (2003a) Bernardi, M., et al. 2003a, AJ, 125, 1849
- Bernardi et al. (2003b) Bernardi, M., et al. 2003b, AJ, 125, 1866
- Bernardi et al. (2003c) Bernardi, M., et al. 2003c, AJ, 125, 1882
- Blain et al. (1999) Blain, A. W., Smail, I., Ivison, R. J., & Kneib, J.-P. 1999, MNRAS, 302, 632
- Blanton et al. (2001) Blanton, M. R., et al. 2001, ApJ, 121, 2358
- Blanton et al. (2003a) Blanton, M. R., et al. 2003a, AJ, 125, 2348
- Blanton et al. (2003b) Blanton, M. R., et al. 2003b, submitted to ApJ (astro-ph/0209479)
- Blanton et al. (2003c) Blanton, M. R., et al. 2003c, submitted to ApJ (astro-ph/0210215)
- Bottema (1993) Bottema, R. 1993, A&A, 275, 16
- Bottema (1997) Bottema, R. 1997, A&A, 328, 517
- Bottema (1999) Bottema, R. 1999, A&A, 348, 77
- Brinchmann & Ellis (2000) Brinchmann, J., & Ellis, R. S. 2000, ApJ, 536, 77L
- Bromley et al. (1998) Bromley, B. C., Press, W. H., Lin, H., Kirshner, R. P. 1998, ApJ, 505, 25
- Boselli et al. (2000) Boselli, A., Gavazzi, G., Franzetti, P., Pierini, D., & Scodeggio, M. 2000, A&A, 142, 73
- Bower, Lucey, & Ellis (1992) Bower, R. G., Lucey, J. R., & Ellis, R. S. 1992, MNRAS, 254, 601
- Cole et al. (2000) Cole, S., Lacey, C., Baugh, C. M., Frenk, C. S. 2000, MNRAS, 319, 168
- Cole & Lacey (1996) Cole, S., Lacey, C. G. 1996, MNRAS, 281, 716
- Cole et al. (2001) Cole, S., et al. 2001, MNRAS, 326, 255
- Colless et al. (2001) Colless, M., et al. 2001, MNRAS, 328, 1039
- Courteau & Rix (1999) Courteau, S., & Rix, H.-W. 1999, ApJ, 513, 561
- Cretton, Rix, & de Zeeuw (2000) Cretton, N., Rix, H.-W., & de Zeeuw, P. T. 2000, ApJ, 536, 319
- Cross & Driver (2002) Cross, N., & Driver, S. P. 2002, MNRAS, 329, 579
- de Blok & McGaugh (1998) de Blok, W. J. G., & McGaugh, S. S. 1998, ApJ, 508, 132
- de Jong & Lacey (2000) de Jong, R. S., & Lacey, C. 2000, ApJ, 545, 781
- De Propris et al. (2003) De Propris, R., et al. 2003, MNRAS, 342, 725
- Efstathiou et al. (1988) Efstathiou, G., Ellis, R. S., & Peterson, B. A. 1988, MNRAS, 232, 431
- Felten (1977) Felten, J. E. 1977, AJ, 82, 861
- Freedman et al. (2001) Freedman, W. L., et al. 2001, ApJ, 553, 47
- Fukugita, Hogan, & Peebles (1998) Fukugita, M., Hogan, C. J., & Peebles, P. J. E. 1998, ApJ, 503, 518
- Fukugita et al. (1996) Fukugita, M., Ichikawa, T., Gunn, J. E., Doi, M., Shimasaku, K., & Schneider, D. P. 1996, AJ, 111, 1748
- Fioc & Rocca-Volmerange (1997) Fioc, M., & Rocca-Volmerange, B. 1997, A&A, 326, 950
- Gardner et al. (1997) Gardner, J. P., Sharples, R. M., Frenk, C. S., & Carrasco, B. E. 1997, 480L, 99
- Gavazzi et al. (1996a) Gavazzi, G., Pierini, D., Boselli, A., & Tuffs, R. 1996a, A&A, 120, 489
- Gavazzi et al. (1996b) Gavazzi, G., Pierini, D., Baffa, C., Lisi, F., Hunt, L. K., Randone, I., & Boselli, A. 1996b, A&A, 120, 521
- Gavazzi et al. (2000) Gavazzi, G., Franzetti, P., Scodeggio, M., Boselli, A., Pierini, D., Baffa, C., Lisi, F., & Hunt, L. K. 2000, A&A, 142, 65
- Glazebrook et al. (1995) Glazebrook, K., Peacock, J. A., Miller, L., & Collins, C. A. 1995, MNRAS, 275, 169
- Glazebrook et al. (2003) Glazebrook, K., et al. 2003, ApJ, 587, 55
- Gordon et al. (1997) Gordon, K. D., Calzetti, D., Witt, A. N. 1997, ApJ, 487, 625
- Gould, Bahcall, & Flynn (1997) Gould, A., Bahcall, J. N., & Flynn, C. 1997, ApJ, 482, 913
- Haarsma et al. (2000) Haarsma, D. B., Partridge, R. B., Windhorst, R. A., Richards, E. A. 2000, ApJ, 544, 641
- Hogg et al. (2002) Hogg, D. W., et al. 2002, AJ, 124, 646
- Hogg et al. (2003) Hogg, D. W., et al. 2003, ApJ, 585, L5
- Huang et al. (2003) Huang, J.-S., Glazebrook, K., Cowie, L. L., & Tinney, C. 2003, ApJ, 584, 203
- Hütsi et al. (2003) Hütsi, G., Einasto, J., Tucker, D. L., Saar, E., Einasto, M., Müller, V., Heinämäki, P., & Allam, S. S. 2003, submitted to A&A (astro-ph/0212327)
- Jarrett et al. (2000) Jarrett, T. H., Chester, T., Cutri, R., Schneider, S., Skrutskie, M., & Huchra, J. P. 2000, AJ, 119, 2498
- Kauffmann et al. (2003a) Kauffmann, G., et al. 2003a, MNRAS, 341, 33
- Kauffmann et al. (2003b) Kauffmann, G., et al. 2003b, MNRAS, 341, 54
- Kennicutt (1983) Kennicutt Jr., R. C. 1983, ApJ, 272, 54
- Kochanek et al. (2001) Kochanek, C. S., et al. 2001, ApJ, 560, 566
- Kodama & Arimoto (1997) Kodama, T., & Arimoto, N. 1997, A&A, 320, 41
- Kranz, Slyz, & Rix (2003) Kranz, T., Slyz, A., & Rix, H.-W. 2003, ApJ, 586,143
- Kron (1980) Kron, R. G. 1980, ApJS, 43, 305
- Kroupa, Tout & Gilmore (1993) Kroupa, P., Tout, C. A., & Gilmore, G. 1993, MNRAS, 262, 545
- Kroupa (2002) Kroupa, P. 2002, Science, 295, 82
- Lee et al. (2003) Lee, H., McCall, M. L., Kingsburgh, R. L., Ross, R., & Stevenson, C. C. 2003, AJ, 125, 146
- Lee, McCall & Richer (2003) Lee, H., McCall, M. L., & Richer, M. G. 2003, AJ, 125, 2975
- Lemson & Kauffmann (1999) Lemson, G., Kauffmann, G. 1999, MNRAS, 302, 111
- Lilly et al. (1995) Lilly, S. J., Tresse, L., Hammer, F., Crampton, D., Le Fevre, O. 1995, ApJ, 455, 108
- Lin et al. (1996) Lin, H., Kirshner, R. P., Shectman, S. A., Landy, S. D., Oemler, A., Tucker, D. L., & Schechter, P. L. 1996, ApJ, 464, 60
- Lin et al. (1999) Lin, H., Yee, H. K. C., Carlberg, R. G., Morris, S. L., Sawicki, M., Patton, D. R., Wirth, G., & Shepherd, C. W. 1999, ApJ, 518, 533
- Liske et al. (2003) Liske, J., Lemon, D. J., Driver, S. P., Cross, N. J. G., & Couch, W. J. 2002, submitted to MNRAS (astro-ph/0207555)
- Loveday (2000) Loveday, J. 2000, MNRAS, 312, 557
- Madau et al. (1996) Madau, P., Ferguson, H. C., Dickinson, M. E., Giavalisco, M., Steidel, C. C., & Fruchter, A. 1996, MNRAS, 283, 1388
- Martin & Kennicutt (2001) Martin, C. L., Kennicutt Jr., R. C. 2001, ApJ, 555, 301
- Mo et al. (1998) Mo, H. J., Mao, S., & White, S. D. M. 1998, MNRAS, 295, 319
- Nakamura et al. (2003) Nakamura, O., Fukugita, M., Yasuda, N., Loveday, J., Brinkmann, J., Schneider, D. P., Shimasaku, K., & SubbaRao, M. 2003, AJ, 125, 1682
- Nikolaev et al. (2000) Nikolaev, S., Weinberg, M. D., Skrutskie, M. F., Cutri, R. M., Wheelock, S. L., Gizis, J. E., & Howard, E. M. 2000, AJ, 120, 3340
- Norberg et al. (2002) Norberg, P., et al. 2002, MNRAS, 332, 827
- Persic & Salucci (1992) Persic, M., & Salucci, P. 1992, MNRAS, 258, P14
- Pier et al. (2003) Pier, J. R., et al. 2003, AJ, 125, 1559
- Rudnick et al. (2003) Rudnick, G., et al. 2003, submitted to ApJ (astro-ph/0307149)
- Salpeter (1955) Salpeter, E. E. 1955, ApJ, 121, 161
- Salucci & Persic (1999) Salucci, P., & Persic, M. 1999, MNRAS, 309, 923
- Sandage et al. (1979) Sandage, A., Tammann, G. A., & Yahil, A. 1979, ApJ, 232, 352
- Scalo (1986) Scalo, J. M. 1986, Fundam. Cosmic Phys., 11, 1
- Scalo (1998) Scalo, J. 1998, in ‘The Stellar Initial Mass Function (38th Herstmonceux Conference)’, eds. G. Gilmore and D. Howell, ASP Conference Series, v. 142, p 201.
- Schechter (1976) Schechter, P. 1976, ApJ, 203, 297
- Schlegel, Finkbeiner, & Davis (1998) Schlegel, D. J., Finkbeiner, D. P., & Davis, M. 1998, ApJ, 500, 525
- Schweizer & Seitzer (1992) Schweizer, F., and Seitzer, P. 1992, AJ, 104, 1039
- Skrutskie et al. (1997) Skrutskie, M. F., et al. 1997, in ‘The Impact of Large Scale Near-IR Sky Surveys’, eds. F. Garzon et al., p 25. (Dordrecht: Kluwer Academic Publishing Company)
- Shimasaku et al. (2001) Shimasaku, K., et al. 2001, AJ, 122, 1238
- Somerville, Primack, & Faber (2001) Somerville, R. S., Primack, J. R., Faber, S. M. 2001, MNRAS, 320, 504
- Stoughton et al. (2002) Stoughton, C., et al. 2002, AJ, 123, 485
- Strateva et al. (2001) Strateva, I., et al. 2001, AJ, 122, 1861
- Strauss et al. (2002) Strauss, M. A., et al. 2002, AJ, 124, 1810
- Trentham & Tully (2002) Trentham, N., Tully, R. B. 2002, MNRAS, 335, 712
- Tully & Fisher (1977) Tully, R. B., & Fisher, J. R. 1977, A&A, 54 661
- Tully et al. (1998) Tully, R. B., Pierce, M. J., Huang, J.-S., Saunders, W., Verheijen, M. A. W., & Witchalls, P. L. 1998, AJ, 115, 2264
- Tully et al. (2002) Tully, R. B., Somerville, R. S., Trentham, N., & Verheijen, M. A. W. 2002, ApJ, 569, 573
- Weiner, Sellwood, & Williams (2001) Weiner, B. J., Sellwood, J. A., & Williams, T. B. 2001, ApJ, 546, 931
- Wolf et al. (2003) Wolf, C., Meisenheimer, K., Rix, H.-W., Borch, A., Dye, S., & Kleinheinrich, M. 2003, A&A, 401, 73
- Wright (2001) Wright, E. L. 2001, ApJ, 556, 17L
- Yan et al. (1999) Yan, L., McCarthy, P. J., Freudling, W., Teplitz, H. I., Malumuth, E. M., Weymann, R. J., Malkan, M. A. 1999, ApJ, 519, L47
- York et al. (2000) York, D. G., et al. 2000, AJ, 120, 1579
- Zabludoff & Mulchaey (2000) Zabludoff, A. I., & Mulchaey, J. S. 2000, ApJ, 539, 136
Appendix A Mass-to-light ratios and galaxy colors
As an aid to workers in the field, we present the and -band distributions of stellar M/L ratio, and the color–M/L ratio relations in the different SDSS and 2MASS passbands.

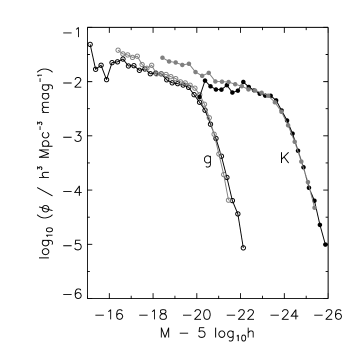
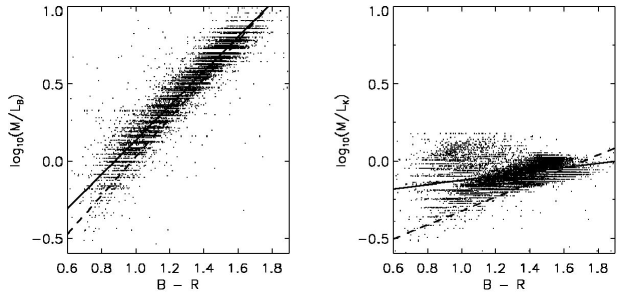
| M/L | ||||
|---|---|---|---|---|
| (1) | (2) | (3) | (4) | (5) |
| K-band | ||||
| 0.40 | 3.65 | |||
| 0.36 | 3.08 | |||
| 0.32 | 2.16 | 3.21 | ||
| 0.28 | 3.39 | 4.35 | ||
| 0.24 | 1.64 | 2.16 | 2.69 | 3.53 |
| 0.20 | 1.97 | 1.69 | 2.11 | 2.90 |
| 0.16 | 1.74 | 1.45 | 1.67 | 2.24 |
| 0.12 | 1.83 | 1.46 | 1.31 | 1.72 |
| 0.08 | 1.43 | 1.34 | 1.26 | 1.50 |
| 0.04 | 1.86 | 1.41 | 1.29 | 1.50 |
| 0.00 | 2.16 | 1.72 | 1.66 | 1.68 |
| 0.04 | 1.66 | 1.79 | 2.21 | 2.67 |
| 0.08 | 1.49 | 1.83 | 2.82 | 3.36 |
| 0.12 | 1.50 | 2.17 | 3.45 | 3.58 |
| 0.16 | 2.12 | |||
| g-band | ||||
| 0.46 | 4.07 | |||
| 0.37 | 3.29 | |||
| 0.29 | 3.34 | 4.05 | ||
| 0.20 | 2.73 | 3.50 | 4.57 | |
| 0.12 | 2.18 | 2.97 | 4.25 | |
| 0.03 | 1.89 | 2.48 | 3.53 | |
| 0.05 | 1.66 | 2.14 | 3.06 | 4.96 |
| 0.14 | 1.49 | 1.92 | 2.64 | 4.41 |
| 0.22 | 1.57 | 1.81 | 2.31 | 3.88 |
| 0.31 | 1.53 | 1.77 | 2.12 | 3.02 |
| 0.39 | 1.60 | 2.04 | 2.15 | 2.78 |
| 0.48 | 1.62 | 1.71 | 1.94 | 2.45 |
| 0.56 | 1.80 | 1.60 | 1.65 | 2.06 |
| 0.65 | 2.25 | 1.83 | 1.56 | 1.77 |
| 0.73 | 2.20 | 2.48 | 1.97 | 1.87 |
| 0.82 | 3.09 | 2.58 | 2.44 | |
| 0.90 | 2.92 | 3.23 | 3.43 | |
| 0.99 | 1.81 | 2.13 | 2.58 | 3.32 |
| Color | ||||||||||||||
|---|---|---|---|---|---|---|---|---|---|---|---|---|---|---|
| 0.221 | 0.485 | 0.099 | 0.345 | 0.053 | 0.268 | 0.105 | 0.226 | 0.128 | 0.169 | 0.209 | 0.133 | 0.260 | 0.123 | |
| 0.390 | 0.417 | 0.223 | 0.299 | 0.151 | 0.233 | 0.178 | 0.192 | 0.172 | 0.138 | 0.237 | 0.104 | 0.273 | 0.091 | |
| 0.375 | 0.359 | 0.212 | 0.257 | 0.144 | 0.201 | 0.171 | 0.165 | 0.169 | 0.119 | 0.233 | 0.090 | 0.267 | 0.077 | |
| 0.400 | 0.332 | 0.232 | 0.239 | 0.161 | 0.187 | 0.179 | 0.151 | 0.163 | 0.105 | 0.205 | 0.071 | 0.232 | 0.056 | |
| 0.499 | 1.519 | 0.306 | 1.097 | 0.222 | 0.864 | 0.223 | 0.689 | 0.172 | 0.444 | 0.189 | 0.266 | 0.209 | 0.197 | |
| 0.379 | 0.914 | 0.220 | 0.661 | 0.152 | 0.518 | 0.175 | 0.421 | 0.153 | 0.283 | 0.186 | 0.179 | 0.211 | 0.137 | |
| 0.367 | 0.698 | 0.215 | 0.508 | 0.153 | 0.402 | 0.171 | 0.322 | 0.097 | 0.175 | 0.117 | 0.083 | 0.138 | 0.047 | |
| 0.106 | 1.982 | 0.022 | 1.431 | 0.006 | 1.114 | 0.052 | 0.923 | 0.079 | 0.650 | 0.148 | 0.437 | 0.186 | 0.349 | |
| 0.124 | 1.067 | 0.041 | 0.780 | 0.018 | 0.623 | 0.041 | 0.463 | 0.011 | 0.224 | 0.059 | 0.076 | 0.092 | 0.019 | |
| Color | ||||||||||||||
| 0.942 | 1.737 | 0.628 | 1.305 | 0.520 | 1.094 | 0.399 | 0.824 | 0.261 | 0.433 | 0.209 | 0.210 | 0.206 | 0.135 | |
| 0.976 | 1.111 | 0.633 | 0.816 | 0.523 | 0.683 | 0.405 | 0.518 | 0.289 | 0.297 | 0.262 | 0.180 | 0.264 | 0.138 |
A.1 The Distribution of Stellar M/L ratios
In Fig. 18, we show the number density of galaxies as a function of their estimated stellar M/L ratio, assuming our maximal ‘diet’ Salpeter IMF. We denote different mass bins (in ) with different line styles: dot-dashed , solid , dotted , and dashed . In -band, the bin is missing because of poor number statistics. In -band, it is clear that the average stellar M/L ratio increases with increasing galaxy stellar mass, which indicates that more of the stars were formed at an earlier time (e.g., Kauffmann et al., 2003b). Moreover, the scatter becomes somewhat narrower in stellar M/L ratio at high stellar mass indicating less diversity in SFH. Massive galaxies tend to be rather old, regardless of morphological type, whereas less massive galaxies can have a wide range of ages (see also, e.g., Fig. 2 of Kauffmann et al., 2003b). Hints of this trend in -band are visible, but much weaker, showing the well-documented lack of sensitivity of M/LK ratio to SFH (Bell & de Jong, 2001). Sources of error include uncertainties from magnitude errors, systematic uncertainties in stellar M/L ratio from dust and bursts of SF (% in terms of stellar M/L ratio), and Poisson errors. The systematic uncertainties dominate, but are difficult to meaningfully estimate; thus, error bars are not given in this particular case. We tabulate the and -band distributions in Table 6.
It is worth briefly commenting on why these distributions are
useful. In Fig. 19, we show the observed
-band (open circles) and -band (filled circles)
LFs in black. Overplotted in grey are the predictions
from the -band-derived stellar MF, using the average
stellar M/L ratio as a function of stellar mass (as is often
used by galaxy modelers to transform a stellar mass distribution
into a luminosity function141414Often, a single ‘typical’
stellar M/L ratio is used, which is even worse than the case we explore.).
To transform the stellar mass into
luminosities, we adopt the bi-weight fit of
stellar M/L ratio as a function of stellar mass:
, and
. The estimated -band LF is
in excellent agreement with the observed LF around the knee of the
LF, and is in reasonable agreement at all luminosities with the
predicted -band LF, once 2MASS’s selection bias against
LSB galaxies is corrected for (the thick
grey dashed line in Fig. 8). This indicates
that the variation in stellar M/L ratio in -band at a given stellar mass
is sufficiently small so that the predicted LF is close to the real LF.
In contrast, using the average M/Lg ratio at a given stellar mass
is clearly insufficient to reproduce
the -band LF; especially at the faint end
where one sees in Fig. 18 that the scatter
in M/Lg ratio is particularly large. This shows the importance of
accounting for the spread in stellar M/L ratio at a given mass
when transforming a stellar mass function into a luminosity function,
especially in the optical.151515This also applies to transforming
LFs from one passband into another using a luminosity-dependent
typical color. If the spread in color at a given luminosity is rather small,
one can get away with this approximation. If the spread in color
is larger, the estimated LF will be biased.
A.2 The Stellar M/L Ratio–Color Correlation
Bell & de Jong (2001) presented relationships between Johnson/Cousins optical-NIR colors and stellar M/L ratios in the optical and NIR using the galaxy models of Bell & Bower (2000). In this paper, we construct stellar M/L ratio estimates using galaxy evolution model fits to SDSS and 2MASS -band fluxes, finding tight correlations between optical color and stellar M/L ratio (e.g. Fig. 6). Therefore, in this appendix we compare our results with Bell & de Jong (2001), we examine the color–M/L ratio correlations in detail where necessary, and we present fits to the color–M/L ratio correlations in the SDSS/2MASS passbands.
To facilitate inter-comparison between our results, we choose to predict Johnson/Cousins M/L ratio values for the best-fit SEDs to the SDSS/2MASS galaxies in the -band selected sample. We estimate colors using the transformation in Fukugita et al. (1996): , with a mag systematic error.
We show two representative color–M/L ratio correlations in Fig. 20, where we show the M/L ratio in -band (left-hand panel) and -band (right-hand panel) as a function of color. Additionally, we give the least-squares ‘robust’ bi-weight fit to the estimates (solid line), and the relationship from the mass-dependent formation epoch with bursts model from Bell & de Jong (2001, dashed line). These two panels are easily compared with panel (d) of Fig. 1 in Bell & de Jong (2001); indeed, this is why we chose to estimate colors and Johnson/Cousins M/L ratios. The agreement between the ‘least-squares fit to many passbands’ methodology of this paper is in excellent agreement with the galaxy modeling of Bell & de Jong (2001) for the -band M/L ratio–color relation. This result is insensitive to detailed passband choice since all the optical M/L ratio–color correlations that we derive are consistent with Bell & de Jong (2001).
In the right-hand panel of Fig. 20, we show the run of -band stellar M/L ratio estimates from the ‘least-squares fit to many passbands’ methodology we adopt in this paper (points) against the galaxy model-based estimate of Bell & de Jong (2001, dashed line). We note the somewhat poorer agreement between these two different methodologies. There is a zero point offset, owing to our use of Pégase rather than the Bruzual & Charlot (in preparation) models. Furthermore, there is considerably more scatter at the blue end of the correlation than the models of Bell & de Jong (2001) predict, and a somewhat shallower correlation than is expected on the basis of their galaxy modeling. The data points fill in the range of possible colors and M/L ratios of stellar populations with a wide variety of ages and metallicities Bell & de Jong (2001, Fig. 2, panel c), indicating that this spread is primarily caused by a spread in metallicity . In particular, it is clear that optically-blue galaxies have a wide range of estimated metallicities. Recall that our methodology in this paper is to estimate ages and metallicities using the optical–NIR colors following Bell & de Jong (2000). In contrast, the galaxy evolution models of Bell & de Jong (2001) do not have a large metallicity spread, and therefore, do not reproduce this feature. This large metallicity spread flattens the optical color-M/LK ratio correlation, adding dex scatter at the blue end. It is important to note that this 0.2 dex scatter is no more than a factor of two in excess of the scatter in optical M/L ratios as a function of color.
In conclusion, we find that the optical M/L ratios as a function of color are in good agreement with Bell & de Jong (2001). However, for NIR M/L ratios we find that real galaxies suggest a larger metallicity scatter than accounted for by Bell & de Jong (2001), leading to a shallower color-M/L ratio slope and a larger spread at the blue end. In Table 7 we present the correlations between SDSS colors and SDSS/2MASS M/L ratios, and between colors and Johnson/Cousins M/L ratios, to allow intercomparison with Bell & de Jong (2001), and to allow the estimation of systematic differences between their work and ours in the NIR. Typical M/L ratio uncertainties are dex in the optical, and 0.1 (0.2) dex in the NIR at the red (blue) end. We do not present -band M/L estimates for -band (because of its strong sensitivity to recent SF) or correlations involving only NIR colors (because of their strong metallicity sensitivity).