Chandra discovery of the intracluster medium around UM425 at redshift 1.47
Abstract
We report on a discovery of a candidate cluster of galaxies at redshift z=1.47 based on Chandra observations in the field of quasars UM425 A & B. We detect with high significance diffuse emission due the intracluster hot gas around the quasar pair. This is the second highest redshift cluster candidate after 3C294 at z=1.786. The diffuse emission is elliptical in shape with about extent. If indeed at z=1.47, this corresponds to a physical size of 140 h Kpc and 2–10 keV luminosity of erg s-1. The cluster is unlikely to be the long sought gravitational lens invoked to explain unusual brightness of UM425 A and the close quasar pair. Coexistence of the quasars with the cluster suggests a link of activity to cluster environment. The unusual brightness of UM425 A may then be due to a higher accretion rate. We also comment briefly on the X-ray spectra of UM 425 A & B which also happen to be broad absorption line quasars. We argue that present evidence suggests that the quasars are just a pair and not lensed images of the same quasar.
1 Introduction
It is becoming increasingly clear the we live in a weird Universe, filled with about 73% dark energy, 23% dark matter and only some 4% ordinary matter (Bennett et al. 2003, Spergel et al. 2003). One expectation from this “low density” cosmological model is that large scale structures formed early in time. A number of cluster surveys are designed to find high redshift clusters of galaxies in optical and radio wavelengths (e.g. Shectman et al. 1996, Kurk et al. 2001) to provide independent cosmological constraints. In X-rays, clusters are identified by the diffuse thermal emission from the intracluster gas, which in fact accounts for most of their baryonic mass. A number of X-ray surveys have been very successful in finding clusters, determining their physical properties and using them as cosmological tools (e.g. Vikhlinin et al. 1998, Vikhlinin et al. 2002a).
Chandra , because of its exquisite mirrors (Van Speybroeck et al. 1997) and detectors (Garmire et al. , in preparation), started a new era of cluster research. The sub-arcsecond point spread function and low background of Chandra allowed detailed studies of low redshift X-ray bright clusters (e.g. McNamara et al. 2000, Fabian et al. 2000) and also led to the discovery of the highest redshift cluster candidate (at z =1.78, Fabian et al. 2001). While the clustering properties of low redshift clusters are used to determine cosmological parameters (e.g. Bahcall et al. 1999, Schuecher et al. 2001), just the number density of hot, high redshift clusters can also provide constraints to the matter density of the Universe (Donahue et al. 1998, Fabian et al. 2001). For example, the existence of z=1.78 cluster with temperature of keV is inconsistent with a Universe (Fabian et al. 2001). Finding hot, X-ray clusters at high redshifts, therefore, becomes important.
Here we report a serendipitous discovery of a cluster candidate traced by hot intracluster medium around quasar pair UM425 A & B at z=1.47. This quasar pair, separated by , was discovered by Meylan & Djorgovski (1989) as a gravitational lens candidate because of the unusually large luminosity of the brighter of the pair and its relatively large redshift. Ever since, whether the pair represents lensed or binary quasars has been a matter of debate. To cause such a wide angle separation a massive cluster of galaxies along the line sight would be required, but none was found down to a limiting magnitude of (Courbin et al. 1995). UM425 A & B also happen to be broad absorption line quasars (BALQSOs). BALQSOs are extremely faint X-ray sources, and in pre-Chandra era, X-ray spectroscopy of BALQSOs was practically impossible (Mathur et al. 2000 and references there in). With Chandra , many BALQSOs were detected in X-rays (Green et al. 2001, Gallagher et al. 2002), but spectroscopy was feasible for only a handful of them. The original objective behind our Chandra proposal was to study the X-ray spectrum of UM425 A, taking advantage its unusual brightness. While the main focus of this paper is the unexpected discovery of diffuse intracluster medium, we also briefly discuss the BALQSOs. A cosmological model with km s-1 Mpc-1, and is used throughout the paper.
2 Observation and Analysis
2.1 Chandra observation
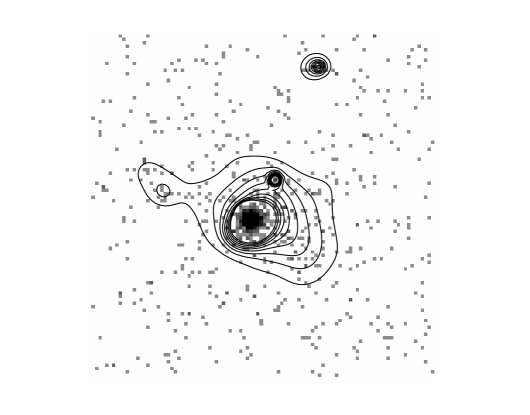
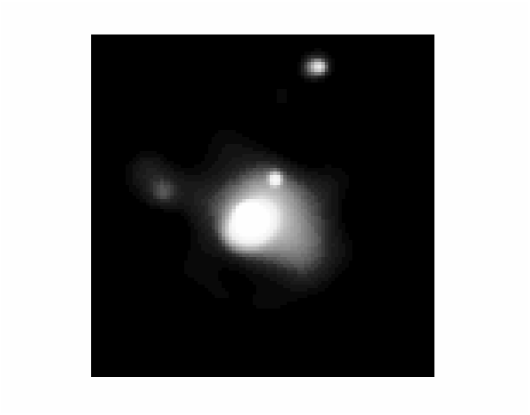
We observed UM425 with Chandra on 13 December 2001 for a exposure time of 110 ksec. The advanced CCD imaging camera for spectroscopy (ACIS-S, C. R. Canizares et al. in preparation) was used at the nominal aimpoint. The data were reduced in a standard manner using Chandra interactive analysis software (CIAO version 2.3, Elvis, M. et al. in preparation) and following the thread for imaging analysis 111see: http://asc.harvard.edu/ciao/threads/index.html. Figure 2 shows the soft band (0.3–3 keV) image of the field. The quasars UM425 A & B are clearly detected with and net, background subtracted counts each in the broad band (0.3–8 keV). In addition, faint extended emission is clearly seen extending to west-southwest of UM425 A. Contours of 2,3,4,5 and 6 times the background are overlayed on the image showing the extent and significance of the diffuse emission. Figure 2 shows the adaptively smoothed image of the field in the soft band created using CIAO tool csmooth and used to generate the contours mentioned above. We used a Gaussian smoothing function with a threshold of 2. The smooth image was then divided by the smoothed exposure map. The resulting image is displayed in figure 2 and clearly shows the diffuse emission.
2.2 The extended diffuse emission
The diffuse emission is somewhat elliptical in shape and extends to about west-southwest of UM425 A with total extent of about . This corresponds to about 140 kpc at z=1.47. Because of the presence of the strong point source (UM425 A), it is difficult to determine the exact number of counts from the diffuse emission. First, we extracted counts from a smaller region well outside the area occupied by the point sources. Then we scaled these counts by the area of the entire diffuse emission as shown in figures 1 and 2. In this way we estimate 130 counts from the diffuse emission. Background counts from a region of same size are estimated to be about 38. With net counts, the diffuse emission is thus highly significant at level.
As another method of estimating the total counts from the diffuse emission, we extracted all counts from an annular region surrounding UM425 A. The inner core of the bright point source was excluded, and the extraction region extended out to a radius of 12 arcsec, completely covering the apparent extent of the diffuse emission. We then used the ChaRT222http://asc.harvard.edu/chart/ and MARX333http://asc.harvard.edu/chart/threads/marx/ tools to simulate the point spread function (PSF) of UM425 A, and used the same region described above to extract the counts from the outer wings of the simulated PSF. There were counts in the image extraction region, in the simulated PSF region, and in UM425 B, resulting in net counts from the diffuse emission, consistent with the estimate above.
For spectral analysis, we used only the counts from the small extraction region defined above, which is about half the size of the total area of the diffuse emission. With just 46 net counts, spectral shape cannot be determined accurately. Nevertheless, we performed spectral analysis to obtain rough estimate of the temperature of the diffuse plasma using Sherpa spectral fitting package within CIAO. Using Raymond-Smith thermal plasma model, and fixing the abundance to 0.1 solar and foreground absorbing column to Galactic ( atoms cm-2), we find the best fit temperature to be 2.1 keV at the redshift of the cluster, assumed to be z=1.47. This estimate is highly uncertain, with lower limit on the rest frame temperature being keV with 90% confidence; upper limit is unconstrained. Assuming the rest frame temperature of keV, the observed unabsorbed flux is and erg s-1 cm-2.
2.3 The BALQSOs
Because BALQSOs are believed to be highly absorbed sources, we used absorbed power-law models to fit their X-ray spectra. The presence of excess soft photons, however, often points to partial covering of the source by absorbing material (see Grupe, Mathur & Elvis 2003 for detailed procedure of spectral analysis that we follow). For UM425 A, the best fit spectrum ( for 112 degrees of freedom) yields following parameters: power-law slope (), column density at the source N cm-2 and the covering fraction . This spectrum, and those of other BALQSOs, show that strong absorption is the main cause of their X-ray faintness (Grupe et al. 2003, Green et al. 2001, Gallagher et al. 2001).
UM425 B has too few counts for accurate spectral analysis, but we can test whether the UM425 A spectrum provides adequate description of UM425 B data. Keeping all other parameters constant, and allowing only normalization to be the free parameter, the fit is not good with too few counts around a keV compared to the model. If we allow both normalization and absorbing column density to vary, then the resulting N cm-2, over an order of magnitude higher than that in the A component. Alternatively, keeping the NH constant as in component A, but allowing the covering fraction to vary, leads to reaching the hard limit of . Thus the spectra of UM425 A & B are found to be inconsistent.
3 Discussion
Chandra observations of UM425 field led to the discovery of hot intracluster medium around the quasar pair. High-z clusters are rare, and so are the large separation quasar pairs; chance association of these two uncommon phenomena is unlikely. Is the X-ray cluster at the redshift of the quasars, hosting the pair, or is it the foreground lens? Aldcroft et al. (2003) have shown that to produce the large observed separation between the quasar pair, the minimum cluster temperature will have to be , with luminosity erg s-1 at z=0.5 resulting in observed flux of erg s-1 cm-2. Given the uncertainty, we cannot rule out the temperature of 1.5 keV at z=0.5 (). However, if the observed cluster has this temperature at z=0.5, the resulting flux is and erg s-1 cm-2. Thus the observed X-ray flux is over five times fainter than the minimum flux estimated for the foreground lens, so the X-ray cluster is unlikely to be the lower redshift lensing cluster. UM425 field has been a target of cluster searches because the quasar pair was thought to be lensed and because there is a small overdensity of galaxies in the field, suggestive of a foreground cluster (Meylan & Djorgovski 1989, Corbin et al. 1995). However, no such cluster is found. This also suggests that the X-ray cluster reported here is at a much higher redshift. Deep imaging and spectroscopic studies will be required to confirm the redshift of the X-ray cluster, but it is highly likely to be at the redshift of the quasars, hosting the pair. This is exciting, because only one other cluster at a higher redshift is known (Fabian et al. 2001)
Assuming the cluster to be at z=1.47, we find its size to be 140 kpc and luminosity erg s-1 and erg s-1 for temperature kT=2.1 keV. These values of temperature and luminosity lie right on the LX–T relation for low redshift groups and cluster (Mulchaey & Zabludoff 1998), which is remarkable given the large uncertainty determination of both the quantities and possible evolution of the LX–T relation with redshift (Vikhlinin et al. 2002b). The luminosity is at the lower end of that found for clusters. The observed size of the diffuse emission, however, is small, more like that of a group. The faint diffuse emission that we detect must trace the more luminous intracluster gas from the cluster core. Our estimates of temperature and luminosity may then be considered as lower limits. Given the serendipitous nature of this discovery, we cannot determine the space density of such hot high redshift clusters. The presence of a few such clusters on the sky at redshifts of about 1.5 and higher is consistent with the currently popular cosmological model with and , but we cannot rule out the model based on just this observation with poor temperature constraint (c.f. Fabian et al. 2001, who find that the maximum number of collapsed objects with temperature larger than 10 keV to be about 100 for redshifts higher than z=1.8).
The association of the X-ray cluster with the quasars also implies that they are just a pair of quasars, not lensed images of the same quasar. This interpretation is also supported by the different X-ray spectra of the two objects (though, in principle, slightly different sightlines to the nuclear X-ray source can explain the observed difference). We can also explain the unusual brightness of UM425 A without invoking lens magnification. Association of UM425 A & B with the X-ray cluster, and observations by Martini et al. (2002) who found high fraction of AGNs in cluster Abell 2104, suggests that a cluster environment is conducive for triggering of AGN activity. UM425 A is about two magnitudes brighter than other quasars at similar redshifts (Aldcroft et al. 2003). Czerny et al. (1997) have shown that most quasars usually radiate at of their Eddington luminosity. If UM425 A is radiating at close to Eddington limit, it can easily have an order of magnitude larger luminosity for similar black hole mass and radiative efficeincy. Such a high accretion rate relative to Eddington may be related to the recent triggering of the quasar (Mathur 2000) and supports the hypothesis that BALQSOs represent an early phase in quasar lifetimes (Canalizo & Stockton 2001, Fabian 1999, Becker et al. 2000). If the fraction of quasars with unusually high luminosity is small, it may imply that the high accretion phase does not last long. The faint B component was only discovered because of its close proximity to UM425 A.
To summarize, our Chandra observations led to two interesting results. First, the discovery of a cluster candidate with second highest redshift and second, evidence suggesting a connection between cluster environment and quasar activity and supporting evolutionary hypothesis to understand the BALQSO phenomenon.
References
- (1) Aldcroft, T. & Green, P.J. 2003, ApJ, submitted.
- (2) Bahcall, N.A., Ostriker, J.P., Perlmutter, S. & Steinhardt, P.J. 1999, Science, 284, 1481
- (3) Becker, R., White, R., Gregg, M., Brotherton, M., Laurent-Muehleisen, S., Arav, N., 2000, ApJ, 538, 72
- (4) Bennett, C. et al. 2003, ApJ, submitted. (astro-ph/0302207)
- (5) Canalizo, G. & Stockton 2001, ApJ, 55, 719
- (6) Courbin, F., et al. 1995, A&A, 303, 1
- (7) Donahue, M., Voit, G.M., Gioia, I., Luppino, G., Hughes, J. & Stocke, J. 1998, ApJ, 502, 550
- (8) Fabian, A.C. 1999, MNRAS, 308, L39
- (9) Fabian, A.C. et al. 2000, MNRAS, 318, L65
- (10) Fabian, A.C., Crawford, C.S., Ettori, S. & Sanders, J.S. 2001, MNRAS, 322, L11
- (11) Gallagher, S., Brandt, W.N., Chartas, C., Garmire, G.P., 2002, ApJ, 567, 37
- (12) Green, P.J., Aldcroft, T., Mathur, S., Elvis, M. & Wilkes, B 2001, ApJ, 558, 109
- (13) Grupe, D., Mathur, S. & Elvis, M. 2003, AJ, submitted
- (14) Kurk, J., Venemans, B., Roettgering, H., Miley, G., & Pentericcini, L. 2001, in “Probing cosmic evolution with galaxy clusters”. (astro-ph/0110131)
- (15) Martini, P., Kelson, D., Mulchaey, J., & Trager, S. 2002, ApJL, 576, 109
- (16) Mathur, S. 2000, MNRAS, 314, L17
- (17) Mathur, S. et al. 2000, ApJL, 533, 79
- (18) McNamara, B. et al. 2000, ApJ, 534, 135
- (19) Meylan, G., & Djorgovski, S. 1989, ApJL, 338, 1
- (20) Mulchaey, J. & Zabludoff, A. 1998, ApJ, 496, 73
- (21) Schuecker, P. et al. 2000, MNRAS, 319, 939
- (22) Shectman, S.A. et al. 1996, ApJL, 470, 172
- (23) Spergel, D.N. et al. 2003, ApJ, submitted. (astro-ph/0302209)
- (24) Van Speyboeck, L., et al. 1997, SPIE Proceedings, 3113, 89
- (25) Vikhlinin, A., McNamara, B., Forman, W., Jones, C., Quintana, H., & Hornstrup, A. 1998, ApJ, 502, 558
- (26) Vikhlinin, A., Van Speybroek L., Markevitch, M., Forman, W., & Greco, L. 2002b, ApJL, 578, 107
- (27) Vikhlinin, A. et al. 2002a, ApJ, submitted (astro-ph/0212075)