Spectroscopy of the near-nuclear regions of Cygnus A: estimating the mass of the supermassive black hole
Abstract
We use a combination of high spatial resolution optical and near-IR spectroscopic data to make a detailed study of the kinematics of the NLR gas in the near-nuclear regions of the powerful, FRII radio galaxy Cygnus A (), with the overall goal of placing limits on the mass of any supermassive black hole in the core. Our K-band infrared observations (0.75 arcsec seeing) – taken with NIRSPEC on the Keck II telescope – show a smooth rotation pattern across the nucleus in the Pa and H2 emission lines along a slit position (PA180) close to perpendicular to the radio axis, however, there is no evidence for such rotation along the radio axis (PA105). Higher spatial resolution observations of the [OIII]5007 emission line – taken with STIS on the Hubble Space Telescope (HST) – confirm the general rotation pattern of the gas in the direction perpendicular to the radio axis, and provide evidence for steep velocity gradients within a radius of 0.1 arcsec of the core — corresponding to the high surface brightness structure visible in high resolution narrow band images. The [OIII] line remains broad throughout the core region ( – km s-1), but the spatial distribution of [OIII] provides no evidence for an unresolved inner narrow line region (INLR). Assuming that the ionized gas is circularly rotating in a thin disk and that the large line widths are due to activity-induced turbulence, the circular velocities measured from both the Keck and HST data lead to an estimate of the mass of the supermassive black hole of M⊙. For the host galaxy properties of Cygnus A, this mass is consistent with the global correlations between black hole mass and host galaxy properties deduced for non-active galaxies. Therefore, despite the extreme power of its radio source and the quasar-like luminosity of its AGN, the black hole in Cygnus A is not unusually massive considering the luminosity of its host galaxy. Indeed, the estimated mass of the black hole in Cygnus A is similar to that inferred for the supermassive black hole in the FRI radio galaxy M87, despite the fact that the AGN and radio jets of Cygnus A are 2 – 3 orders of magnitude more powerful. Overall, these results are consistent with the idea that the properties and powers of the AGN in radio galaxies are determined as much by the mass accretion rates, as by the absolute masses of their supermassive black holes.
As well as providing evidence for a supermassive black hole in the core of Cygnus A, our data also demonstrate that nuclear activity has an important effect on the kinematics of the circum-nuclear gas on a sub-kpc scale. Most notably, the velocity offsets measured in the two outer HST/STIS slit positions are consistent with the presence of an activity-induced outflow in the NW cone.
keywords:
galaxies:active – galaxies:individual:Cygnus A – galaxies:emission lines – quasars:general – galaxies: kinematics and dynamics1 Introduction
With the high spatial resolution afforded by the Hubble Space Telescope (HST) and high resolution ground-based instruments there has been considerable progress over the last decade in determining the central mass distributions of galaxies. In consequence, there is now compelling evidence for massive dark objects (MDOs) in the cores of many apparently “normal” galaxies. Moreover, the masses of the MDOs are found to correlate with both the luminosities and the velocity dispersions of the bulges of the host galaxies (e.g. Kormendy & Richstone 1995, Gebhardt et al. 2000, Ferrarese & Merritt 2000).
Given that supermassive black holes are generally considered to be the driving force for much of the extreme activity observed in active galactic nuclei (AGN) and the accompanying radio-emitting jets, there is clearly an interest in extending studies of the MDOs to active galaxies and quasars. Such studies are important because the properties of the putative central supermassive black holes and the associated accretion flows are likely to be crucial in determining the properties of the AGN, including: the total power output; the presence or absence of an accretion disk; the shapes of the SEDs; and the ability to form powerful radio jets.
However, kinematic studies of the mass distributions in the central regions of active galaxies face several potential difficulties. These include:
-
•
Resolution. Most luminous AGN are relatively distant, and it can be difficult to resolve the central regions in sufficient detail to determine the accurate mass distributions.
-
•
Radial motions. Intense nuclear activity may be accompanied by outflows in the warm emission line gas driven by jets, AGN-driven winds or circum-nuclear starbursts. Such outflows may distort the velocity patterns in the near-nuclear regions.
-
•
Extinction. Dust extinction associated with the central obscuring tori and/or kpc-scale dust lanes, may “hide” some of the circum-nuclear structures orbiting around the black hole, and lead to a failure to observe the full range of velocities in the circum-nuclear disks.
-
•
Contamination by the AGN. Contamination by the psf of the bright AGN can hamper attempts to measure gas and stellar kinematics in the near-nuclear regions (depending on orientation).
Partly as a consequence of these difficulties, few active galaxies have direct measurements of their central mass distributions, based on studies of the kinematics of the narrow emission line gas. This problem is most acute for radio-loud active galaxies: only a few genuine radio galaxies — including M84, M87 and Cen A — have accurate measurements of their central mass distributions, and all of these belong to the low luminosity, FRI, sub-class (e.g. Bower et al. 1998, Marconi et al. 1997, 2001).
Based on indirect black hole mass estimates, there have been suggestions that the radio properties of active galaxies may be linked to the mass and/or relative mass accretion rates of the central supermassive black holes (e.g. Franceschini, Vercellone & Fabian 1998; McMclure et al. 2000; Ghisellini & Celotti 2001). Therefore, it is important to attempt to determine accurate dynamical masses for the MDOs in the central regions of more powerful, FRII, radio galaxies.
In this paper we present high spatial resolution observations of the emission line gas in the central regions of the nearby FRII radio galaxy Cygnus A (), taken with the aim of determining the central mass distribution. The observations, which comprise near-IR observations taken with the Keck II telescope, as well as optical observations taken with the Hubble Space Telescope (HST), illustrate both the potential and the pitfalls of observations of this type. They allow us to estimate the mass of the black hole in Cygnus A. They also provide important information about the structure and kinematics of the narrow line region (NLR) in this key object.
We assume the cosmological parameters km s-1 Mpc-1 and throughout this paper. For these parameters 1.00 arcsecond corresponds to 1.00 kpc at the redshift of Cygnus A.
2 Previous observations of Cygnus A
Cygnus A is the most powerful radio source in the local universe () and also one of the best observed across the electromagnetic spectrum. A full review of the properties of Cygnus A is presented in Carilli & Barthel (1996). To provide a context to the results presented below, in this section we describe relevant observations at X-ray, optical and near-IR wavelengths.
Much of the work over the last decade has involved using Cygnus A to test the orientation-based unified schemes for powerful radio sources, which suggest that all powerful radio galaxies contain hidden quasar nuclei (Barthel 1989).
The most direct evidence for a hidden quasar in Cygnus A is provided by X-ray observations which show evidence for a nuclear power-law component at hard X-ray energies (Ueno et al. 1994, Young et al. 2002), and optical imaging- and spectro-polarimetry observations which show a biconical reflection nebula (Tadhunter et al. 1990, Ogle et al. 1997) and scattered broad line emission lines in polarized light (Ogle et al. 1997). Although a point-like nuclear source is detected at near-IR wavelengths in this object (Djorgovski et al. 1991, Tadhunter et al. 1999), the high polarization of this source suggests that it represents scattered light from a near-nuclear reflection nebula, rather that the quasar nucleus observed directly in transmission (Tadhunter et al. 2000). Based on the absorption corrected X-ray luminosity of the core, and assuming that Cygnus A has a spectral energy distribution similar to the radio-loud quasars in Elvis et al. 1994, the AGN in Cygnus A has a bolometric luminosity in the range erg s-1. This places it at the lower end of the range of quasar bolometric luminosities.
The presence of a luminous, hidden illuminating source is further supported by optical narrow-band imaging observations which reveal kpc-scale ionization cones both to the south east and north west of the radio core (Jackson et al. 1998), and long-slit spectroscopy observations which show a “U”-shaped ionization pattern in the direction perpendicular to the radio axis on the NW side of the nucleus (Tadhunter, Metz & Robinson 1994). There is no evidence for an unresolved emission line source in the nucleus at optical wavelengths, although a high-surface-brightness “V”-shaped emission line structure is detected close to the position of the radio core (Jackson et al. 1998).
The kpc-scale cones and reflection nebulosity are also detected at near-IR wavelengths (Tadhunter et al. 1999), where they appear edge-brightened close to the nucleus. The edge-brightening of the cones strongly suggests that they have been hollowed out by circum-nuclear outflows.
A major advantage of Cygnus A for black hole studies is that, provided the rotation axis of the inner disk is parallel to the radio axis and to the axis of the inner torus, the inclination () of this axis to the line of sight is well-constrained. From the jet/counter-jet flux ratio and apparent expansion speed of the VLBI jet, the results of Sorathia et al. (1996), Krichbaum et al. (1998) and Bach et al. (2002) are consistent with degrees for our adopted cosmology, depending on the degree of free-free absorption of the counter-jet by the torus close to the nucleus (see discussion in Krichbaum et al. 1998). If we assume that the starburst ring detected in colour composite HST images of the nuclear regions of Cygnus A is intrinsically circular (Fosbury et al. 1999), the observed degree of flattening of the ring leads to . Perhaps the strongest constraint, however, is provided by the that fact that we do not detect the quasar nucleus directly at optical wavelengths and therefore cannot be looking directly into cones. Using the opening half angle of the cones measured from the HST emission line images ( degrees) this constraint leads to degrees for the gas in the inner (obscuring) regions of Cygnus A. Overall, observations at both optical and radio wavelengths are consistent with the idea that the radio jet is perpendicular to the inner disk and has an inclination to the line of sight in the range degrees.
If there is a supermassive black hole in Cygnus A we expect the gravitational influence of the black hole to be reflected in the emission line kinematics in the core region. However, existing ground-based spectroscopic observations of the kinematics of the ionized gas on a kpc-scale in the ionization cones reveal a complex picture (Simkin 1977, Tadhunter et al. 1994, Stockton, Ridgeway & Lilly 1994, Taylor et al. 2003). At radial distances between 1 and 3 arcseconds in the ionization cone to the north west of the nucleus, the results of Stockton et al. (1994) show that the brightest emission lines are split by 300 km s-1, with the greatest splitting coincident with the axis of the cone (approximately the radio axis). A fainter, but higher velocity component — moving at -1500 to -1880 km s-1 in the rest frame of Cygnus A — is also detected 1.2 arcseconds from the nucleus, 0.5 arcseconds to the N of the radio axis (Tadhunter 1991, Tadhunter et al. 1994). These line splittings and high velocity components are consistent with the effects of outflows induced by the radio-emitting jets, or by winds driven either by the quasar nucleus or a circum-nuclear starburst. The linear structures of the emission line filaments in the NW cone, visible in high resolution H emission line images (Jackson et al. 1998), are also consistent with the effects of a large-scale outflow.
Within a radial distance of 1 arcsecond of the nucleus the emission line kinematics appear to be more quiescent, with a velocity gradient across the nucleus in the N-S direction (total amplitude 200 km s-1), and a rotation-curve-like pattern observed out to radial distances of 2 arcseconds to both the north and south of the nucleus (Simkin 1977, Stockton et al. 1994). However, Tadhunter et al. (1994) have noted that, despite the apparently quiescent emission line kinematics close to the nucleus, there is a peak in the [OIII] line width coincident with the radio core. The overall rotation pattern in the N-S direction is likely to be associated with the large scale disk that causes the patchy dust obscuration visible in high resolution continuum images of the core region (Jackson et al. 1998).
To summarise the important features of the published results that are relevant to measuring the mass distribution in the central regions of Cygnus A:
-
-
the host galaxy Cygnus A harbours a quasar nucleus and is therefore expected to contain a supermassive black hole that drives the quasar activity;
-
-
the circumnuclear torus acts as a natural coronograph, blocking of the direct light of the quasar nucleus along our line of sight, and allowing the spatially resolved gas kinematics to be measured close to the nucleus;
-
-
there is a high-surface-brightness emission line structure close to the core which might be used as a kinematic probe of the mass distribution;
-
-
the geometry and inclination are well-constrained by radio and optical observations;
-
-
the existing low resolution observations provide clear evidence for rotation in the central kpc, with the rotation axis aligned close to the radio axis.
However, the existence of patchy dust obscuration across the central regions, and presence of disturbed emission line kinematics in the NW cone, suggest that some caution is required when interpreting the emission line kinematics in the core region of this highly active galaxy.
3 Observations and Reductions
3.1 Near-IR observations
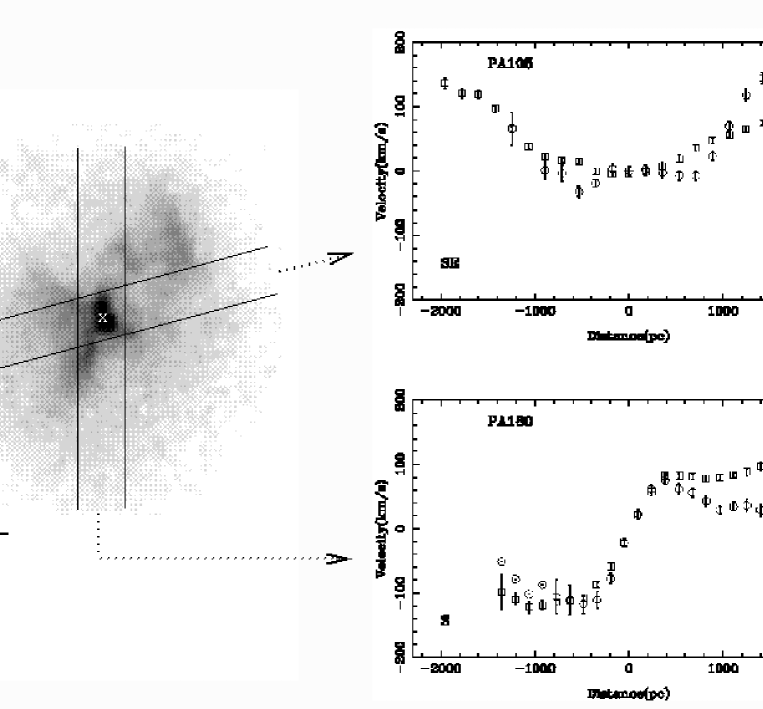
Near-IR spectroscopic observations of Cygnus A were taken on the night of the 22/23 May 2000 using the NIRSPEC spectrograph in grating mode on the Keck II telescope (see McLean et al. 1998 for a description of NIRSPEC). Long-slit spectra were taken along two position angles: PA180 and PA105. Figure 1 shows the slit positions marked on a 2.0m NICMOS/HST image of Cygnus A (see Tadhunter et al. 1999 for details). In order to facilitate good sky subtraction, the object was nodded between two apertures along the slit in an ABBA pattern, with an integration time of 400s for each of the four exposures.
As a first step in the data reduction, the spectra were rectified using purpose-written IRAF routines, and arc-calibrated in IRAF using an Argon/Neon arc lamp exposure taken at the time of the observations. Following the manual removal of cosmic rays using the CLEAN routine in FIGARO, the separate sub-exposures for each PA were combined to produce a sky-subtracted 2D image. Atmospheric absorption features were removed by dividing by a high S/N spectrum of the standard star HD203856, which was observed at a similar air mass. Use of the 0.57 arcsecond slit resulted in a spectroscopic resolution of 9.90.5Å ( 150 km s-1) with the observations covering the wavelength range 1.91 – 2.3m in the K-band. From measurements of stars along the slit used for the Cygnus A observations we estimate a plate scale of 0.1780.004 arcseconds per pixel, and an effective seeing of 0.750.05 arcseconds (FWHM) for the observations. Measurements of night-sky emission lines in the reduced frames demonstrate the wavelength scale is accurate to within 0.5Å (8 km s-1) along the full length of the slit.


3.2 Optical HST/STIS observations
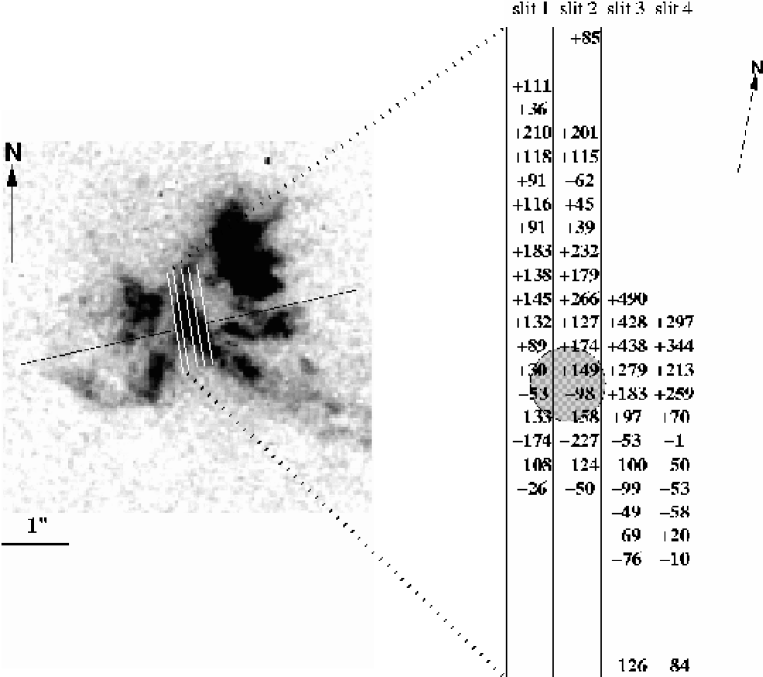
Our HST/STIS observations of Cygnus A comprise observations at five parallel slit positions covering the high surface brightness emission line structure in the core region of Cygnus A (Jackson et al. 1998). The position angle for the observations was PA10 degrees (within 5 degrees of perpendicular to the radio axis). A 0.152 arcsecond slit was employed for these observations, and the slit was offset successively by 0.1 arcseconds in the E-W direction between the exposures. The slits were placed relative to the core of Cygnus A by first using a peak-up routine to accurately centre the slit on a nearby star, then performing an offset to the core region of Cygnus A. For this purpose accurate core and offset star positions were determined from our NICMOS images (Tadhunter et al. 1999). The positions of the slits relative to the central emission line structures are shown in Figure 2. Useful data were obtained in four slit positions. We label the slit furthest to the east slit 1 and the slit furthest to the west slit 4; slit 2 corresponds to the position of the near-IR core source and contains the peak emission line flux. In order to facilitate better correction for cosmic rays, hot pixels and other cosmetic defects, the telescope was dithered by 10.5 pixels in the direction parallel to the slit at each slit position, and observations at each dither position were split into two separate sub-exposures. The total exposure time for each of the four useful positions was 2400s.
The first stages of the data reduction were carried out using the standard pipeline software. A major problem with STIS CCD data is the large number of hot pixels. In order to reduce this problem we extracted the most up-to-date dark frame from the HST archive to use in the reduction process. Purpose-written software was then used to combine the two dither positions and thereby remove residual cosmic rays and hot pixels.
Use of the F430L grating resulted in a linear dispersion of 2.75Å per pixel, and the instrumental width — estimated from measurements of arc lines in calibration lamp exposures — is 6.250.4Å (FWHM). On the basis of the information given in the STIS instrument handbook the estimated absolute uncertainty in the wavelength scale is 0.5 pixels or 1.4Å (80 km s-1)111The relative uncertainty in the wavelength calibration between spectra taken in different orbits but within the 5 orbit HST visit used for the Cygnus A observations is likely to be smaller than this. Data for the individual slit position were taken in different orbits and calibrated with arcs taken at the start of each orbit. Based on the header information in the reduced files there is no evidence for a major change in the wavelength calibration between orbits. The pixel scale in the spatial direction is 0.05 arcseconds per pixel, and the estimated spatial resolution for the combined frames is 0.1 arcseconds.
Both the STIS/HST and the NIRSPEC/Keck data were analysed using the Starlink DIPSO package.
4 Results
4.1 Kinematics based on near-IR lines
Full analysis of the near-IR emission line spectrum is beyond the scope of this paper, although we note that our Keck spectra show spatially extended molecular (H2), recombination (Pa) and coronal ([SXI]1.92m, [SiVI]1.96m) lines along both slit position angles, with a maximum spatial extent of 2 arcseconds (2 kpc). Here we concentrate on kinematic measurements derived from the bright Pa(1.875m) and H2(1-0)S(1)(2.121m) lines, which are among the most extended. The radial velocity curves for the two slit position angles are shown in Figure 1. In both of these plots the measurements are based on single Gaussian fits to cores of the line profiles, even though it is clear that the broad wings to Pa — detected within the seeing disk of the nucleus — are not accounted for in such a simple model. In these plots the zero wavelength velocity shift corresponds to a vacuum wavelength of 19805.0Å ().
Considering first the results for PA180 it is clear that the Pa and H2 lines show a smooth rotation curve, with a steep gradient across the nucleus, and with the same sense of rotation as measured for the optical emission lines in both HST (see below) and ground-based spectra. The velocity amplitude (100 km s-1) is also similar to that measured on a kpc-scale in ground-based optical spectra, and outside a radius of 0.2 arcseconds in our HST spectra.
In contrast, the spectra along PA105 (the radio axis) show no sign of a steep velocity gradient across the position of the continuum centroid, even though broad wings to the Pa lines are detected close to the nucleus.
It is notable that significant differences in the emission line kinematics between the Pa and H2 lines are present along both PAs, although the two lines show a similar overall pattern. The differences are clearest on the north side of the nucleus along PA180, and to the north-west of the nucleus along PA105 — the region of line splitting detected in ground-based optical spectra. These kinematic differences suggest that the Pa and H2 lines may sample different parts of the kpc-scale structure surrounding the nucleus of Cygnus A. However, there is good agreement between the kinematics of the two lines close to the nucleus, out to a radial distance of 0.5kpc.
4.2 [OIII] kinematics in the core of Cygnus A
We present the results of single Gaussian fits to [OIII]5007,4959 lines detected in the STIS/HST data in Figures 2, 3 and 4. A two dimensional map of the radial velocities is shown in Figure 2, while the variations in radial velocity and line width as a function of slit position are plotted in Figures 3 and 4. In these plots the zero velocity shift corresponds to a vacuum wavelength of 5288.5Å (reshift: ) — we will discuss whether this zero redshift is appropriate in section 4.3 below. It is notable that the velocity curves for all four slit positions show steep velocity gradients within a radius of 0.1 arcseconds (100pc) of the assumed position of the nucleus. The velocity amplitude is -220 km s-1 to the south of the nucleus, and +420 km s-1 to the north of the nucelus, and the steepest gradient is measured in the slit position centred on the position of the near-IR core source (slit 2). Outside a radial distance of 0.1 arcseconds, the velocity curves measured for all four slit positions appear to flatten out, and the velocity amplitudes (100 km s-1) are consistent with those measured in ground-based long-slit spectroscopy and the results from the near-IR spectroscopic results reported in section 4.1. If all the velocity variations are interpreted in terms of rotational motion, the sense of rotation on a 100pc scale appears to be the same as that on a 0.1 — 1 kpc scale.
However, despite showing clear evidence for rapid rotation across the nucleus, not all the features of the STIS observations are consistent with simple rotation in a planar, filled disk structure surrounding the nucleus which has a rotation axis coincident with the large-scale radio axis. Most notably, within the central 0.1 arcseconds, the velocity curves measured in slits 3 and 4 appear to be displaced by -150 to -200 km s-1 relative to the velocity curves measured in slits 1 and 2 (see Figures 2 and 3). There is no clear evidence for such a displacement on a larger radial distances along the slit (although the data are noisier on such scales). Also, the degree of displacement is larger than can be accounted for by systematic errors in the absolute wavelength calibration. Therefore, these displacements appear to be real.
As well as the radial velocity variations, we have also estimated the widths (FWHM) of the [OIII] emission lines at all locations across the core region. The line widths are plotted against position in Figure 4. These have been quadratically corrected for the instrumental profile using the instrumental width determined from the arc exposures (6.250.4Å). The fact that the narrowest line widths measured in the outer parts of the core region are close to the assumed instrumental width suggests that this instrumental width is appropriate for our observations.
The striking feature of Figure 4 is that the lines are not only broad in the region closest to the nucleus (within a radial distance of 0.1 arcseconds), but remain broad ( km s-1) out to radial distances of 0.3 arcseconds on either side of the nucleus. Although the broadest lines ( km s-1) are detected in the pixels closest to the nucleus, there is no evidence from these data that an unresolved inner narrow line region (INLR) contributes a large fraction of the flux in nuclear regions at these wavelengths.
4.3 Comparison between near-IR and optical results
Optical observations of the core region are potentially distorted by extinction in the circum-nuclear dust lane. Indeed, there is clear evidence for patchy dust obscuration from previous optical high resolution HST images (Jackson et al. 1998). Such obscuration could have the consequence that we see only foreground material, and miss the line of nodes of more rapidly rotating material buried deeper in the dust lane. The near-IR spectroscopic observations should not be significantly affected by the dust obscuration on this scale. Therefore, in this section we attempt to assess the extent to which the dust extinction distorts the velocity profiles, by comparing various optical and infrared datasets.
The similarity between the shapes and amplitudes of the large-scale IR (Pa and H2), the ground-based optical ([OIII], H: Stockton et al. 1994), and HST/STIS optical ([OIII]) rotation curves suggests that, at least on a scale of 0.2 — 2kpc, the optical observations are not missing any high velocity, rapidly rotating components that are hidden by dust extinction in the core regions.
As well as the shapes of the spatially-resolved radial velocity curves, it is also important to compare the redshifts corresponding to the assumed zero velocities for different datasets, in order to investigate whether there are any systematic offsets in the absolute velocities. Table 1 compares the various systemic redshifts that have been obtained for Cygnus A over the last three decades. It is immediately clear from this table that there remains some uncertainty about the systemic redshift. In particular, some of the recent studies based on the optical/near-IR stellar absorption features give significantly lower values for the redshift than the optical and infrared emission lines and the HI 21cm radio absorption line. Otherwise, the various emission line-based estimates are consistent with the low redshift component of the HI 21cm absorption line within the errors.
Taken at face value, the differences between the emission and absorption line estimates might be taken to imply that the entire circum-nuclear disk associated with the dust lane is undergoing systematic motion relative to the stellar halo of the host galaxy. The fact that the effect is seen in the IR emission lines rules out the possibility that the true velocity distribution is in fact symmetric relative to the stellar halo and we are missing blueshifted wavelengths due to dust extinction. However, there also exists clear evidence that the absorption line profiles are distorted due to infilling by nearby emission lines (Stockton et al. 1994, Thornton et al. 1999). Therefore, while we cannot entirely rule out the possibility that the disk/dust lane is moving relative to the stellar halo, it appears more plausible that the disk/dust lane is stationary with respect to the stellar halo, and the absorption line estimates are systematically too low because of the emission line contamination.
| Type of Measurement | Redshift | Reference |
| Ground-based absorption lines | ||
| MgIb absorption, 5” N of nucleus | 0.05670.0016 | Sprinrad & Stauffer (1982) |
| MbIb absorption in core | 0.055620.00015 | Stockton, Ridgway & Lilly (1994) |
| CaII triplet absorption in core | 0.055440.0004 | Thornton et al. (1999) |
| Ground-based emission lines | ||
| OIII, NII, H radial velcity curves | 0.055970.00015 | Stockton, Ridgway & Lilly (1994) |
| Broad OIII in core ( arcsec) | 0.056060.00012 | Taylor et al. (2002) |
| Pa, H2 radial velocity curves | 0.055920.00005 | This paper |
| Broad Pa in core ( arcsec) | 0.055940.00005 | This paper |
| Radio observations of HI 21cm absorption line | ||
| HI absorption against core (high velocity) | 0.056630.00002 | Conway & Blanco (1995) |
| HI absorption against core (low velocity) | 0.056000.00002 | Conway & Blanco (1995) |
| Space-based (HST/STIS) emission lines | ||
| OIII radial velocity curves ( arcsec) | 0.055960.00024 | This paper |
| OIII (broad) spatially integrated ( arcsec) | 0.056160.00024 | This paper |
As a final check that we have not missed high velocity components at optical wavelengths because of dust extinction, we can compare the STIS/HST [OIII] and NIRMOS/Keck kinematics for the gas on an arcsecond scale. Although we do not resolve the Pa and H2 velocity fields on this scale at the resolution of our Keck observations, we do detect broad wings to these lines within the seeing disk close to the nucleus. If we assume that these broad wings are associated with the unresolved circum-nuclear regions, we can then make a direct comparison with the spatially-integrated [OIII] emission line profile from our STIS/HST data. Figure 5 shows the best-fitting two Gaussian (broad+narrow) line fit to the profile of Pa in the nuclear regions. The broad component to Pa has a width of 75050 km s-1 (FWHM)222Note that what we label here as the “broad” component cannot represent transmitted or scattered light from a genuine, high density broad line region (BLR) close to the central AGN, because this component is also detected in the forbidden lines.. This compares with 85050 km s-1 obtained from a single Gaussian fit to the profile of [OIII] integrated over all four viable slit positions of our STIS/HST observations out to a radius of 0.3 arcseconds from the spatial position of the core. The redshift of the broad component measured in the near-IR data is also consistent with that measured from the integrated [OIII] line profile in the STIS/HST data to within the errors. Overall, these results are consistent with the idea that the broad component to Pa samples the same velocity structure as the [OIII] line in the circum-nuclear region, and that the HST/STIS observations do not miss high velocity components, even on the arcsecond scale. They also suggest that the narrow emission line component — detected in Pa — makes a negligible contribution to the STIS/HST observations for arcseconds. The fact that this latter component is detected in the ground-based IR and optical observations is likely to be a consequence of the wider slit used for the ground-based observations and seeing disk spill-over from the bright extra-nuclear emission line regions to the NW and SE.

5 Discussion
5.1 The nature of the emission line kinematics
A radial distances of 0.2 — 1 kpc, the optical and IR emission line kinematics are consistent with rotation about an axis that is close to that of the large scale radio structure (see also Simkin 1977). At smaller radii the HST/STIS data also show some features that are consistent with rotation in the same sense as the larger-scale gas, but the velocity shifts measured between the four STIS slits are inconsistent with simple rotation in a planar disk with a rotation axis aligned along the radio axis. Possible explanations for these shifts include the following.
-
1.
The rotation axis is significantly offset with respect to the radio axis. If the individual slit position angles were significantly offset from the perpendicular to the rotation axis, this would lead to apparent radial velocity shifts between the velocity curves from different slit positions. This explanation would imply that the rotation axis of the gas on a arcsecond scale is substantially different from that of the large scale disk/dust lane.
-
2.
Non-circular motions distort the velocity field close to the nucleus. There is already clear evidence for radial flows in Cygnus A including the line splitting measured at radial distances of 1 — 3 kpc in the NW cone (Stockton et al. 1994), and the redshifted [OIII] emission line components detected in polarized light (Ogle et al. 1997). If these features are indeed due to radial flows, the flows are moving at 100 — 500 km s-1 relative to the nucleus.
Given that the most highly redshifted component to the NW is not far from the radio axis (see Figure 2), the first of these possibilities would imply that, while the gas in the large-scale dust lane is rotating about an axis that is close to the radio axis, some of the gas in the near-nuclear regions ( arcseconds) would be rotating about an axis that is almost perpendicular to the radio axis. However, other components in the near-nuclear regions would be following the rotation pattern of the large scale disk structure. It is difficult to conceive of a situation in which the two gas streams with perpendicular rotation axes could survive on a reasonable timescale. In order to avoid the intersection, the orbits of the gas streams would require different radii, but the highly redshifted component to the NW has velocity amplitude which is greater than that of the gas on a smaller scale along the north and south edges of the bicone. Moreover, our modelling work shows that the implied mass of the black hole () would be inconsistent with the results derived from the near-IR data (see section 5.2). Overall, this explanation appears to be untenable.
Therefore, the most plausible explanation for the large redshifts measured in slits 3 and 4 to the west of the nucleus is that we are observing a component that is not undertaking the pure circular rotation motion of the large-scale disk/dust lane. We discuss the nature of these non-circular motions in section 5.5.
5.2 The mass of the MDO in Cygnus A
In order to investigate the mass distribution we followed the method described in detail by Marconi et al. (2002). This consists of the two main steps:
-
1.
The stellar contribution to the gravitational potential in the nuclear region is obtained by assuming that the intrinsic geometry of the stellar density distribution is an oblate spheroid with constant mass-to-light ratio and by comparing the expected surface brightness distribution in the plane of the sky with the observed one.
-
2.
The gravitational potential given by the stellar mass distribution obtained in (i) and a possible MDO are used to model the observed rotation curves, assuming that the gas is in a thin, circularly rotating disk in the principal plane of the stellar potential.
The first step was to obtain the surface brightness distribution of the starlight. However, a complication in the case of Cygnus A is that the near-nuclear regions are likely to be heavily extinguished at optical wavelengths by the circum-nuclear dust lane (see Jackson et al. 1998). Therefore, we used our near-IR observations taken with NICMOS/HST to estimate the mass contribution of stars in the near-nuclear regions. The 1.6m (F160W) image presented in Tadhunter et al. (1999) provides a good compromise between decreased extinction (due to long wavelength) and a relatively small contribution of the nuclear point source to the flux close to the nucleus. The measured 1.6m light profile is shown in Figure 6. Because of the potentially high extinction due to the dust lane and the significant flux contribution from near-nuclear illumination cones (Tadhunter et al. 1999), in fitting the light profile, we have only considered points outside a projected radius of arcseconds.

Given that the extinction may be significant even at near-IR wavelengths, it is important to assess whether the H-band radial light profile in the central regions of Cygnus A is consistent with that expected for a luminous early-type galaxy. Therefore we fitted a “Nuker” law, which Faber et al. (1997) have shown to provide a good fit to the optical surface brightness distributions of nearby elliptical galaxies. The Nuker law can be written as:
| (1) |
where is the break radius. The dotted line in Figure 6 shows the Nuker law fit to the 1.6m (F160W) profile. This fit yields arcsec (1.63 kpc), , , . Although these values of , and are within the range measured for giant elliptical galaxies with similar absolute magnitude to Cygnus A, the break radius is significantly larger than measured for any of the giant elliptical galaxies with core profiles in Faber et al. (1997). This may suggest that the dust extinction has a significant effect on the near-nuclear H-band light profile of Cygnus A. However, the dashed line shows the Nuker law fit for the giant elliptical galaxy NGC4874 – which has a similar absolute magnitude to Cygnus A — normalised to the measured flux of Cygnus A at a radius of 1.6 arcsec (at the outer edge of the dust lane visible in optical images of Cygnus A). The fact that this dashed curve does not fall much above the Nuker law fit to the 1.6m profile suggests that the effect of the dust lane extinction is relatively small — at the 10% level.
Having demonstrated that the H-band light profile is not heavily affected by extinction, the next step was to derive the stellar density profile assuming a constant mass-to-light ratio and oblate spheroidal geometry (step (i) above). We assumed the following form for the stellar density profile (see Marconi et al 2002):
| (2) |
where is given by
| (3) |
and is a reference system with the plane corresponding to the principal plane of the potential. is the intrinsic axial ratio of the gravitational potential. The expected radial light profile was obtained by integrating the stellar luminosity density along the line of sight and convolving it with the psf. The , , and were then adjusted to give the best fit to the data. As before, we only used points at for the fits. The best fit – shown as the solid line in Figure 7 – assumes that the gravitational potential is spherical (). This is a reasonable approximation, given that the ellipticity of the isophotes is around 0.2, i.e. their observed axial ratio is 0.8. For an assumed mass-to-light ratio of we obtained the following fit parameters: arcsec, , , M⊙ pc-3. The case of a “disk-like” light distribution (Figure 6, dashed line), with an intrinsic axial ratio of , gives arcsec, , , M⊙ pc-3. It addition to fitting the density law to the measured points (see Figure 7), we have also fitted it to the Nuker profile given by the dashed line in Figure 6. This allows the maximum likely contribution of stars to the mass in the nuclear regions to be estimated.

Using the shape of the stellar density profile derived from the surface brightness fits we then modelled the near-IR radial velocity data, assuming there is a point-like massive dark object (MDO) in the nucleus of the galaxy, and that the inclination of the rotation axis of the disk to the line of sight is degrees. In adopting the latter inclination we assumed that the emission line disk is perpendicular to both the jet and the illumination cones axes (see section 2). This modelling takes full account of the point spread function or seeing disk of the observations, as well as the finite slit width (see Marconi et al. 2002 for full details).
Our models require a functional form for the intrinsic line flux distribution. We find that, after convolution with the psf and binning into pixels, the line flux distribution along the slit is well-fitted by two radially symmetric exponentials with scale radii of 0.39” and 0.48” respectively. However, the line flux distribution can also be adequately fitted with a combination of two Gaussians, or a Gaussian and a constant.
Using the two exponential functional form for the line flux distribution we fitted the radial velocity curves along PA180 and PA105 leaving the MDO mass, the mass-to-light ratio of the stellar populations , the position of the nucleus along the slit, the systemic redshift, and the PA of the line of nodes as free parameters. The best fitting model has: M⊙, and a position angle for the line of nodes of 6 degrees. Note that the latter is close to the 15 degrees expected if the disk is exactly perpendicular to the radio axis; the systemic redshift and position of the nucleus along the slit are also consistent with the values assumed in Figure 1 and Table 1. The results of the fitting are shown in Figure 8.

We attempted to estimate the errors on and , based on a analysis of a two parameter variation about the best fit model. At the 3- level we obtained: M⊙ and . This fitted is consistent with the predicted by the spectral synthesis models for an old stellar population with age Gyr (assuming a Scalo initial mass function). We also explored the sensitivity of the fit to other parameters and assumptions and found that the fit is not sensitive to: (a) the functional form assumed for the line flux distribution; (b) whether we fit the PA180 data alone or both PA180 and PA105 together; and (c) the assumed form of the stellar flux/density profile (i.e. whether Nuker, spherical, or disk-like). We also found that, for the stellar density profile derived from the H-band images, we could not obtain an adequate fit to the data without a point-like MDO at the centre of the Cygnus A (see the dotted line in Figure 8). Perhaps the largest uncertainty in estimating the mass of the MDO is the inclination: we assumed degrees, but the inclination could fall in the range , based on the constraints provided by various optical and radio data (see section 2). Taking into account this uncertainty, we have M⊙.
It is important to consider whether the model that provides the best fit to the near-IR data is also consistent with the higher spatial resolution STIS data. Having taken into account the different instrument setup (psf, slit, pixel scale) for the STIS observations, in Figure 9 we compare the radial velocity measurements derived from the four viable STIS slit positions with the predictions of the best fit near-IR model. It is clear that, while the model provides a good fit to the slit 1 and slit 2 data, the slit 3 and 4 data show a large redshift with respect to the model. Therefore, assuming that the Pa and [OIII] sample the gas kinematics in the same disk with the same geometry, this reinforces the conclusion that the [OIII] measurements along slits 3 and 4 are affected by non-circular motions (section 5.1).
Figure 10 shows a more detailed comparison between the slit 1 and 2 results and model predictions for MDO masses in the range . It is clear from this that the data are bracketed by the predictions of the 1109 and 6109 M⊙ models, and are best fitted by the 2.5109 M⊙ model.


We also fitted all four slit positions of the STIS data allowing both the PA of the line of nodes and the mass of the black hole to vary. In this case we found that the best fit to the [OIII] data for all four slit positions modelled together was obtained for an MDO of mass 1010 M⊙ with a position angle of the line of nodes of -45 degrees. Clearly this model is inconsistent with the near-IR data, and also fails to fit the data from all four STIS slit positions adequately.
The fact that the model based on the fit to the near-IR data also provides an excellent fit to the slit 1 and 2 STIS/HST data suggests that extinction effects are not causing us to miss components of the disk with high projected radial velocities at optical wavelengths, thus strengthening the conclusions of section 4.3. Moreover, the steepness of the velocity gradient across the nucleus along slit 2 — the slit coincident with the infrared nucleus — demonstrates that the mass associated with the MDO must be confined to a radial distance from the kinematic centre of pc (corresponding to half the STIS spatial resolution i.e. 0.05 arcseconds).
5.3 Line width distributions
Previous studies provide evidence for an increase in line width towards the nucleus of Cygnus A (Tadhunter et al. 1994). This increase is also seen in the near-IR and optical data presented in this paper. In terms of understanding of the NLR kinematics in radio galaxies, it is important to consider the extent to which the large line widths are due to unresolved rotation about the central MDO, and the extent to which they are intrinsic.
The kinematic models presented above are based entirely on fits to the radial velocity curves. In order to determine the line width distributions from the best fit model we have assumed the line profile at each location in the rotating disk can be modelled with a Gaussian with an intrinsic that remains constant across the disk. The values of were chosen to provide the best fit to the line widths in the outer parts of the disk. Figures 11 and 12 compare the predicted line widths, based on the model that fits the radial velocity curves best, with the line widths measured from the data for the near-IR and optical data respectively. For the near-IR data an intrinsic km s-1 was assumed, whereas for the optical data km s-1 was assumed.


On the basis of this comparison we note the following.
-
•
Unresolved rotation. The large line widths cannot be solely due to unresolved rotation; there is a large intrinsic line width at all locations in inner disk ( arcseconds).
-
•
Gradients in the intrinsic line width. Based on the failure to fit the large line widths measured close to the nucleus in the near-IR data ( km s-1), and also the larger intrinsic linewidth required for the optical data closer to the nucleus ( km s-1), the intrisic linewidth must rise between the outer and inner parts of the circum-nuclear gas disk.
-
•
Larger scales ( arcseconds). For the near-IR data, the fact that significantly larger linewidths are measured at arcseconds along PA105 than on similar spatial scales along PA180, is likely to be a consequence of unresolved line splitting in the north west and south east cones, as detected in the optical data of Stockton et al. (1994) (Note: our measured line widths are based on single Gaussian fits to the line cores).
The cause of the large intrisic line widths close to the nucleus ( arcseconds) is currently uncertain. One possibility is that it is due to unresolved line splitting resulting from radial outflows in the near-nuclear regions. In this case, the flux in the redshifted component emitted by far side of the cone/disk would be required to have a similar flux to theblueshifted component emitted by the near side of the cone/disk, in order to avoid the large line shifts observed in slits 3 and 4 (see section 5.1).
Alternatively, the large line widths may be a consequence of a large, activity-induced turbulence at each location of the disk. For example, such turbulence could be generated by instabilities in the boundary layers between the warm gas in the walls of the hollowed out bi-cone and the outflowing hot wind and jets.
Finally, we must also consider the possibility that the large line widths are gravitationally-induced. For example, if the emission line structure comprises a collisionless system of cloudlets, it might be partially supported against gravity by the random motions of clouds on non-circular orbits (the so-called “asymmetric drift”). In this case, given that intrisic Gaussian velocity width () is comparable with the bulk circular velocity () throughout the inner disk (), the MDO mass we estimated above on the basis of the bulk circular motions alone would underestimate the true mass of the MDO. We note that the asymmetric drift is a controversial issue for gas dynamical estimates of black hole masses in general (e.g. van der Marel & van den Bosch 1998, Verdoes Kleijn et al. 2000, Barth et et al. 2001, Verdoes Kleijn et al. 2002). An argument against gravity-dominated line widths in the case of Cygnus A is that the lines are broad throughout the near-nuclear disk in the STIS/HST data, whereas they would be expected to be more strongly peaked towards the nucleus in the gravity-dominated case.
Overall, given the extreme level of nuclear activity present in this source, the large line widths measured across the core of Cygnus A are most likely be a consequence of local turbulence induced by the activity. In this case the circular velocities provide a true measure the MDO mass.
5.4 Contributions to the mass in the near-nuclear regions of Cygnus A
Based on our analysis of both the near-IR and optical data we have found evidence for M⊙ concentrated within a radial distance of 50pc from the dynamical centre of Cygnus A. This corresponds to a mean mass density of M⊙ pc-3. By itself this large central mass density does not imply that the MDO is a black hole. We now consider the possible contributions to the central mass.
The nuclei of radio galaxies are hosted by a massive stellar bulges. Therefore it is important to consider the contribution of stars to the mass in the central regions. Unfortunately, in the case of Cygnus A the stellar contribution cannot be measured directly because of the extinction due to the kpc-scale dust lane and circum-nuclear torus. Rather, we are forced to rely on extrapolations of the stellar mass density profile derived from the H-band imaging data, and comparisons with nearby inactive giant elliptical galaxies of similar absolute brightness. The extrapolation of the stellar density profile derived fitting the maximal Nuker-law profile (dashed line Figure 6) gives a mean stellar mass density of M⊙ pc-3 within the central 50pc of Cygnus A. In comparison, the nine galaxies from Faber et al. (1997) with absolute magnitudes similar to Cygnus A () have mean central mass densities within a similar radius in the range M⊙ pc-3. Therefore the mass density measured from the emission line kinematics in the core of Cygnus A is almost three orders of magnitude larger than the stellar mass density estimated from the H-band flux profile. It is also two orders of magnitude larger than typical mean stellar mass density estimated for giant elliptical galaxies of similar absolute brightness. On this basis we conclude that the large central mass in Cygnus A is unlikely to comprise normal stellar populations similar to those found in the cores of giant elliptical galaxies.
However, it is more difficult to rule out the idea that a compact star cluster close to the nucleus makes a significant contribution to the central mass. On the basis of the presence of the central obscuring torus and kpc-scale dust lane, it is clear that the central regions of of Cygnus A are gas rich. There is also direct evidence for recent star formation in the outer parts of the kpc-scale disk from optical HST imaging observations (Jackson et al. 1998, Fosbury et al. 1999). Therefore it remains a possibility that a massive star cluster has formed recently the high density central regions of Cygnus A, and that this nuclear star cluster contributes to the large mass density within a radius of 50pc. Using the results of isochrone spectral synthesis models we find that the optical luminosity of a M⊙ cluster would not be competitive with that of the quasar nucleus in Cygnus A () unless the cluster was very young and the starburst instantaneous (the Bruzual and Charlot 1996 models predict for age 100 Myr and starburst mass M⊙). Therefore, it may be relatively difficult to detect such a star cluster, especially if it is hidden from our direct view at optical and infrared wavelengths by the material in the torus.
We must also consider whether warm or cold gas can make a significant contribution to the total mass density close to the nucleus. On this scale it is likely that the dominant gas mass is contributed by the circum-nuclear torus that obscures the quasar nucleus from our direct view at optical wavelengths. To estimate the mass of the torus we assume that it has a cylindrical geometry. In this case, for the estimated opening half-angle of the ionization cones (), the total thickness of the torus is , where is the radius of its inner face. If we make the futher assumption that the X-ray absorbing column () is representative of the mean column depth through the torus in the direction perpendicular to the torus axis, the mass of the torus is given by:
| (4) |
where is the mass of a proton, and is the outer radius of the torus. For a cone opening half angle of degrees (Tadhunter et al. 1994, Jackson et al. 1998), an inner radius of the torus of cm (10pc) — (see discussion in Blanco et al. 1995, Maloney et al. 1995), an outer radius equal to the smallest radius sampled by our STIS data (i.e. pc), and an X-ray absorbing column of cm-2 (Young et al. 2002), we derive M⊙ — almost three orders of magnitude smaller than required by our dynamical estimate of the mass within 50pc. The torus would be more massive if the measured X-ray column substantially underestimates the mean column density of the gas of the torus. For example, our line of sight might pass through the low density outer layers in the torus, or the material in the torus might be clumpy and our line of sight might miss the higher density clumps. However, in order for the torus to contribute most of the mass within 50pc, the required column density in the higher density regions would be several orders of magnitude larger than the absorbing column sampled along our line of sight.
In view of the possible — if not likely — contribution of stars and gas to the mass in the nuclear regions, strictly the mass we have measured within 50pc is an upper limit on the mass of the nuclear black hole. On the other hand, if the near-nuclear disk is partially supported by the non-circular, gravitationally-induced motions of cloudlets (see section 5.3), the mass estimate based on the bulk circular velocities alone (section 5.2) underestimates the total mass within 50pc. In the following we will assume that the mass within 50pc, as estimated from the bulk circular velocities, is an accurate reflection of the mass of the nuclear black hole.
5.5 Black hole mass and host galaxy properties
With an estimate of the black hole mass in Cygnus A we are now in a position to discuss the links between the black hole and host galaxy properties. Some basic data for Cygnus A, its AGNand its host galaxy are listed in Table 2.
| Property | M87 | References | Cygnus A | References |
| Host Galaxy and Environment | ||||
| Absolute magnitude () | -23.16 | [2] | -23.34 | [3] |
| Environment | Cluster | Cluster | ||
| Radio Source and AGN | ||||
| Radio morphology | FRI | FRII | ||
| Radio power at 6cm () | (W Hz-1) | [4] | (W Hz-1) | [4] |
| Black hole mass () | M⊙ | [5] | M⊙ | [1] |
| AGN Bolometric luminosity | (erg s-1) | [6] | – (erg s-1) | [1] |
| Eddington luminosity () | (erg s-1) | [1] | (erg s-1) | [1] |
| Eddington ratio () | [6] | ( – ) | [1] | |
| Mass accretion rate (ṁ) | [6] | ( – ) | [1] |
First we note that the estimated mass of the black hole and R-band absolute luminosity of the host galaxy of Cygnus A are consistent with the correlations between black hole mass and bulge luminosity deduced for normal (non-active) galaxies. Based on the measured absolute R-band luminosity of the host galaxy, the relationship between black hole mass and bulge liuminosity derived by McClure & Dunlop (2002) for inactive elliptical galaxies predicts a black hole mass of M⊙ for Cygnus A. Given the uncertainties, this is consistent with our dynamical estimate of the mass of the black hole in Cygnus A. Therefore, the mass of the black hole is about what one would expect on the basis of its stellar bulge luminosity; the extraordinary level of activity in Cygnus A cannot be explained in terms of accretion onto an unusually massive black hole.
Unfortunately, because of the potential contamination of its stellar absorption lines by emission lines, it is less certain whether Cygnus A is consistent with black hole mass versus stellar velocity dispersion correlation deduced for non-active galaxies (Gebhart et al. 2000, Ferrarese & Merritt 2000, Tremaine et al. 2002). Using the stellar velocity dispersion measured by Thornton et al. (1999: km s-1) along with the best fit vs. relationship from Tremaine et al. (2002), the predicted black hole mass is M⊙. This is consistent with, but somewhat lower than, our gas dynamical mass estimate. However, as discussed in section 4.3, the results of Thornton et al. are likely to be affected by the infilling of the stellar absoption lines by emission lines, and such infilling will lead to spuriously low and .
It is also interesting to compare our dynamical estimate for the mass of the black hole in Cygnus A with the virial mass estimate derived from the properties of the broad permitted lines detected in scattered light at both UV and optical wavelengths (Antonucci, Hurt & Kinney 1994, Ogle et al. 1997). Following Kaspi et al. (2000), the radius of the broad line region (BLR) in Cygnus A is 180 lt-days for erg s-1333We assume here that erg s-1 (see Kaspi et al. 2000).. Two broad line FWHM estimates are available in the literature: H(FWHM)26,000 km s-1 (Ogle et al. 1997) and MgII(FWHM)7,500 km s-1 (Antonucci et al. 1994). However, we regard the larger H linewidth derived from the spectropolarimetry observations of Ogle te al. (1997) as the more reliable, since it is based on two independent sets of spectropolarimetry data taken on either side of the nucleus; the larger linewidth estimate is also consistent with the FWHM measured in some broad line radio galaxies (BLRG) of comparable AGN brightness to Cygnus A (e.g. Osterbrock, Koski & Phillips 1976, Corbett et al. 2000). Substituting the H linewidth into the virial equation of Kaspi et al. (2000) gives M⊙. The fact that this is larger than our dynamical mass estimate implies that there is a non-gravitational (e.g. outflow) component to the BLR kinematics in nearby radio-loud AGN. Such non-gravitational kinematics are consistent with recent spectropolarimetry results for BLRG (Corbett et al. 2000); they also help to explain why, in the Seyfert 1 sample of McClure et al. (2001), the BLRG 3C390.3 has an unusually large virial black hole mass for its host luminosity. Clearly, some caution is required when using BLR properties to estimate the masses of the black holes in radio-loud AGN.
5.6 Implications for the nature of the AGN in Cygnus A
In terms of understanding the nature of the AGN in Cygnus A it is interesting to consider the accretion rate required to produce the observed level of nuclear activity. The estimate of the bolometric luminosity of the AGN in Table 2 was derived from the measured X-ray luminosity of the core using the spectral energy distributions of radio-loud quasars presented by Elvis et al. (1994). This luminosity implies that that the mass accretion rate is a few percent of that required to produce the Eddington luminosity (i.e. ṁ ), assuming a constant efficiency factor.
For comparison we also include data for the nearby low-luminosity, FRI radio galaxy – M87 – in Table 2. The comparison with M87 is particularly interesting, because the mass deduced for the black hole in M87 is similar to that determined for Cygnus A; its absolute magnitude and environment are also similar. What distinguishes M87 from Cygnus A is that its AGN is two to three orders of magnitude less luminous overall, and its radio jets and lobes are three orders of magnitude less powerful. A further difference is that, whereas a broad-line quasar nucleus has been detected in spectropolarimetric observations of Cygnus A (Ogle et al. 1997), no such broad line nucleus has so far been detected in M87.
Given the similarity in their black hole masses, it is likely that the differences between M87 and Cygnus A are related to some property other than black hole mass. Most plausibly this property is the mass accretion rate, which is likely to influence the type of accretion and the radiative efficiency of the accretion process (e.g. Reynolds et al. 1996). The overall properties of the AGN in M87 can be modelled in terms of a low efficiency advective accretion flow if the black hole is accreting at the Bondi accretion rate (Reynolds et al. 1996), whereas those of Cygnus A are entirely consistent with accretion via a standard, geometrically thin accretion disk at much higher efficiency. In this context it is interesting that the Bondi accretion rate deduced for M87 is only an order of magnitude less than the accretion rate deduced for Cygnus A. This suggests that, if the mode of accretion (e.g. whether advective, or standard accretion disk) is dictated mainly by the mass accretion, the switch between the two modes occurs over a relatively narrow range of mass accretion rate: somewhere in the range ṁ .
5.7 Non-circular motions in the NW cone
An interesting aspect of the STIS/HST observations is that a component of gas in the NW cone (slits 3 and 4) does not fit in with the overall rotation pattern deduced for the emission like gas from the other STIS data and the near-IR observations. We now consider the nature of these non-circular motions.
One possibility is that the non-circular motions are associated with a cloud that is falling through the NW cone on a highly elliptical, near-radial path. For example, the cloud could represent material that has condensed out of the large-scale cooling flow but has not yet settled into the circum-nuclear dust lane. This possibility is difficult to rule out, given that warm/cool material could be continually falling into the nuclear regions from the large scale cooling flow that has been deduced from X-ray observations. Even in the case of the gas originating in a galaxy merger or encounter, it is possible that clouds will fall into the nuclear regions on near radial orbits until all the gas finally relaxes into a stable configuration. It is also notable that a HI 21cm absorption line feature is detected against the radio core that is redshifted relative to the galaxy rest frame ( km s-1: Conway & Blanco 1995, see Table 1) — a clear sign that at least some material is falling in towards the nucleus. However, in the context of this explanation, it seems remarkable that the redshifted component detected in the STIS data is observed so close to the axis of the cones and the large-scale radio jets, and also that it appears to show evidence for differential “rotation” in the same sense as the gas closer to the nucleus and the large-scale dust lane.
Alternatively, the redshifted component may represent line emission from gas that is undergoing a systematic radial outflow from the nucleus. Indirect evidence for outflows in the near-nuclear regions of Cygnus A is provided by the hollowing out of the cones apparent in high resolution near-IR HST images of the core (Tadhunter et al. 1999). Several independent lines of evidence suggest that the cone axes are tilted relative to the plane of the sky and that the NW cone is in the foreground and the SE cone is in the background of the circum-nuclear dust lane. In this case, in order to produce a NW redshifted component with an outflow, the material must be flowing away on the far side of the NW cone. Then, given that the NW cone is tilted towards the observer, the de-projected radial velocities of the outflow would be much larger than measured. Note that, for us to observe significant line emission from the far side of the cone, the extinction due to dust in the cone must be relatively small. It may also be of concern that there is no evidence close to the nucleus for a blueshifted component associated with outflowing material on the near side of the cone (expected to be less highly extinguished).
The geometrical constraints associated with the outflow model are less stringent if we are observing line radiation scattered by an outflowing wind, rather than direct line radiation from the outflow itself. In this case, provided that the axis of the cone is not too close to our line of sight, light scattered from outflowing material filling the NW cone will produce a redshifted feature. The scattering outflow idea is supported by the fact that polarized, redshifted [OIII] lines have been detected in spectropolarimetry observations of Cygnus A (Ogle et al. 1997); at the position of the nucleus the polarized lines are redshifted by km s-1 (van Bemmel 2002) — close to the redshift of the component detected to the NW of the nucleus in our STIS data. The major uncertainty with this explanation is whether sufficient scattering dust could survive in the hostile environment of the NW cone, given that any gas associated with the dust must be relatively hot (K), in order to avoid the direct (local) emission line flux dominating over the scattered emission line flux.
6 Conclusions
Using high resolution optical and infrared spectroscopic observations we have shown that a component of the narrow line gas close to the nucleus of Cygnus A is undergoing rotation about an axis that is close to perpendicular to the radio axis. We also find evidence for turbulent broadening of the emission lines close to the nucleus, as well as non-circular motions and outflows in the NW cone.
The amplitude and gradient of the rotation curve close to the nucleus imply a mass of M⊙, and a mass density of M⊙ pc-3, within 50pc of the nucleus. This mass density is orders of magnitude larger than the stellar mass densities measured on the same scale in the giant elliptical galaxies of similar absolute luminosity to Cygnus A (e.g. Faber et al. 1997).
If we associate the large central mass with a supermassive black hole, we conclude that there is nothing unusual about the mass of the black hole in Cygnus A; the mass is entirely consistent with the absolute brightness of the host galaxy, given the global correlations between black hole mass and host galaxy luminosity derived for non-active galaxies (McClure & Dunlop 2002). Therefore, extreme radio loudness and prodigious quasar-like nuclear activity are unlikely to be solely a consequence of the large absolute masses of the central black holes. It is probable that other factors, such as the mass accretion rate, are at least as important as black hole mass in determining the nature and power of the nuclear activity in galaxies.
Whereas the large rotational amplitude close to the nucleus supports the black hole paradigm for powerful active nuclei, the radial outflows detected in the NW cone bear witness to the type of AGN-induced feedback mechanisms which may have limited the growth of both the nuclear black holes and the galaxy bulges in the early universe. Indeed, there have been suggestions that such feedback leads to the correlations between black hole mass and global galaxy properties deduced for nearby inactive galaxies (Silk & Rees 1998, Fabian 1999).
To our knowledge this is the first attempt to make a direct, dynamical estimate for the mass of the black hole in a source harbouring a luminous, quasar-like AGN. In terms of the feasibility of making future direct mass estimates of the black holes in other powerful AGN, it is clear from this study that it is important to undertake complete velocity mapping of the near-nuclear regions at high spatial resolution in order to distinguish between gravitational and activity-induced gas motions.
Acknowledgments
Based on observations with the NASA/ESA Hubble Space Telescope, obtained at the Space Telescope Science Institute, which is operated by the Association of Universities for Research in Astronomy (AURA), Inc., under NASA contract NAS5-26555. The W.M. Keck Observatory is operated as a scientific partnership between the California Institute of Technology, the University of California, and the National Aeronautics and Space Administration. KAW and TR acknowledge financial support from PPARC. We thank the anonymous referee for useful suggestions.
References
- [1]
- [2] Antonucci, R.R.J., Hurt, T., Kinney, A., 1994, Nat, 371, 313
- [3]
- [4] Bach, U., Krichbaum, T.P., Alef, W., Witzel, A., Zensus, J.A., 2002. In: Proceedings of the 6th European VLBI Network Symposium, Ros, E., Porcas, R.W. & Zensus, J.A., in press (astro-ph/0207082)
- [5]
- [6] Barth, A.J., Sarzi, M., Rix, H-W., Ho, L.C., Filippenko, A.V., Sargent, W.L.W., 2001, ApJ, 555, 685
- [7]
- [8] Barthel P.D., 1989, ApJ, 336, 606
- [9]
- [10] Bower, G.A., et al., 1998, ApJ, 492, L111
- [11]
- [12] Carilli, C.L., Dreher, J.W., Conner, S., Perley, R.A., AJ, 98, 513
- [13]
- [14] Carilli C., Barthel, P.D., 1996, A&ARev, 7, 1
- [15]
- [16] Conway, J.E., Blanco, P.R., 1995, ApJ, L131
- [17]
- [18] Corbett, E.A., Robinson, A., Axon, D.J., Young, S., 2000, MNRAS, 319, 685
- [19]
- [20] Djorgovski S., Weir, N., Matthews, K., Graham, J.R., 1991, ApJ, 372, L67
- [21]
- [22] Elvis, M., Wilkes, B.J., McDowell, J.C., Green, R.F., Bechtold, J., Willner, S.P., Oey, M.S., polomski, E., Cutri, R., 1994, ApJS, 95, 68
- [23]
- [24] Faber, S.M., et al., 1997, AJ, 114, 1771
- [25]
- [26] Fabian, A.C., 1999, MNRAS, 308, L39
- [27]
- [28] Fosbury, R.A.E., et al., 1999. In: The KNAW Colloquium on the Most Distant Radio Galaxies, p311
- [29]
- [30] Franceschini, A., Vercellone, S., Fabian, A.C., 1998, MNRAS, 297, 817
- [31]
- [32] Gebhardt, K., et al., 2000, ApJ, 543, 5
- [33]
- [34] Ghisellini, G., Celotti, A., A&A, 379, L1
- [35]
- [36] Jackson N., Tadhunter, C., Sparks, B., 1998, MNRAS, 301, 131
- [37]
- [38] Kaspi, S., Smith, P.S., Netzer, H., Maoz, D., Jannuzi, B.T., Giveon, U., 2000, ApJ, 533, 631
- [39]
- [40] Kellerman, K.I., Pauliny-Toth, I.I.K., Williams, P.J.S., 1969, ApJ, 157, 1
- [41]
- [42] Krichbaum, T.P., Alef, W., Witzel, A., Zensus, J.A., Booth, R.S., Greve, A., Rogers, A.E., 1998, A&A, 329, 873
- [43]
- [44] Kormendy, J., Richstone, D., 1995, A&ARev, 33, 581
- [45]
- [46] Marconi, A., Axon, D.J., Macchetto, F.D., Capetti, A., Sparks, W.B., Crane, P., 1997, MNRAS, 289, L21
- [47]
- [48] Marconi, A., Capetti, A., Axon, D.J., Koekemoer, A., Macchetto, D., Schreier, E.J., 2001, ApJ, 549, 915
- [49]
- [50] Marconi, A., et al., 2002, ApJ, in press
- [51]
- [52] McLean, I.S, et al., 1998, SPIE, 3354, 566
- [53]
- [54] McLure, R.J., Dunlop, J.S., 2001, MNRAS, 327, 199
- [55]
- [56] McLure, R.J., Dunlop, J.S., 2002, MNRAS, 331, 795
- [57]
- [58] Ferrarese, L., Merritt, D., 2000, ApJ, 539, L9
- [59]
- [60] Ogle P.M., Cohen, M.H., Miller, J.S., Tran, H.D., Fosbury, R.A.E., Goodrich, R.W., 1997, ApJ, 482, L37
- [61]
- [62] Osterbrock, D.E., Koski, A.T., Phillips. M.M., 1976, ApJ, 206, 898
- [63]
- [64] Owen, F.N., Ledlow, M.J., Morrison, G.E., Hill, J.M., 1997, ApJ, 488, L15
- [65]
- [66] Reynolds, C.S., Di Matteo, T., Fabian, A.C., Hwang, U., Canizares, C.R., 1996, MNRAS, 283, L111
- [67]
- [68] Silk, J., Rees, M.J., 1998, A&A, 33, L1
- [69]
- [70] Simkin, S.M., 1977, ApJ, 217, 45
- [71]
- [72] Spinrad, H., Stauffer, J.R., 1982, MNRAS, 200, 153
- [73]
- [74] Stockton A., Ridgway S.E., Lilly, S., 1994, AJ, 108, 414
- [75]
- [76] Tadhunter C.N., 1991, MNRAS, 251, 46p
- [77]
- [78] Tadhunter C.N., Metz, S., Robinson, A., 1994, MNRAS, 268, 989
- [79]
- [80] Tadhunter C.N., Scarrott S.M., Rolph C.D., 1990, MNRAS, 246, 163
- [81]
- [82] Tadhunter C.N., Packham, C., Axon, D.J., Jackson, N.J., Hough, J.H., Robinson, A., Young, S., Sparks, W., 1999, ApJ, 512, L91
- [83]
- [84] Tadhunter, C.N., Sparks, W.B., Axon, D.J., Bergeron, L., Jackson, N.J., Packham, C., Hough, J.H., Robinson, A., Young, S., 2000, MNRAS, 313, L52
- [85]
- [86] Taylor, M., Tadhunter, C.N., Robinson, T.G., 2003, MNRAS, submitted
- [87]
- [88] Thornton, R.J., Stockton, A., Ridgway, S.E., 1999, ApJ, 118, 1461
- [89]
- [90] Tremaine, S., et al., 2002, ApJ, 574, 740
- [91]
- [92] Ueno S., Katsuji K., Minoru N., Yamauchi S., Ward M.J., 1994, ApJ, 431, L1
- [93]
- [94] van Bemmel, I., 2002, PhD Thesis, University of Groningen
- [95]
- [96] van der Marel, R.P., van den Bosch, F.C., 1998, AJ, 116, 2220
- [97]
- [98] Verdoes Kleijn, G.A., van der Marel, R., Carollo, C.M., de Zeeuw, P.T., 2000, AJm 120, 1221
- [99]
- [100] Verdoes Kleijn, G.A., van der Marel, R., de Zeeuw, P.T., Noel-Storr, J., Baum, S.A., 2002, AJ, 124, 2542
- [101]
- [102] Ward, M.J., Blanco P.R., Wilson A.S., Nishida M., 1991, ApJ, 382, 115
- [103]
- [104] Young, A.J., Wilson, A.S., Terashima, Y., Arnaud, K.A., Smith, D.A., 2002, ApJ, 564, 176
- [105]