Inverse Compton X–rays from the radio galaxy 3C 219
Abstract
We report the results from a Chandra observation of the powerful nearby (z=0.1744) radio galaxy 3C 219. We find evidence for non–thermal X–ray emission from the radio lobes which fits fairly well with a combination of inverse Compton scattering of Cosmic Microwave Background radiation and of nuclear photons with the relativistic electrons in the lobes. The comparison between radio synchrotron and IC emission yields a magnetic field strength significantly lower () than that calculated under minimum energy conditions; the source energetics is then dominated by the relativistic particles.
keywords:
Radiation mechanisms: non-thermal – Galaxies: active – Galaxies: individual: 3C 219 – Radio continuum: galaxies – X–rays: galaxies1 Introduction
It is well known that diffuse non–thermal X–ray emission from the radio lobes is a unique tool to constrain the spectrum and the energetics of the relativistic electrons and possibly the acceleration mechanisms at work in radio galaxies.
Diffuse X–rays from the lobes of radio galaxies and quasars are produced by inverse Compton (hereinafter IC) scattering of Cosmic Microwave Background (CMB) photons (e.g. Harris & Grindlay 1979), and/or nuclear photons (Brunetti, Setti & Comastri 1997). In the first case they are sampling the relativistic electrons with Lorentz factor 103, while the X–rays from IC scattering of the nuclear far–IR/optical photons are mainly powered by electrons whose synchrotron emission typically falls in the undetected hundred kHz frequency range.
Non–thermal X–ray emission from the radio lobes has been discovered by ROSAT and ASCA in a few nearby radio galaxies, namely Fornax A (Feigelson et al. 1995; Kaneda et al. 1995; Tashiro et al. 2001), Cen B (Tashiro et al. 1998), 3C 219 (Brunetti et al. 1999) and NGC 612 (Tashiro et al. 2000). The analysis of the spatially coincident X–ray and radio flux densities has allowed to estimate magnetic field strengths which are close, but on average lower than the values derived under equipartition conditions. However these results are affected by significant uncertainties arising from the low X–ray counting statistics in the diffuse component and the insufficient angular resolution of the instruments.
The superb capabilities of the Chandra X–ray observatory make now possible to image, on arcsec scale, the radio lobes of powerful radio galaxies and quasars and to disentangle the non–thermal emission from the thermal and from the nuclear component. Non–thermal emission from the radio lobes of relatively compact and powerful objects has been successfully detected with Chandra in the case of the radio galaxy 3C 295 (Brunetti et al., 2001) and, possibly, in a few high redshift radio galaxies (Carilli 2002), and in the counter lobes of the radio loud quasars 3C 207 (Brunetti et al. 2002) and 3C 179 (Sambruna et al. 2002). These observations are well interpreted as IC scattering of IR photons from the corresponding nuclear source, thus providing a clear evidence for the presence of low energy electrons ( 100) in the radio volumes. On the other hand, the detection of X–ray emission from the radio lobes of giant radio galaxies is best explained by IC scattering of the CMB photons (Hardcastle et al. 2002; Isobe et al. 2002; Grandi et al. 2002).
In this paper we report on the Chandra observation of the nearby, powerful, double–lobed FRII radio galaxy 3C 219. km s-1 Mpc-1 and are used throughout.
2 3C 219 and the radio data
The radio galaxy 3C 219 at =0.1744 is a prototype of the FR–II class
of powerful radio sources. Its projected angular size is about 180
arcsec (Clarke et al. 1992) corresponding to a projected liner size of
about 680 kpc. The optical counterpart of the nuclear radio source is a
cD galaxy with M (Taylor et al. 1996) in a non-Abell
cluster (Burbidge & Crowne 1979).
The radio structure is characterized by a relatively weak core, a
straight jet long (75 kpc) pointing towards the
SW, and a weak blob on the counterjet side. Two almost symmetric
hot-spots are present, the one in the south–west lobe being aligned
with the jet axis.
The two lobes account for most of the radio
emission at all frequencies below 15 GHz.
The overall radio spectrum is best fitted with a
slope 0.8 (S)
between 178 and 750 MHz (Laing et al. 1983)
which steepens to 1
above about 1 GHz (see Fig. 3).
By assuming the standard equipartition recipe,
which corresponds to integrate the synchrotron spectrum
between the fixed range of frequencies 10 MHz – 100 GHz (Pacholczyk 1970),
the magnetic field in
the lobes, considered as homogeneous emitting regions, is
7.6 G. If we assume instead that low energy electrons
down to are present, the magnetic field increases
to 10.4 G.
2.1 The VLA observations
The radio images at 1.4 GHz were obtained by combining archival VLA data:
A-configuration observations were carried out on May 18, 1986 for a
total integration of 6.5 hours, while B-configuration data were taken
on September 6, 1986 for a total of about 7 hours on source. The total
bandwidth is 25 MHz for each dataset. We carried out the data
reduction in a standard way by means of the NRAO Astronomical Image
Processing System (AIPS).
We first processed the B-configuration data, and then used the final
image to start the phase self-calibration of the shortest spacings of
the A-configuration data for which the source structure is
resolved out in the latter dataset.
Then we combined the A and B configuration observations and the final
image obtained has a resolution of 1.74 1.64 arcsec in
p.a. ; the off-source r.m.s. noise level in the image plane
is 40 Jy/beam. The total flux density accounted for 3C219 in our
image is 8.525 Jy.
A more detailed analysis of the radio data will be presented
elsewhere, where further VLA observations at various frequencies and
configurations will be discussed (Dallacasa et al. in preparation).
3 X–ray observations
3.1 Imaging
The target was placed at about 40” from the nominal aimpoint of the back illuminated ACIS S3 chip onboard Chandra and observed on 2000 October 11th. Although the observation was performed using a subarray configuration the nuclear source is affected by photon pile-up and will not be considered any further. The raw level 1 data were re–processed using the latest version 2.2 of the CXCDS CIAO software and filtered using a standard grade selection. There is evidence for an increased background count rate towards the end of the observation. The corresponding time intervals were filtered out leaving about 16.8 ksec of useful data. In order to study the morphology of the extended emission all the counts within a region of 5 arcsec radius centered on the nuclear source and those in the read–out streaks have been subtracted. The full band (0.5–7 keV) X–ray image smoothed with a fixed size gaussian (FWHM of 10′′) is reported in Fig. 1. The radio contours obtained from the 1.4 GHz radio image smoothed on the same scale are also overplotted.
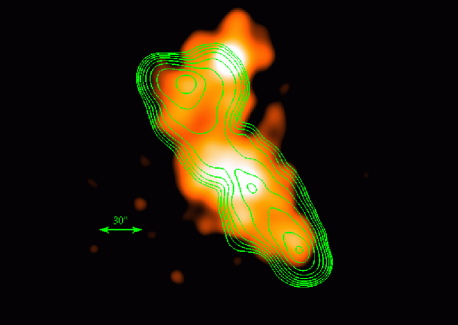
The detection of extended X–ray emission almost coincident with the radio lobes emission strongly favour the non–thermal IC nature for the high energy radiation as previously suggested by Brunetti et al. (1999) on the basis of lower resolution ROSAT HRI data.
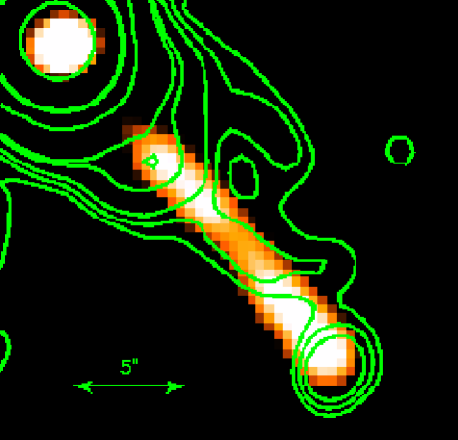
The bright clump at the boundary of the northern radio lobe is characterized by a soft X–ray spectrum and is most likely due to a previously unknow group of galaxies at z 0.4 (see section 3.2.3). The relatively faint diffuse emission coincident with the radio lobes shows a brightness increment in the innermost part of the northern lobe. Extended X–ray emission to the east from the nucleus not spatially coincident with the radio contours is also evident (Fig. 1). Finally, there is also a jetted X–ray emission at about 10–30 arcsec south of the nucleus which appears to be spatially coincident with the two radio knots of the main jet (Fig. 2).
3.2 Spectroscopy
Given that we are interested in the study of the origin of the faint diffuse X–ray emission from the radio lobes the background subtraction is an important issue.
In order to obtain the best estimate of the total background we rely on a technique which allows to significantly reduce the particle background for those observations carried out in the Very Faint Mode. 111 We have employed this technique (hereinafter VF) with the recommended choice of parameters. As a result the quiescent background is reduced up to 30% depending on the energy range. Source spectra have been extracted using appropriate response and effective area functions taking into account the source extension and weighing the detector response and effective area according to the source spectrum. The instrument response has been also corrected for the degradation in the ACIS quantum efficiency using the latest version of the ACISABS tool.
3.2.1 The lobes spectra
The Chandra spectrum of the entire extended emission (Fig. 3), including the jet knot, but excluding the background cluster (see below), is best fitted with a power law with plus Galactic absorption ( cm-2) fully consistent with the radio spectrum. The 0.5–7 keV flux of 2.4 10-13 erg cm-2 s-1 corresponds to a rest–frame luminosity of about 3 1043 erg s-1. Even though the counting statistics (about 570 net counts) does not allow to statistically discriminate between a power law and a thermal model the latter returns a slightly worse fit ( 3 for the same number of parameters) with a best fit temperature of about 4 keV (greater than 3 keV at the 90% confidence level). Besides the fact that the observed 0.5–7 keV luminosity is about an order of magnitude lower than that expected from the –T relation for clusters of galaxies (e.g., Arnaud & Evrard 1999), the observed morphology and the extremely good agreeement between the X–ray and radio spectral slopes strongly rules out a thermal origin for the diffuse X–rays.
In order to search for possible spectral differences between the northern and southern lobe (excluding the jet region) we have considered the X–ray spectra of the two regions separately. We find that the two regions have approximately the same spectral shape, which now is rather poorly constrained with a marginal indication of a slightly harder spectrum ( 0.25) in the southern lobe.

3.2.2 The jet knot
There is significant evidence of an excess of X–ray emission in the region coincident with the southern radio jet and in particular with the brightest knot (Fig. 2). Although only 12 net counts are detected in the 0.5–7 keV energy range, the band ratio H/S 2 (where H are the counts in the 2–7 keV and S in the 0.5–2 keV bands, respectively) folded through the ACIS–S spectral response corresponds to a power law spectrum with 0 or to an intrinsic absorption column density of about 1022 cm-2 if is assumed. However taking into account the errors associated with small numbers statistic (Gehrels 1986) the spectral slope could be as steep as (90 % confidence) and the absorption fully consistent with the Galactic value. A deeper exposure of 3C219 is needed to confirm the hardness of the X–ray jet and thus constrain the emission mechanism.
3.2.3 The background cluster
A R–band observation retrieved from the HST archive shows the presence of an excess of optical galaxy counts at the position of the north west clump, possibly indicating the presence of a cluster/group. We have obtained the spectrum of the most luminous galaxy of the group with the 3.5m Telescopio Nazionale Galileo (TNG) and identify it with an elliptical galaxy at =0.389. The X–ray spectrum of the north west clump (about 115 net counts) is well fitted by a thermal model with a relatively low temperature, keV plus Galactic absorption. The 0.5–2 keV flux is about 2 erg cm-2 s-1 and the corresponding luminosity is about 1.2 erg s-1 which is within a factor of of that expected from the –T relationship.
4 Discussion
The morphology and scale of the faint diffuse X–ray emission is very similar to that of the radio lobes thus suggesting a non–thermal mechanism due to IC scattering of CMB and nuclear photons. The latter would dominate at distances from the nucleus:
| (1) |
where is the isotropic nuclear luminosity in units of erg s-1 in the far–IR to optical band and is the cosine of the angle between the direction of the nuclear seed photons and the scattered photons (approximated with the angle between radio axis and line of sight with negative for the far lobe and positive for the near one). Since we detect diffuse X–ray emission coincident with the radio lobes out to a distance of 300 kpc from the nucleus with a roughly constant and symmetric brightness (Fig. 1), we conclude that the IC scattering of CMB photons is the process which accounts for the majority of the observed X–rays. In addition, we note the presence of enhanced X–ray brightness in the innermost 15–20 arcsec (projected size 70 kpc) of the northern (counter) lobe. Although the modest number of counts in this region does not allow to prove the non–thermal origin of this excess, we point out that it would be naturally explained by an additional contribution from IC scattering of nuclear photons which, indeed, is expected to be stronger in the counter lobe (Brunetti et al. 1997). In particular, assuming an angle between the radio axis and the plane of the sky of 30o (appropriate for one–sided jet FR II radio galaxies), Eq.(1) yields a far–IR to optical luminosity of the hidden quasar of erg s-1 which is only a factor of lower than that estimated by Brunetti et al. (1999) by making use of a quasar SED normalized to the nuclear X–ray flux. We stress that the present estimate does not depend on the energy densities of the electrons and of the magnetic field in the radio lobes.
From Fig. 1 the X–ray brightness distribution of the enhanced central region appears to be somewhat inclined toward north east with respect to the radio axis. Although we cannot exclude that thermal emission could be responsible for a fraction of the X–ray flux in this region, the observed misalignement indicates an offset between the radio axis and the axis of the pattern of the nuclear photons. We also note that this emission extends further on toward east than the radio pattern, while the diffuse X–ray emission in the lobes is generally well confined within the radio isophotes. This effect finds a straightforward explanation in the model of IC scattering of the nuclear photons because the X–rays from IC scattering of the nuclear photons are emitted by 100-300 electrons which have radiative life–times at least 10 times longer (depending on the importance of Coulomb losses) than the GHz radio emitting electrons. The oldest population of relativistic electrons in the radio lobes may not be visible anymore in the 1.4 GHz image but still sampled by the Chandra image. As an indication in favour of this possibility it should be noted that the 74 MHz radio observations, which sample electrons with lower energies ( 2000) than those synchrotron emitting at 1.4 GHz, also show a slightly larger extension of the radio lobes in the same region with respect to the higher frequency observations (Blundell, Kassim & Perley 2000). In addition, we note that the innermost radio contours in the northern lobe are asymmetric with respect to the radio axis and that they seem to trace a back flow which point in the direction of the X–ray brightness excess region.

The lobes broad band emission (Fig. 4) has been computed by assuming a relativistic electron spectrum with a slope . The corresponding synchrotron break () and high frequency cut–off are constrained by the radio data at 1010 and 1013 Hz respectively. The observed X–ray emission is accounted for by IC scattering of CMB photons if G. Such a value is a factor lower than that would be obtained with the standard equipartition formulae (e.g., Packolczyk, 1970) and about a factor 3.3 lower if the equipartition formulae are based on a reasonable choice 222We assume a ratio between protons and electron energy density and a filling factor of the low energy cut–off in the electron spectrum (; Brunetti et al. 1997). We have also tried to measure the magnetic field across the source by making use of the synchrotron and IC fluxes of both the southern and northern radio lobes. We obtain G and G for the northern and southern lobe, respectively. These values imply that, depending on the adopted equipartition formulae, the electron energy density is a factor 40–100 and 20–70 larger than that of the average magnetic field in the northern and southern radio lobes, respectively. We remind that the equipartition magnetic field strength would increase if the assumption on the and values are relaxed. These results confirm our previous findings (Brunetti et al. 1999) reached on the basis of ROSAT and ASCA data.
The departure from equipartition of 3C 219 is similar to that found in the lobes of other giant radio galaxies and quasars which emit X–rays via IC of CMB photons (e.g., Cen B, Tashiro et al. 1998; 3C 351, Hardcastle et al. 2002; 3C 452, Isobe et al. 2002; Pictor A, Grandi et al. 2003). On the other hand, despite the poor statistics, the lobes of smaller radio sources, where the effects of IC scattering of the nuclear photons dominates, seem to be closer to minimum energy conditions (e.g., 3C 295, 3C 207; Brunetti et al. 2001,2002). Finally the X–ray emission of 3C 219 does not appear to extend all the way to the end of the radio lobes (Fig. 1), possibly suggesting an amplification of the magnetic field in these external regions as also found in other IC/CMB radio galaxies (e.g., Cen B, Tashiro et al. 1998; 3C 452, Isobe et al. 2002).
5 Conclusions
The relatively short (16.8 ksec) Chandra observation of the radio galaxy 3C 219 has successfully detected diffuse X–ray emission from the radio lobes and X–rays associated with the main radio jet. The morphology, extension and spectrum of the diffuse emission strongly support a non–thermal origin, most likely IC scattering of CMB photons. In addition, the net brightness increment observed in the innermost kpc of the northern radio lobe (the far lobe) suggests an additional contribution from IC scattering of nuclear photons for a reasonable far–IR to optical isotropic luminosity of the hidden quasar of erg s-1. This implies that the electron spectrum extends to much lower energies (at least 100) than sampled by the radio emission.
From the distribution of the central X–ray emission we deduce that the radiation pattern of the hidden quasar (molecular torus axis) makes an angle of several tens degrees with the radio axis and that the oldes population of the relativistic electrons may occupy a much larger volume than indicated by the radio contours.
By comparing the radio synchrotron and IC emissions from the lobes we obtain an average magnetic field strength approximately a factor lower than the equipartition value.
Additional data from a deeper Chandra observation would allow to perform detailed, spatially resolved X–ray spectroscopy of the diffuse emission and to compute -field intensity structure and relativistic electrons’ distribution, if combined with the available radio data.
Finally, the relatively bright X–ray clump at north west on the border of the northern radio lobe (Fig.1) is well fitted by thermal emission from a relatively cold plasma ( keV) in a cluster/group of galaxies at .
6 Acknowledgments
This research has made use of the NASA/IPAC Extragalactic Database (NED) which is operated by the Jet Propulsion Laboratory, California Institute of Technology, under contract with the National Aeronautics and Space Administration. This letter is based on observations made with the Italian national telescope Galileo Galilei (TNG). We thank Cristian Vignali for a careful reading of the manuscript and the anonymous referee for the useful comments and suggestions. The authors acknowledge partial support by the ASI contracts I/R/113/01 and I/R/073/01 and the MURST grant Cofin–01–02–8773.
References
- (1) Arnaud, M., Evrard, A.E., 1999, MNRAS, 305, 631
- (2) Blundell, K., Kassim, N., Perley, R., 2000, in proceedings of IAU 199: “The Universe at Low Radio Frequencies” Pune, India (astro–ph/0004005)
- (3) Bridle, A.H., Perley, R.A., Henriksen, R.N., 1986, AJ, 92, 534
- (4) Brunetti, G., Setti, G., Comastri, A., 1997, A&A, 325, 898
- (5) Brunetti, G., Comastri, A., Setti, G., Feretti, L., 1999, A&A, 342, 57
- (6) Brunetti, G., Cappi, M., Setti, G., Feretti, L., Harris, D.E., 2001, A&A, 372, 755
- (7) Brunetti, G., Bondi, M., Comastri, A., Setti, G., 2002, A&A, 381, 795
- (8) Burbidge, G., Crowne, A.H., 1979, ApJS, 40, 583
- (9) Carilli, C.L., 2002, in proceedings of “Radio galaxies, past, present and future” Jarvis eds., Elsevier (astro–ph/0211482)
- (10) Clarke, D.A., Bridle, A.H., Burns, J.O., Perley, R.A., Norman M.L., 1992, ApJ, 385, 173
- (11) Feigelson, E.D., Laurent-Muehleisen, S.A., Kollgaard, R.I., Fomalont, E.B., 1995, ApJ, 449, L 149
- (12) Gehrels N., 1986, ApJ 303, 336.
- (13) Grandi, P., Guainazzi, M., Maraschi, L., Morganti, R., Fusco–Femiano, R., Fiocchi, M., Ballo, L., Tavecchio, F., 2002, ApJ in press (astro–ph/0211531)
- (14) Hardcastle M.J., Birkinshaw M., Cameron R.A., Harris D.E., Looney L.W., Worrall D.M., 2002, ApJ 581, 948
- (15) Harris, D.E., Grindlay, J. E., 1979, MNRAS, 188, 25
- (16) Isobe N., Tashiro M., Makishima K., Iyomoto N., Suzuki M., Murakami M.M., Mori M., Abe K., 2002 ApJ 580, L111
- (17) Kaneda, H., Tashiro, M., Ikebe, Y., et al., 1995, ApJ, 453, L13
- (18) Laing, R.A., Riley, J.M., Longair M.S., 1983, MNRAS 204, 151
- (19) Pacholczyk, A.G., 1970, Radio Astrophysics, Freeman Eds., San Francisco
- (20) Sambruna, R.M., Maraschi, L., Tavecchio, F., et al., 2002, ApJ in press; astro-ph/0201412
- (21) Tashiro, M., Kaneda, H., Makishima, K., et al., 1998, ApJ, 499, 713
- (22) Tashiro, M., Makishima, K., Kaneda, H., 2000, AdSpR, 25, 751
- (23) Tashiro, M., Makishima, K., Iyomoto, N., Isobe, N., Kaneda, H., 2001, ApJ, 546, L 19
- (24) Taylor, G.L., Dunlop, J.S., Hughes, D.H., Robson, E.I., 1996, MNRAS, 283, 930