11email: edelgado@ast.cam.ac.uk 22institutetext: Instituto de Astrofísica de Canarias, E-38200 La Laguna, Tenerife, Spain
22email: cmt@ll.iac.es, hdeeg@ll.iac.es 33institutetext: Laboratoire d’Astrophysique de Marseille, Traverse du Siphon - Les Trois Lucs, 13376 Marseille, France
33email: jorge.iglesias@astrsp-mrs.fr
Dwarfs after Mergers? The case of NGC 520, NGC 772, Arp 141, NGC 3226/7, NGC 3656 and Arp 299
We present results from a survey of dwarf galaxy candidates in the vicinity of strongly interacting galaxies. The goal of the survey was a test of the hypothesis that massive condensations of stars and HI in tidal tails of large interacting galaxies may be a significant source of independent, self-gravitating dwarf galaxies. These so called tidal dwarf galaxies (TDG) can be expected to resemble the blue luminous knots found in tidal tails, but also might appear as redder, evolved systems if formed much before they are being observed. For the present study, a homogeneous subsample of 6 fields was selected from the catalog of extended objects in fields around 15 strongly interacting galaxies by Deeg et al. (1998). Criteria for the subsample were: similar redshifts of the central interacting galaxies, and photometric completeness of the extended objects in V and R. The number density of these TDG candidates was compared with expected background galaxy densities. Within the statistical errors, background galaxies account for most, if not all of the extended objects. There is no evidence for a substantial locally formed dwarf galaxy population. Thus, we conclude that field galaxy-galaxy interactions are likely to result in the formation of only a few long-lived TDG.
Key Words.:
galaxies: interactions, galaxies: irregular, galaxies: dwarf, methods: statistical1 Introduction
Galaxy interactions provide strong clues about the structure and dynamics of galaxies, and a powerful mechanism for the origin of very massive central star formation events. Besides, the development of long tidal tails of stellar and gaseous material during the encounter, which can be observed and computed in numerical simulations, has posed the question of the fate of this tidally ejected material. Zwicky (1956) was the first to propose that some of this material might survive in the long term in the form of self-gravitating dwarf galaxies. Evidence in favor of this scenario for the origin of dwarfs comes from the identification of blue condensations in the tips of the tails of galaxy mergers with typical Hi masses ranging from to . Mirabel et al. (1992) and Duc et al. (1998) have shown that objects similar to dwarf irregulars or blue compacts are found in the tails. These small galaxies of tidal origin are potential progenitors of detached systems, namely, isolated dwarf galaxies (Sanders & Mirabel 1996, Braine et al. 2001).
Numerical simulations of interactions between disk galaxies show that tidal tails are the natural result of such processes (Barnes & Hernquist 1996). Also, if the interaction is strong enough, self-gravitating clumps of gas and stars are likely to form along the tails (Schweizer 1978). Several examples of stellar condensations at the tips of long tidal tails have been reported, like NGC 7252 (Hibbard et al. 1994), Arp 105 (Duc & Mirabel 1994) and Arp 245 (Duc et al. 2000). The possibility that these clumps become independent dwarf companions has been proposed by Barnes & Hernquist (1992) and Elmegreen et al. (1993). In addition, some material – both gaseous and stellar – is ejected from the disks of the parent galaxies, forming lower mass complexes that are probably not self-gravitating. It is expected that only the outermost ejected material may eventually abandon the potential well of the parent galaxy and form dwarf galaxies. The innermost material would slowly fall back to the parent galaxy. Given that the further out the material is, the longer is the time for return, dwarf objects in the surroundings of the interacting pairs would be expected for a long time, even well after the relaxation time. These self-gravitating condensations of stars and Hi, the so-called Tidal Dwarf Galaxies (henceforth TDG), would fade significantly in optical wavelengths in the Gyr that follows their formation, as soon as the gas is appreciably exhausted by the starburst (Weilbacher et al. 2000). In addition, tidal stripping from the parent galaxy may be in the long term a significant source of mass loss, thereby reducing the TDG to a very low surface brightness dwarf (Mayer et al. 2001). All these circumstances conspire to make genuine dwarf galaxies hard to detect, unless Hi cartography as well as spectroscopic surveys around mergers are performed.
In the present study we investigate if strong interactions between galaxies can produce a significant enhancement on the number of dwarf galaxies around the system. Lacking spectroscopic data, which are very difficult to obtain due to the faintness and small size of the large majority of TDG candidates, we choose to address this question statistically, by comparing the photometric sample of extended objects - or dwarf candidates- catalogued in the previous work of Deeg et al. (1998, hereafter Paper I) with background galaxy number counts. By doing so, we expect to include both young and evolved TDG, arriving at an estimate of the abundance of TDG formed by field interacting galaxies. From the fields around 15 interacting systems catalogued in Paper I, we have selected those fields that were observed in two filters ( and ), had a statistically significant number of detections of extended objects (EO), and in which the central galaxies have similar redshifts (five of the sample galaxies have vr between 2266 and 3132 km s-1, NGC 3226/7 is at 1151 km s-1). Thus, a subsample of fields around six galaxies – namely NGC 520, NGC 772, NGC 3226/7, NGC 3656, Arp 141 and Arp 299 - is analyzed in this paper. Among these, Arp 299 was observed in one filter only, but the high number of detections of EO in this field lead to its inclusion in this study.
In the following, we describe the observations and the detection procedure in Sect. 2. In Sect. 3, we outline the properties of known TDG within the framework of a dynamic evolution scenario and describe the statistical analysis that was performed in order to quantify the possible number of TDG. Conclusions are given in section Sect. 4.
2 Observations and Detection of Candidates
Images of the fields were taken in December 1992 with the 2.5m Isaac Newton Telescope at the Observatorio del Roque de los Muchachos, La Palma, with the EEV5 CCD-camera in prime focus, giving an effective field of about 10.5 and 0.55 pix-1 resolution. The observations took place in bright-grey time which affected the limiting magnitude. Atmospheric transparency conditions were very good and seeing ranged from 0.9 to 1.5 . Images were taken with the and Cousins filters, with exposure times as given in Table 1. In order to determine the stellar PSF, frames with short 20 s exposures were also taken, in which known bright field stars are not saturated. Landolt (1992) standards were observed for flux calibration.
| Galaxy | Type | vr | Gal. Size | tR | tV | Comm. | ||
|---|---|---|---|---|---|---|---|---|
| km s-1 | s | s | ||||||
| NGC 520 | 01:21:52 | 03:34:56 | S pec | 2266 | 1.90.7 | 300 | 600 | Arp 157 |
| NGC 772 | 01:56:26 | 18:45:05 | SA(s)b | 2472 | 7.24.3 | 300 | 500 | Arp 78 |
| Arp 141 | 07:08:12 | 73:33:56 | E | 2735 | – | 500 | 600 | – |
| NGC 3226/7 | 10:20:47 | 20:07:00 | E2:pec | 1151 | 3.22.8 | 600 | 600 | Arp 94 |
| NGC 3656 | 11:20:50 | 54:07:06 | (R’)I0:pec | 2860 | 1.61.6 | 600 | 600 | Arp 155 |
| Arp 299 | 11:25:42 | 58:50:14 | SBm pec | 3132 | 1.21.0 | 200 | – | NGC 3690 |
Table 1 lists relevant parameters of the target list and of the observations.
Raw images were zero-subtracted and flatfielded in the usual manner. The bias frame used was taken from averaging all bias frames in the observations. Also, global flatfields were obtained by averaging the individual sky flatfields taken at the entire observing run. This was possible, since the stability of the flatfields between nights was better than 1%. An absolute flux calibration was performed based on the observations of Landolt standards at different airmasses. The standards were measured using fixed-aperture photometry. For more details about observations, calibration procedure and classification methodology, see Paper I. A procedure was developed to identify objects over the background of the CCD frames, discriminating small galaxy-like objects and star-like objects (see the flow diagram in Paper I). Identified objects were then parameterized by the fitting of elliptical Gaussians, as is described later in the text. The total error in the photometric calibration is about 0.15 mag.
| Field | # EOs | # SOs | # amb. |
|---|---|---|---|
| NGC 520 | |||
| all | 85 | 150 | 44 |
| 45 | 70 | 17 | |
| NGC 772 | |||
| all | 119 | 209 | 68 |
| 84 | 98 | 27 | |
| Arp 141 | |||
| all | 183 | 623 | 109 |
| 76 | 301 | 27 | |
| NGC 3226/7 | |||
| all | 156 | 260 | 71 |
| 63 | 91 | 10 | |
| NGC 3656 | |||
| all | 257 | 510 | 152 |
| 76 | 72 | 16 | |
| Arp 299 | |||
| all | 116 | 181 | 74 |
| 81 | 76 | 25 |
Objects with a size close to the PSF were considered stellar (SO) whereas those with an extent of more than 1.3 times the PSF in either or direction were classified as extended (EO). Objects whose FWHM ranges between 1 and 1.3 times the PSF were classified as ambiguous. All saturated objects, also those having widths larger than the PSF, can safely be classified as stellar, too. Table 2 gives the number of EOs, SOs and ambiguous identifications found around the galaxies of the sample. The selection method used certainly does not exclude that the lists of galaxies still include some semi-resolved double or multiple stars. Also the lists of stars may contain a substantial number of galaxies with a near–stellar PSF. In galaxy–star separations done in a way comparable to ours, Metcalfe et al. (1991) found that later spectroscopy revealed 29% of the star–like objects to be compact galaxies, and 5% of the galaxy identifications turned out to be stars.
It might be argued that some of the detected objects are globular clusters formed during the interaction. In fact, Zepf & Ashman (1993) and Ashman & Zepf (1992) reported two-aged populations of globular clusters around merger remnant candidates. The colors of our objects would be compatible with those of typical globular clusters (Harris 1996), thus opening the possibility that they are globular clusters that had originated during the interaction. However, globular clusters should be detected as point-like sources at the distances of the interacting galaxies of our sample. In addition, only the faintest EOs in our sample would have luminosities comparable to those of globular clusters.
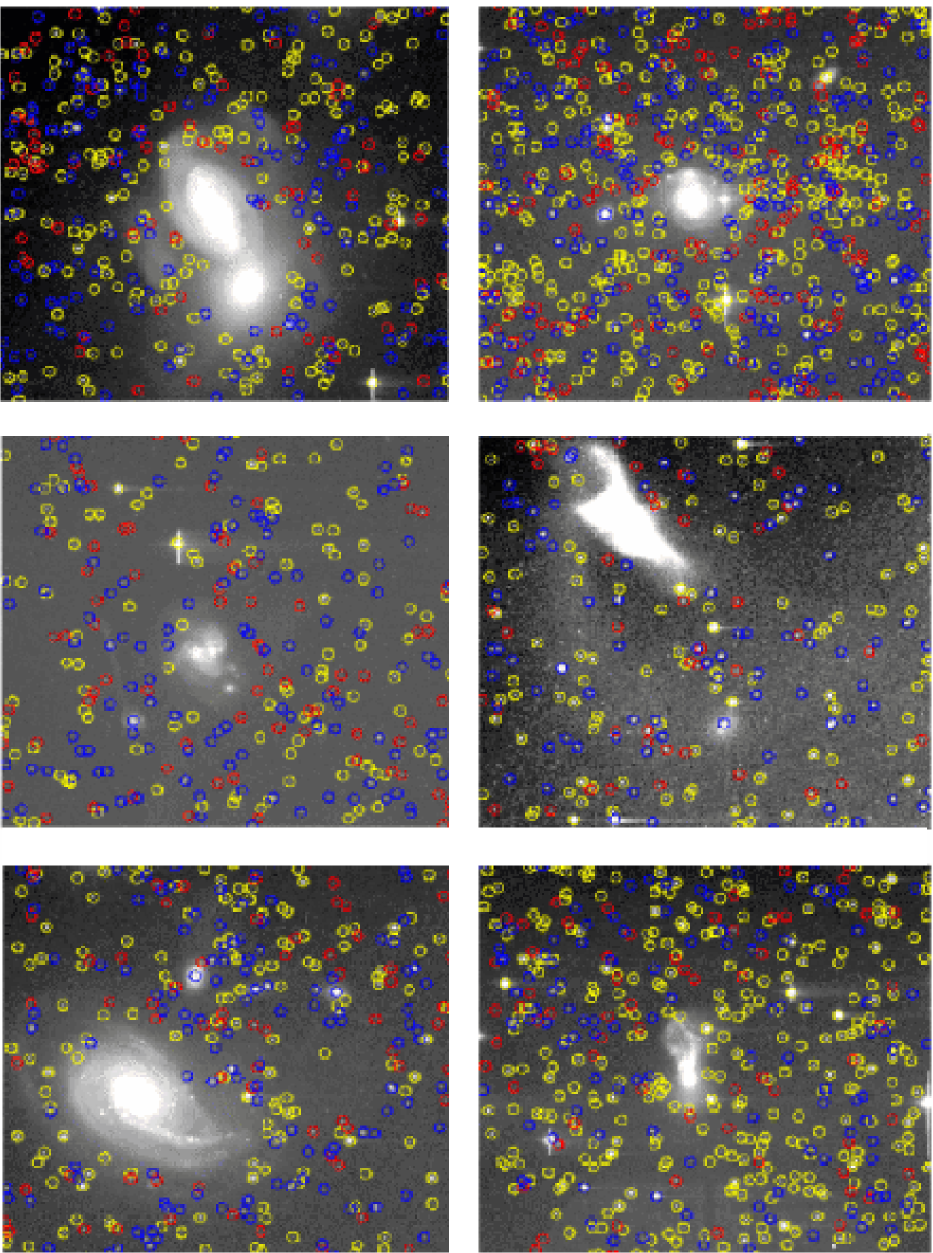
Figure 1 shows calibrated band images of the sample fields, in which the EO, SO and ambiguous objects that have been detected are marked. Below, we give some comments on the galaxy fields:
-
•
NGC 520: This is a gas rich system that is widely studied in the literature. An interesting multifrequency analysis of this interacting system can be found in Hibbard & van Gorkom (1996). Two dwarf objects with radial velocities similar to that of the parent galaxy, detected in both the optical and in Hi, are present in the neighborhood of the merger, and one of them (UGC957) appears permeated by the northern tidal tail of the system. This latter object might be the result of the interaction.
-
•
NGC 772: Clear disruption signatures can be found in the spiral arms of this galaxy, which are likely due to interactions with some of the satellites detected around it (see Zaritsky et al. 1997).
-
•
Arp 141 (UGC 3730): This is quite an irregular system with an optical extension towards the South. Burbidge & Burbidge (1959) attributed the peculiar nature of this interacting pair to the disruption of a spiral galaxy by an elliptical one in a close encounter.
-
•
NGC 3226/7: This peculiar system is composed by NGC 3226 and NGC 3227. The galaxies are embedded in an extended diffuse envelope. Hi was detected along the two plumes emerging from NGC 3227 (see Mundell et al. 1995).
-
•
NGC 3656: This shell galaxy was studied in detail by Balcells (1997). Two low surface brightness tidal tails were reported. At the tip of the western tidal tail, two dwarf galaxies were detected in broad band images. However, it is not certain that these objects are associated with NGC 3656.
-
•
Arp 299: This system consists of two interacting spiral galaxies, IC 649 and NGC 3690. Multi-wavelength HST observations of NGC 3690 highlight two massive star–forming condensations 3 kpc from the merger nucleus that might become detached dwarf galaxies (Alonso–Herrero et al. 2000). An Hi–rich tidal tail towards the North is apparent in larger optical frames. Surprisingly, no dwarf galaxies were detected along this tail (Hibbard & Yun, 1999).
3 Results
3.1 TDG properties and the collision process


TDGs, objects which are self-gravitating entities, formed out of the debris of a galactic gravitational interaction (Duc et al. 2000) are characterized by a luminosity comparable to that of typical dwarf galaxies, an extended morphology, high metallicity, and blue colors ( and ) as a result of an active starburst. These properties, however, have been outlined for objects found at the tip of the optical tails, some of them kinematically decoupled from the surrounding material but still visually embedded in the collision debris. On the other hand, more numerous ( TDG per collision) TDG candidates have been found, both in broad band optical images (Weilbacher et al. 2000) and in H emission (Iglesias-Páramo & Vílchez 2001), distributed all along the tidal features. However, it remains unclear whether these structures might become truly detached dwarfs in the future. How many TDG does an average merger form? Computer simulations of encounters between equal-mass disk galaxies (Barnes, private communication) show the formation of bound structures along the tidal tails, with a distribution of distances from the merger that is very broad and evolves with time as the tail expands. Only a few bound systems have masses above and they are located randomly throughout the tail, at an approximate mean distance of 100 kpc. Among these most massive self-gravitating structures, those with larger radii are the best candidates for becoming independent dwarf galaxies in the long term (Barnes & Hernquist 1992, Elmegreen et al. 1993). Most of the other bound structures would fall back to the central galaxy within a Gyr. One should however consider that in the case of interactions between unequal mass galaxies, the length of the tidal tail should be much smaller than in the case reported above. Correspondingly, dwarf candidates would be located much closer to the nuclei of the interacting pair.
One might imagine a dynamic scenario in which, depending on the nature (morphology, mass) of the galaxies involved in the collision and the stage at which the interaction is being observed, TDG do not necessarily have the properties observed in their young counterparts. TDGs could have formed, developed a massive starburst, and faded away, as well as decoupled from the main stream of merger debris – Weilbacher et al. 2002 reports on 7 knots along the tails of AM 1353 272 which could be moving away from the parent tidal stream with speeds as large as 100 km s-1. In such a picture, it would be possible to find TDGs without blue excess located well away from the tidal features, in numbers that would be hard to predict. Weilbacher et al. (2000) have computed the future luminosity evolution of the tidal knots detected in a sample of 10 interacting galaxies, assuming that a single starburst episode occurs. The colors become significantly bluer (at first mainly in ) once the burst commences, and redden again in the next Gyr, as the stars formed in the burst age. Therefore, TDGs around interacting galaxies may comprise a large population, perhaps hidden among background faint galaxies in the neighborhood of the interacting pair. A series of tests to assess this scenario was undertaken and is described in the next section.
3.2 Analysis

We have computed the number density distribution of EOs and SOs in each field (Fig. 2). This quantity has been used to look for a possible dependence of and with distance from the parent galaxies, whose center was taken as reference point (RP). Each CCD frame was divided in concentric rings around the RP. Only rings close to the center are completely present on the frames. To include rings further out, an area-normalization algorithm was employed that takes the irregular shapes of incomplete rings into account. Care was taken, through a revision of the flatfield frames, that vignetting is negligible, as it would cause lower detection limits far from the optical axis.

As can readily be seen, there is no clear evidence for a characteristic distance where EOs are preferentially appearing. Within the error bars, the density distributions are essentially flat. Note that the last bin includes the outermost EO detected near the edges of the CCD frames and their small numbers produce unreliable statistical averages. This result does not depend on color. In addition, as is expected for a random spatial distribution, EO and SO distributions do not show any statistically significant difference.
Figure 3 also shows the distribution (small points) of the radial distance of the detected EO as a function of the color index. The thick symbols stand for the average values over a given radial distance interval. Error bars correspond to the standard deviation. Overall, the averaged values are – within the error bars – independent of the distances to the central objects. Therefore, we conclude that the color distribution of EOs is fairly homogeneous, with no privileged position or distance in any of the studied fields.
Figure 4 shows the color index as a function of the magnitude for the EOs detected in all the frames. Crosses with error bars correspond to the averaged values per half unit magnitude and one standard deviation respectively. For comparison, we have over-plotted the mean values (filled circles) and standard deviation of the colors (dashed lines) for the photometric sample of background galaxies reported by Arnouts et al. (1997). As can be seen, both sets of averaged values agree very well with each other. There is therefore no indication for a foreground population with a distinct color.
Finally, the number of EOs in each field, in intervals of 0.5 magnitudes as well as over the entire magnitude range, was computed and compared with the number of expected background galaxies (Table 3). The purpose of the binning is twofold: first, it is required to compute the errors in the number counts consistently and, second, it allows us to search for possible excesses over background counts within specific magnitude ranges. The abundances of expected background galaxies were calculated from galaxy counts by Metcalfe et al (1991). Possibly, galaxy counts from observations of nearby blank fields might have added support to these results. However, due to the similarity between our star-separation procedure and the one used by Metcalfe et al. (1991 – both are based on a source size criterion) we are confident that this would not have changed the results significantly.
| N | Ne | dN | dN deg-2 mag-1 | deg-2 mag-1 | Nmax | |||
| NGC 520 | ||||||||
| 4 | 3 | 7 | 4 | -3 7 | -197 | 432 | 4 | |
| 5 | 2 | 4 | 1 | 1 3 | 63 | 194 | 4 | |
| 11 | 4 | 5 | 1 | 6 5 | 386 | 286 | 11 | |
| 10 | 2 | 11 | 3 | -1 5 | -34 | 286 | 4 | |
| 15 | 3 | 23 | 5 | -8 8 | -510 | 519 | 0 | |
| -5 13 | +8 | |||||||
| NGC 772 | ||||||||
| 12 | 7 | 6 | 4 | 6 11 | 387 | 744 | 17 | |
| 5 | 1 | 3 | 1 | 2 2 | 104 | 173 | 4 | |
| 17 | 5 | 4 | 1 | 13 6 | 892 | 438 | 19 | |
| 13 | 2 | 9 | 2 | 4 4 | 256 | 324 | 8 | |
| 18 | 3 | 21 | 5 | -3 8 | -178 | 574 | 5 | |
| 19 | 2 | 32 | 6 | -13 8 | -909 | 599 | 0 | |
| +9 17 | +26 | |||||||
| Arp 141 | ||||||||
| 6 | 4 | 7 | 4 | -1 8 | -65 | 503 | 7 | |
| 2 | 1 | 4 | 1 | -2 2 | -115 | 110 | 0 | |
| 9 | 3 | 4 | 1 | 5 4 | 282 | 254 | 9 | |
| 15 | 4 | 10 | 2 | 5 6 | 297 | 397 | 11 | |
| 16 | 3 | 23 | 5 | -7 8 | -420 | 541 | 1 | |
| 28 | 5 | 35 | 7 | -7 12 | -470 | 739 | 5 | |
| -7 18 | +11 | |||||||
| NGC 3226/7 | ||||||||
| 5 | 3 | 7 | 4 | -2 7 | -117 | 482 | 5 | |
| 4 | 1 | 4 | 2 | 0 3 | 18 | 172 | 3 | |
| 4 | 1 | 4 | 1 | 0 2 | -21 | 141 | 2 | |
| 10 | 3 | 10 | 2 | 0 5 | 5 | 323 | 5 | |
| 15 | 3 | 22 | 5 | -7 8 | -452 | 555 | 1 | |
| 25 | 5 | 34 | 6 | -9 11 | -607 | 731 | 2 | |
| -18 16 | -2 | |||||||
| NGC 3656 | ||||||||
| 8 | 5 | 7 | 4 | 1 9 | 60 | 564 | 10 | |
| 3 | 1 | 4 | 1 | -1 2 | -52 | 127 | 1 | |
| 7 | 2 | 4 | 1 | 3 3 | 157 | 197 | 6 | |
| 8 | 2 | 10 | 2 | -2 4 | -140 | 261 | 2 | |
| 21 | 5 | 23 | 5 | -2 10 | -107 | 637 | 8 | |
| 29 | 5 | 35 | 7 | -6 12 | -407 | 755 | 6 | |
| -7 19 | +12 | |||||||
| Arp 299 | ||||||||
| 8 | 5 | 7 | 4 | 1 9 | 60 | 564 | 10 | |
| 8 | 3 | 4 | 1 | 4 4 | 260 | 256 | 8 | |
| 4 | 1 | 5 | 1 | -1 2 | -30 | 113 | 1 | |
| 15 | 4 | 10 | 2 | 5 6 | 297 | 386 | 11 | |
| 19 | 4 | 23 | 5 | -4 9 | -232 | 584 | 5 | |
| 27 | 2 | 35 | 7 | -8 9 | -532 | 567 | 1 | |
| -3 17 | +14 | |||||||
Three factors contribute to uncertainties in the galaxy number counts: Poisson noise, the spatial distribution or clustering properties of galaxies, and the magnitude error. Following Roche et al. (1993), for a square field of side-length (degrees), with N galaxies observed in it and a two point angular correlation function amplitude A, the field-to-field variance in N is computed using:
| (1) |
where a power-law was assumed for (recent results agree very closely with this value; Connolly et al. 2002), and A has been obtained from Figs. 4 (B band) and 5 (R band) of Roche et al. (1993) (a conversion log(A(R))=log(A(B))0.5 was applied). These errors were calculated for both the detected (EOs) and the expected (Metcalfe’s) counts: and respectively, in Table 3. Systematic magnitude errors may also cause changes in the galaxy number counts. Such zero-point errors relate to galaxy count errors through the slope of the log[N(m)] distribution (see Huang et al. 1997 for details). In paper I, the uncertainty in the zero point is estimated to be 0.1 mag, a value that causes number count errors that are much smaller than the field-to-field variations. Metcalfe et al. also reports on a negligible contribution of the systematic magnitude error to the overall uncertainties.
Table 3 shows the probable number (dN) and maximum number (Nmax) of TDG candidates obtained by following the procedure described previously. We note that in some fields – NGC 520 and Arp 141 – there are a few more objects than expected from background counts, in bins 1-2 magnitudes brighter than the completeness limit (i.e. in the range R=18.5-19.0). NGC 772 shows a detection in the same range, but one deviation in a sample of 36 points would be expected just from Poisson statistics and therefore it is not statistically significant. The fact that no discrepancies are found when the total excess of observed counts over background counts is computed (over the entire magnitude range: last row in each field of Table 3.), indicates that the TDG population must be very small in comparison to background objects of comparable size and brightness. In other words, our results rule out that a typical galaxy merger forms 10 or more TDG. Individual cases may produce that quantity, but not more than a few – if any– TDG can be expected from a typical galaxy merger.
4 Conclusions
Our results do not support evidence for a significant population of dwarf galaxies around strongly interacting galaxies: the total probable number of TDG is a small negative number in all galaxy fields except NGC 772. In this latter field, only one magnitude bin shows a detection of TDG, which is statistically insignificant. Tidal condensations may turn into bound systems abundantly, but as self-gravitating, kinematically detached entities, we expect only a few TDG per collision to be formed. The value indicated by our results is 1 TDG per merger, although as many as 10 TDG cannot be ruled out in individual cases. For three of the fields – namely NGC 520, NGC 3226/7 and NGC 3656 – TDG candidates have previously been reported (see Balcells 1997; Hibbard & van Gorkom 1996; Mundell et al. 1995), but no more than two per interacting pair and always associated with tidal tails. This result is also consistent with previous Hi and optical observations of six interacting systems (van der Hulst 1979; Hibbard & van Gorkom 1993; Hibbard & van Gorkom 1996; Hibbard et al. 1994), where five dwarf galaxy candidates were reported.
Our results agree with simple theoretical models (Elmegreen et al. 1993), which predict that only the outermost material will gain enough angular momentum and energy to become an independent dwarf galaxy. Most of the bound features along tidal tails found in computer simulations (e.g. Barnes & Hernquist 1992) and a substantial fraction of the luminous condensations reported in the literature (e.g. Weilbacher et al. 2000) are therefore expected to be short-lived structures: truly self-gravitating dwarfs that are the result of galaxy mergers would not be frequent.
Acknowledgements.
The Isaac Newton Telescope is operated on the island of La Palma by the Royal Greenwich Observatory in the Spanish Observatorio del Roque de los Muchachos of the Instituto de Astrofísica de Canarias. This research has made use of the NASA/IPAC Extragalactic Database (NED) which is operated by the Jet Propulsion Laboratory, California Institute of Technology, under contract with the National Aeronautic and Space Administration. We thank our referee, J.E. Hibbard, whose valuable comments have certainly contributed to improve and clarify this paper. This work has been partially supported by the Spanish DGC (Grant No. AYA2001-3939). EDD is grateful to the European Union Research Training Network Program for its support.References
- (1) Alonso-Herrero A., Rieke G. H., Rieke M. J. & Scoville N. Z., 2000,ApJ, 532, 845
- (2) Arnouts S., Lapparent V. de, Mathez G. et al., 1997, A&AS, 124, 163
- (3) Ashman K.M. & Zepf S.E., 1992, ApJ, 384, 50
- (4) Balcells M., 1997, ApJ, 486, L87
- (5) Barnes J. E. & Hernquist L., 1992, Nature, 360, 715
- (6) Barnes J. E. & Hernquist L., 1996, ApJ, 471, 115
- (7) Braine J., Duc P.-A., Lisenfeld U. et al., 2001, A&A, 378, 51
- (8) Burbidge E.M. & Burbidge G.R., 1959, ApJ, 130, 12
- (9) Connolly A.J., Scranton R., Johnston D. et al., ApJ, 2002, 579, 42
- (10) Deeg H.J., Muñoz-Tuñón C., Tenorio-Tagle G. et al., 1998, A&AS, 129, 455 (Paper I)
- (11) Duc P.-A. & Mirabel I. F., 1994, BAAS, 26, 1499
- (12) Duc P.-A., Fritze-v. Alvensleben U. & Weilbacher P., 1998, The Magellanic Clouds and Other Dwarf Galaxies, ed. T. Richtler and J.M. Braun, Shaker (Verlag, Aachen)
- (13) Duc P.-A., Brinks E., Springel V. et al., 2000, AJ, 120, 1238
- (14) Elmegreen B.G., Kaufman M. & Thomasson M., 1993, ApJ, 412, 90
- (15) Harris W.E., 1996, AJ, 112, 1487
- (16) Hibbard J.E. & van Gorkom J.H., 1993, in ASP Conf. Series, 48, The Globular Cluster-Galaxy Connection, ed. G.H. Smith & J.P. Brodie (San Francisco: ASP), 619
- (17) Hibbard J.E., Guhathakurta P., van Gorkom J.H. & Schweizer F., 1994, AJ, 107, 67
- (18) Hibbard J.E. & van Gorkom J.H., 1996, AJ, 111, 655
- (19) Hibbard J.E. & Yun M.S., 1999, AJ, 118, 162
- (20) Huang J.-S., Cowie L.L., Gardner J.P. et al., 1997, ApJ, 476, 12
- (21) Iglesias-Páramo J. & Vílchez J.M., 2001, ApJ, 550, 204
- (22) Landolt A. U., 1992, AJ, 104, 340
- (23) Mayer L., Governato F., Colpi M. et al., 2001, ApJ, 559, 754
- (24) Metcalfe N., Shanks T., Fong R. & Jones L.R., 1991, MNRAS, 249, 498
- (25) Mirabel I.F., Dottori H. & Lutz D., 1992, A&A, 256, L19
- (26) Mundell C.G., Pedlar A., Axon D.J., Meaburn J. & Unger S.W., 1995, MNRAS, 277, 641, 654
- (27) Roche N., Shanks T., Metcalfe N. & Fong R., 1993, MNRAS, 263, 360
- (28) Sanders D. B. & Mirabel I. F., 1996, ARAA, Vol. 34.
- (29) Schweizer F., 1978, in The Structure and Properties of Nearby Galaxies, IAU Symposium No. 77, edited by E.M. Berkhuijsen and R. Wielebinski (Reidel, Dordrecht), p.279
- (30) Toomre A. & Toomre J., 1972, ApJ, 178, 623
- (31) van der Hulst J.M., 1979, A&A, 155, 151
- (32) Weilbacher P. M., Duc P.-A., Fritze von Alvensleben U., Martin P. & Fricke K. J., 2000, A&A, 358, 819
- (33) Weilbacher P. M., Fritze von Alvensleben U., Duc P.-A. & Fricke K. J., 2002, ApJ, 579, L79
- (34) Zaritsky D., Smith R., Frenk C. & White S.D.M., 1997, ApJ, 478, 39
- (35) Zepf S.E. & Ashman K.M., 1993, MNRAS, 264, 611
- (36) Zwicky, F., 1956, Ergebnisse der exakten Naturwissenschaften, 29, 34.