EVIDENCE FOR A CYCLOTRON FEATURE IN THE SPECTRUM OF THE ANOMALOUS X-RAY PULSAR 1RXS J170849400910
Abstract
We report the results of a long observation of the Anomalous X-ray Pulsar 1RXS J170849400910 obtained with the BeppoSAX satellite in August 2001. The best fit phase-averaged spectrum was an absorbed power law plus blackbody model, with photon index and a black body temperature of keV. We confirm the presence of significant spectral variations with the rotational phase of the pulsar. In the spectrum corresponding to the rising part of the pulse we found an absorption-like feature at keV (a significance of 4), most likely due to cyclotron resonant scattering. The centroid energy converts to a magnetic field of G and G in the case of electrons and protons, respectively. If confirmed, this would be the first detection of a cyclotron feature in the spectrum of an anomalous X-ray pulsar.
1 INTRODUCTION
Anomalous X-ray pulsars (AXPs) are characterized by spin periods in the range of 5-12 s, steady spin down (), steep and soft X–ray spectra with luminosities exceding by several orders of magnitude their spin–down luminosities (Mereghetti & Stella 1995; van Paradijs, Taam & van den Heuvel 1995). All five confirmed AXPs lie in the “galactic” plane and two (or three), are associated with supernova remnants. AXPs show no evidence for a companion and are thus believed to be isolated neutron stars either having extremely strong magnetic dipole fields (; “magnetars”; Duncan & Thompson 1992, Thompson & Duncan 1995) or accreting from a residual disk (Li 1999, Alpar 2001, Perna et al. 2000). Alternatively, they can accrete from a light companion. 1E 1048–5937 and 1E 2259+586, recently displayed short and intense X–ray bursts (Graviil, Kaspi, & Woods 2002; Kaspi & Graviil 2002), strengthening a possible connection between AXPs and Soft -Ray Repeaters (SGRs; Zhang 2002). For recent rewiews see Israel, Mereghetti & Stella 2002, Mereghetti et al. 2002, and references therein.
1RXS J170849400910 was discovered with ROSAT (Voges et al. 1996); 11 s pulsations were found in its X–ray flux with ASCA (Sugizaki et al. 1997). Early measurements suggested that is a fairly stable rotator (Israel et al. 1999). In October 1999 a sudden spin–up event occurred, which was interpreted as a glitch (Kaspi et al. 2000). Searches for an optical counterpart ruled out the presence of a massive companion (Israel et al. 1999); an IR counterpart has been recently proposed (Israel et al. 2003). The diffuse () radio emission at 1.4 GHz (Gaensler et al. 2001) is due to the supernova remnant G346.5–0.1, the association of which to the AXP is still under debate. There is no evidence of pulsed radio emission from the AXP with an upper limit of 70Jy on the pulsation amplitude (Israel et al. 2002).
Here we report the results of a long BeppoSAX observation of the AXP that confirms significant spectral variations with pulse phase (Israel et al. 2001) and shows the presence of an absorption-like feature at 8.1 keV, probably due to cyclotron resonant scattering.
2 OBSERVATION
The source was observed by BeppoSAX on 2001 August 17–22 with the imaging Narrow Field Instruments (NFI): the Low Energy Concentrator Spectrometer (LECS: 0.1–10 keV; Parmar et al. 1997; 78.0 ks of effective exposure time) and the Medium Energy Concentrator Spectrometer (MECS: 1.3–11 keV; Boella et al. 1997; 200.0 ks exposure). We extracted the source photons in the MECS and LECS from a circular region of 6 arcmin radius around the position of the AXP. Photons extracted from a sourceless circular region of the same size were used for background subtraction. MECS and LECS photon arrival times were corrected to the barycenter of the Solar System.
3 RESULTS
3.1 Timing and Spectral Analysis
In order to obtain a precise estimate of the pulse period, we divided the MECS observation in nine time intervals and calculated the pulsation phase for each of them. Fitting these phases with a linear function gave a best period of . The folded light curve shows an energy-dependent profile (Fig. 1). Specifically, the pulse minimum shifts from a phase of 0.0 in the lowest energy light curve (0.1–2 keV) to 0.3 in the 6–10 keV light curve. Correspondingly, the pulsed fraction decreases from 30 % to 17 %.
We restricted the analysis of the LECS and MECS spectra to the 0.4–4 keV and 1.65–10.8 keV energy range, respectively. The spectra were binned so as to have about two bins per spectral resolution element (FWHM). Futhermore, the data at the extremes of the spectral range given above were further rebinned so as to have at least 20 source events per bin (such that minimum chisquare techniques could be reliably used in spectral fitting).
The spectra were well fit with an absorbed blackbody plus a power law model (see Table 1). The best fit of the phase-average spectrum gave a reduced of 0.95 for 298 degree of freedom (dof) for the following parameters: column density of cm-2, a blackbody temperature of keV (blackbody radius of km, assuming a distance of 5 kpc) and a photon index of (all error bars in the text are 90 % confidence). The unabsorbed flux in the 0.5–10 keV range was erg cm-2 s-1 corresponding to a luminosity of 5.6 erg s-1 (for a 5 kpc distance). In the 0.5–10 keV band the blackbody component accounts for 30 % of the total unabsorbed flux. We also tried other combinations of spectral models (cutoff power law plus blackbody or two blackbodies with different temperatures) but they all produced larger reduced values.
3.2 Pulse Phase Spectroscopy
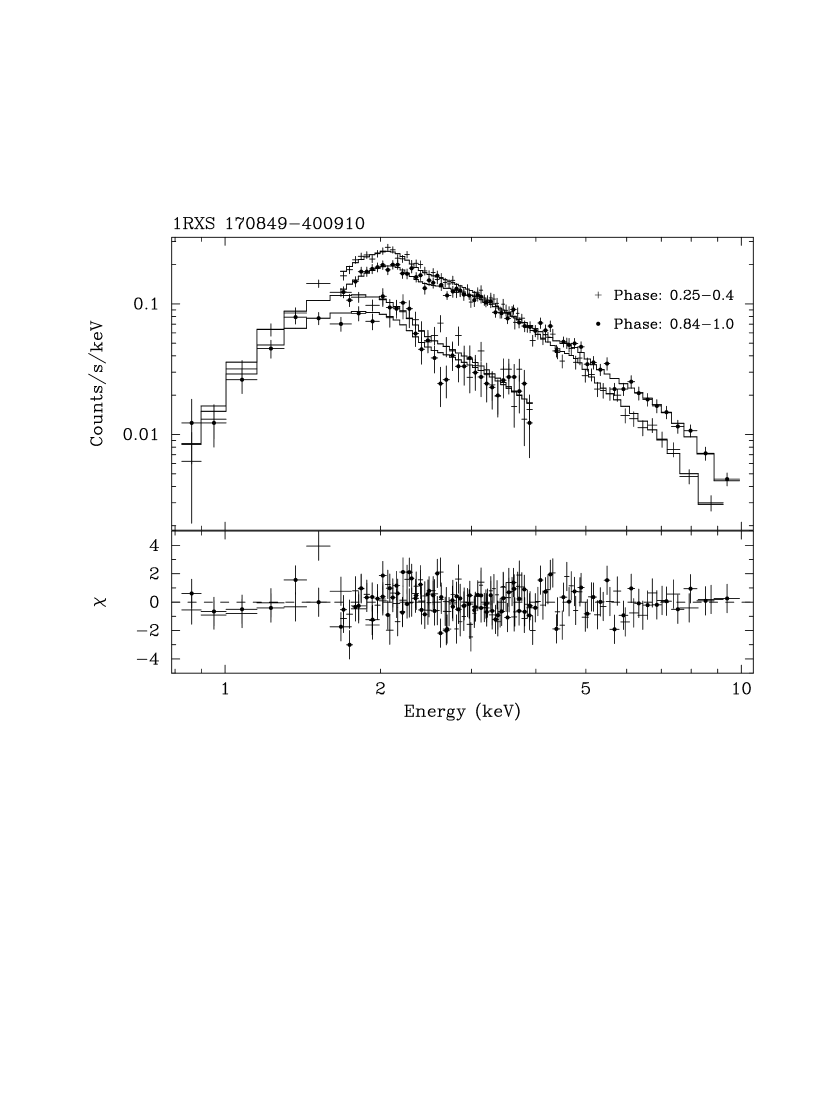
We adopt for zero phase the minimum of the pulse profile in the 0.2–3 keV folded light curve (see Fig. 1). In order to carry out pulse–phase spectroscopy we accumulated spectra in six different phase intervals. The boundaries of these (0.0, 0.26, 0.4, 0.58, 0.7, 0.84, 1.0) were designed so as to sample separately the minimum, rising, maximum, and decaying part of the pulse profile, while maintaining a sufficiently good statistics for a detailed spectral study (results in Tab. 1, Fig. 2, 3 and 4). A significant variation of the spectral parameters with pulse phase was clearly seen (especially for and , see Fig. 2; see also Israel et al. 2001). In all intervals but one, an acceptable fit was obtained with the absorbed power–law plus black body model (reduced in the 0.8–1.1 range); a reduced of 1.2 was instead obtained in the 0.4–0.58 phase interval. Specifically, the data were systematically below the best fit model in the 7.8–8.4 keV range (see Fig. 4b). We tried to fit three different models: a Gaussian, an absorption edge and a cyclotron feature. While the inclusion of a Gaussian or an absorption edge did not lead to a significant improvement of the fit, the cyclotron model (CYCLABS in the XSPEC package, see Mihara et al. 1990 for details) led to a reduced chisquare of 1.1 for 86 dof, corresponding to an F-test probability of (3.1).
In order to improve the statistics we added in phase the spectra from the 1999 BeppoSAX observation of the source (Israel et al. 2001), increasing the total exposure time to 250 ks. For this we used the pulse period determination from the timing solution of a 4 year–long RXTE monitoring (Kaspi et al. 2000) 111Note that we could not use for the 2001 dataset the post–“glitch” timing (Gavriil & Kaspi 2002) since the period extrapolated from their parameters significantly differs from that derived here ( s) . The determination of the zero phase was done again by using the pulse profile minimum in the 0.3–2 keV energy range (note that no significant shape difference was found with respect to the 2001 observation). We estimate that our procedure can introduce an uncertainty of up to 0.01 in the phasing of the two observations which is negligible for the aims of our study.
For each of the six phase intervals, a spectrum was summed together with the corrisponding spectrum from the 2001 observation. The spectral analysis was then repeated. In the MECS and LECS spectra from the 0.4–0.58 phase interval the inclusion of a Gaussian ( = 8.3 keV, = 0.4 keV and = 1.1) and an absorption edge ( = 7.7 keV, = 0.4 and = 0.9) to fit the feature at keV resulted in an improvement of the chisquare, which converted to a single-trial F-test probability of 0.18 () and ), respectively. A much more significant improvement was obtained by adding instead a Resonant Cyclotron Feature (RCF) model; the F-test probability in this case was corresponding to a single trial significance of 4.5 or 4 after correction for the six spectra that we analysed (see Fig. 4 and Tab 1).
4 DISCUSSION
During a BeppoSAX study of 1RXS J170849400910 we discovered an absorption-like feature at an energy of 8.1 keV in a pulse phase interval corresponding to the rising part of the 11 s pulse. This feature was best fit by a resonant cyclotron feature model with a centroid energy of 8.1 keV and an equivalent width of 460 eV.
The detection of an RCF in a specific pulse-phase interval and superposed to an X-ray continuum that varies with the pulse phase is reminiscent of the behaviour seen in standard accreting pulsars in X-ray binaries (see Wheaton et al. 1979, Santangelo et al. 1999). If interpreted as an electron resonant feature at the base of the accretion column, the feature at 8.1 keV implies a neutron star surface magnetic field of Gauss (using a gravitational redshift z=0.3) . This value is just slightly lower than that measured for electron RCFs in typical accreting X-ray pulsars (see Fig. 5); more interestingly it is close to that required by models for AXPs which involve residual disk accretion in the spin–down regime (Mereghetti & Stella 1995; Alpar 2001; Perna et al. 2001 ). In this context, one can solve the torque equation (see e.g. Eq. 11.35 in Henrichs 1983) by exploiting the measured value of and range of accretion luminosity derived from plausible distances (5–10 kpc). The surface magnetic (dipole) field obtained in this way is 0.6–1.1 G (corrisponding to a fastness parameter range of , a typical value for the spin-down accretion regime; see Ghosh & Lamb 1979 and Henrics 1983).
The agreement of this estimate with the magnetic field inferred from the electron RCF interpretation is intriguing, especially in consideration of the other analogies with the pulse-phase spectral dependence of conventional accreting X-ray pulsars. By contrast, if an electron RCF arose somehow at the polar caps of a rotation powered pulsar, a B–field strength of 9.2 G would be in the range of many radio pulsars and yet much lower than that required to spin–down at the observed rate through magnetic dipole radiation ( G, indeed this was one of the motivations for magnetar model, see below).
Alternatively the RCF might be due to protons. For the magnetic field strengths forseen in the “magnetar” scenario, proton cyclotron features (if any) are expected to lie in the classical X–ray band (0.1–10 keV; Zane et al. 2001; Lai & Ho 2002). A proton RCF feature at keV would correspond to surface field of 1.61015 G (z=0.3). The fact that this value is times higher than the surface field derived from the usual magnetic dipole spin down formula should not be of concern. According to the magnetar model, the magnetic field at the star surface and its vicinity is dominated by higher order multipole field components (Thompson & Duncan 1995). At large radii the dipole component, responsible for the secular spin–down, dominates. It is thus expected that a proton RCF feature, sampling the (total) surface magnetic field strength, provides a higher value than the mere dipole component.
There is a clear correlation between the width and centroid energy of the electron RCFs in accreting X–ray pulsars (see Fig. 5 extending the results of Orlandini & Dal Fiume 2001). The values from 1RXS J170849400910 and SGR 1806–20 are in good agreement with such a relation. The modest range of width to centroid energy ratio implied by this indicates that magnetic field geometry effects at the neutron star surface likely dominate the RCF width (on the contrary temperature and particle mass would alter this ratio). This, in turn, suggests that similar (relative) ranges of surface magnetic field strength are “sampled” by RCFs in accreting X–ray pulsar and, by extension, RCFs in AXPs and SGRs.
Other interpretations of the feature at keV appear less likely. Firstly, fitting an edge or line due to photo-electric absorption provides a less pronounced improvement of the fit than the RCF model. Secondly, an edge by iron at a sufficiently large distance from the neutron star that energy shifts are negligible would require a high overabundance of this element and intermediate ionisation stages (such as C–like iron). Yet it has long been known that the photoionisation equilibrium of such a plasma is unstable (Krolik & Kallman 1984; Nagase 1989). The energy of an ion feature forming in the neutron star atmosphere would be drastically altered by magnetic field effects (see Mori & Hailey 2002 and references therein). In this and the above interpretations, however, it would also be difficult to explain why an ion feature is observed only over a restricted range of pulse phases. Exploring in detail these possibilities is beyond the scope of this letter.
In conclusion, we found an absorption-like feature in the BeppoSAX X–ray spectrum of 1RXS J170849400910 taken during the rising phase of the 11 s pulse, which is best fit by a cyclotron resonant scattering model. If this interpretation is correct, the centroid energy translates into a magnetic field strength of 1.61015 G and 9.21011 G depending on whether protons or electrons, respectively, are responsible for the feature.
| Phase Intervals | |||
| Parameters | 0.4–0.58 | 0.84–1.0 | 0.26–0.4 |
| cm | |||
| PL flux (erg cm-2 s-1) | 21. | 8.3 | 24.8 |
| ( keV) | |||
| BB flux ( erg cm-2 s-1) | 9.1 | 5.1 | 6.1 |
| (d = 5 kpc; km) | |||
| ( keV) | … | … | |
| Line Width ( keV) | … | … | |
| Line Depth ( keV) | … | … | |
| 1.09 | 1.01 | 0.98 | |
| Flux ( erg cm-2 s-1) | 30.0 | 7.3 | 7.2 |


References
- (1) Alpar, M.A., 2001, ApJ, 554, 12-45
- (2) Boella, G., et al. 1997, A&AS, 122, 327
- (3) Duncan, R.C., & Thompson, C. 1992, ApJ, 392, L9
- (4) Gaensler, B.M., et al. 2000, MNRAS, Volume 318, Issue 1, pp.58-66
- (5) Ghosh, P., Lamb, F. K., 1979, ApJ, Part 1, vol. 234, p. 296-316
- (6) Graviil, F.P. & Kaspi, V.M. 2002, ApJ, 567, 1067G
- (7) Graviil, F.P., Kaspi V.M., & Woods, P.M. 2002, Nature, 419, 142G
- (8) Henrichs, H.F., 1983 Accretion-driven stellar X-ray sources P.419
- (9) Ibrahim, A.I., Swank, J.H., Parke, W. 2002, astro–ph, 0210515
- (10) Ibrahim, A.I., Safi-Harb, S., Swank, J.H., Parke, W., Zane, S., Turolla, R. 2002, ApJ, 574, L51
- (11) Israel, G.L., Covino, S., Stella, L., Campana, S., Haberl, F., Mereghetti, S. 1999, ApJ, 518, L107
- (12) Israel, G.L., Oosterbroek, T., Stella, L., Campana, S., Mereghetti, S., Parmar, A., 2001, ApJ, 560, L65
- (13) Israel, G.L., Mereghetti, S., & Stella, L. 2002a , in –Ray Bursts in the Afterglow Era, ed. S. Mereghetti & M. Feroci, Mem.S.A.It., Vol. 73, N. 2, pag. 465
- (14) Israel, G.L., et al. 2003, ApJ submitted
- (15) Kaspi, V.M., Lackey, J.R., Chakrabarty, D. 2000, ApJ, 537, L31
- (16) Kaspi, V.M., & Gravill, F.P., 2002, IAU Circ, No.7924
- (17) Krolik, J.H., & Kallman, T.R. 1984, ApJ, 286, 366K
- (18) Lai, D., & Ho, W.C.G., 2002, astro–ph 0211315
- (19) Li, X.-D., 1999, ApJ, 520, 271L
- (20) Mereghetti, S., & Stella, L. 1995, ApJ, 442, L17
- (21) Mereghetti, S., Chiarlone, L., Israel, G.L., Stella, L. 2002, MPE Rep, 278; Garching: MPE, 29
- (22) Mihara, T., et al., 1990, Nature, 346, 250M
- (23) Mori, K., & Hailey, C. J. 2002, ApJ, 564, 914
- (24) Nagase, F. 1989, PASJ, 41, 1-79
- (25) Orlandini & Dal Fiume 2001, AIP conference proceedings 1999, Vol.599 p.283
- (26) Parmar, A.N., et al. 1997, A&AS 122, 309
- (27) Perna, R., Heyl, J., Hernquist, L., Juette, A., Chakrabarty, D. 2001, ApJ, 557, 18P
- (28) Perna, R., et al., 2000, ApJ, 541, 344
- (29) Santangelo, A., et al., 1999, ApJ, 523, L85
- (30) Sugizaki, M., et al , 1997, PASJ, v.49, p.L25-L30
- (31) Thompson, C., & Duncan, R.C. 1995, MNRAS, 275, 255
- (32) van Paradijs, J., Taam, R.E., & van den Heuvel, E.P.J., 1995, A&A, 299, L41
- (33) Voges, W., et al. 1996, IAU Circ., 6420, 2 (1996). Edited by Green, D. W. E.
- (34) Wheaton, W.A., et al., 1979, Nature 282, p.240
- (35) Zane, S., Turolla, R., Stella, L., & Treves, A., 2001, ApJ, 560, 384
- (36) Zhang, B., 2002, astro-ph, 0212016