The Radio Structure of High-Energy Peaked BL Lacertae Objects
Abstract
We present VLA and first-epoch VLBA observations that are part of a program to study the parsec-scale radio structure of a sample of fifteen high-energy-peaked BL Lacs (HBLs). The sample was chosen to span the range of logarithmic X-ray to radio flux ratios observed in HBLs. As this is only the first epoch of observations, proper motions of jet components are not yet available; thus we consider only the structure and alignment of the parsec- and kiloparsec-scale jets. Like most low-energy-peaked BL Lacs (LBLs), our HBL sample shows parsec-scale, core-jet morphologies and compact, complex kiloparsec-scale morphologies. Some objects also show evidence for bending of the jet 10–20pc from the core, suggesting interaction of the jet with the surrounding medium. Whereas LBLs show a wide distribution of parsec- to kpc-scale jet misalignment angles, there is weak evidence that the jets in HBLs are more well-aligned, suggesting that HBL jets are either intrinsically straighter or are seen further off-axis than LBL jets.
Subject headings:
BL Lacertae Objects — AGN — Unification Models — VLBI1. Introduction
BL Lacertae Objects are an extreme type of Active Galactic Nuclei (AGN), whose hallmark is their “featureless” optical spectrum. By definition, any emission lines present must have rest Å; e.g., Stocke et al. (1991). BL Lacs are a member of the blazar class; and like other blazars, they are characterized by their rapid variability, polarized optical and radio emission and their flat-spectrum radio emission. See Urry & Padovani (1995) for an excellent summary of their properties.
Due to their luminous emission at these wavelengths, BL Lacs have been primarily discovered via X-ray and radio surveys; thus, traditionally they have been labeled as radio-selected and X-ray-selected (RBLs and XBLs respectively). In recent years this terminology has given way to a more physically meaningful classification based upon the overall spectral energy distribution (SED) of the object. In “low-energy-peaked” blazars (LBLs), the peak of the synchrotron radiation occurs at radio/IR wavelengths, whereas in “high-energy-peaked” blazars (HBLs) this peak occurs in the UV/X-ray. Historically, optical surveys have not been efficient in discovering BL Lacs (Fleming et al., 1993; Jannuzi, 1990). It is therefore not surprising that, until recently, known BL Lacs have shown a bimodal distribution of logarithmic X-ray to radio flux ratios, log() from 1 keV to 5 GHz, with an approximate dividing line defined by log() (Wurtz et al., 1996). For the most part XBLs are HBLs and RBLs are LBLs, although exceptions do exist (e.g., Mkn 501 is an HBL in the 1Jy RBL sample). We choose to use the term HBL when referring to the BL Lacs studied herein because all were chosen with a log() criterion.
New surveys, e.g., the ROSAT-Green Bank (RGB) survey (Laurent-Muehleisen et al., 1999) and the DXRBS survey (Perlman et al., 1998), have found BL Lacs with intermediate log() values, indicating a continuum of SEDs in BL Lacs and likely rendering the LBL/HBL terminology obsolete. The detailed properties of these new BL Lac objects with intermediate log() values are not yet well-known. So, although LBLs and HBLs have different observed properties (Urry & Padovani, 1995, and references therein), it is not yet known whether LBLs and HBLs are distinct classes of AGN or merely extremes of a continuum of properties for a single class of AGN. We have therefore chosen to include three intermediate objects from the RGB sample in our sample of study.
Most BL Lacs are believed to be low-power radio galaxies whose jet axes are oriented at small angles to the line of sight; and as such their jets are relativistically beamed, e.g., Orr & Browne (1982); Wardle et al. (1984); Urry & Padovani (1995). It has been proposed that HBLs and LBLs are both beamed, low-luminosity FR-I radio galaxies, and that the observed differences between the two classes is a result of orientation. In this unification model, hereafter the “orientation” model, HBLs are believed to be viewed further from the jet axis than LBLs (Jannuzi et al., 1994; Perlman & Stocke, 1994). The comparable X-ray luminosities for HBLs and LBLs require that either the beam pattern or physical jet opening angle for the X-ray emission is larger than than for the radio emission, e.g., Stocke (1989); Urry et al. (1991); Ghisellini et al. (1993); Celotti et al. (1993). Several observed properties are consistent with this hypothesis. Compared to LBLs, HBLs are more numerous, their cores are less radio luminous, and they are less optically variable (Jannuzi et al., 1993). HBLs also emit less compact radio emission (Perlman & Stocke, 1993, 1994; Laurent-Muehleisen et al., 1993), contain larger fractions of starlight in the optical (Morris et al., 1991), and have smaller degrees of optical polarization, often with a preferred optical polarization angle, (Jannuzi et al., 1994). However, several observed properties which should be independent of orientation, e.g., observed evolution, optical emission-line strengths and extended radio powers, do not agree between HBLs and LBLs, indicating that orientation alone is insufficient to explain the observed distinctions between the two classes (Rector & Stocke, 2001). In fact, many LBLs appear to be beamed, high-luminosity FR-IIs; and at least one is a gravitationally lensed object, the “smallest Einstein ring” object 1Jy 0218+357 (O’Dea et al., 1992). The picture seems to be more clear for HBLs, whose properties are very consistent with being beamed FR-Is (Rector et al., 2000). Several observations support this picture, e.g., extended radio luminosity and morphology (Antonucci & Ulvestad, 1985; Perlman & Stocke, 1993), host galaxy luminosity and morphology (Abraham et al., 1991; Wurtz et al., 1996), and comparative space densities and luminosity functions (Padovani & Urry, 1990; Morris et al., 1991).
Alternatively, it has also been suggested that the difference between LBLs and HBLs lies not in orientation, but in the high-energy cutoff in their energy distributions, such that HBLs and LBLs represent a single family of objects with a smooth energy distribution followed by a sharp cutoff. For LBLs this cutoff occurs in the near-IR/optical and for HBLs it is at UV/X-ray or higher energies (Giommi & Padovani, 1994; Padovani & Giommi, 1995; Sambruna et al., 1996). In this model, hereafter the “energy-cutoff” model, HBLs have intrinsically lower radio luminosities than LBLs, and strong selection effects explain why most known BL Lacs are of the HBL variety.
Observational studies of BL Lacs at radio wavelengths have proven to be an effective test of unification models for two reasons. First, the kpc-scale extended radio flux is likely unbeamed, and is therefore indicative of the actual AGN power; and second, the core and parsec-scale extended flux is highly beamed, and is therefore strongly dependent on the orientation and relativistic nature of the jet. If HBLs are seen further off axis than LBLs, radio images will reveal several distinct trends. First, relativistic Doppler boosting and apparent proper motion are strongly sensitive to the orientation angle and bulk Lorentz factor of the jet. Thus, if seen close to their jet axis, LBLs should be more core-dominated, show more instances of superluminal motion and have larger jet to counter-jet brightness ratios. And if HBLs and LBLs share the same parent population, both should have similar jet Lorentz factors. Second, geometrical projection effects will cause jets with intrinsically small bends to appear highly distorted when seen close to the line of sight. Thus, the projected jet position angle (PA) in these highly inclined objects is very sensitive to the jet structure. It is known that LBLs show a wide range of parsec- and kpc-scale jet misalignment angles ( ), presumably from a “knotty” or helical jet seen close to the line of sight (Kollgaard et al., 1992; Conway & Murphy, 1993; Appl et al., 1996). If HBLs are seen further off-axis than LBLs, geometrical projection effects will cause the parsec- and kpc-scale projected jet PAs of HBLs to be more aligned than LBLs.
If the “energy-cutoff” model is correct and there is no orientation bias, LBLs and HBLs should show similar parsec- and kpc-scale radio structure, similar distributions of parsec- and kpc-scale jet misalignment, assuming they share the same parent population. But since LBLs are generally more luminous than HBLs (Fossati et al., 1998), their parsec-scale structures may differ intrinsically from HBLs.
In this paper we present deep VLA and first-epoch VLBA observations of a sample of fifteen BL Lacs which span the full range of log() seen in HBLs (§2). These maps are used to compare the parsec and kpc-scale structure of these objects. In §3 we discuss the results of these observations, compare them to similar studies of LBLs and discuss their implications for unification models. As these are only the first epoch of observations, proper motions of jet components are not yet available; thus we consider only the alignment and structure of the parsec-scale jets. In §4 we present the conclusions.
2. Observation and Reduction
Due to their relative radio faintness, few HBLs have been studied with VLBI techniques. Kollgaard et al. (1996) presented images of four HBLs from the bright HEAO 1 survey (Schwartz et al., 1989), all of which have log() values close to the LBL/HBL boundary. Conway et al. (private comm.) completed VLBA observations of eight HBLs from the Einstein Medium Sensitivity Survey (Morris et al., 1991; Rector et al., 2000); however, parsec-scale extended structure was not detected in most of these objects, most likely due to their faintness ( mJy at 5 GHz).
In order to better determine the parsec-scale structure of HBLs, we completed deep VLA and VLBA observations of a sample of HBLs that covers a factor of 30 in log(). The initial goal was to determine their morphology and core dominance on VLBI scales as well as to measure the projected alignment of their parsec- and kpc-scale radio jets. At the time this project was begun, the availability of phase-reference calibrators for the VLBA was limited, so we chose only targets which were likely bright enough for self-calibration ( mJy at 4.964 GHz). Since HBLs are for the most part too radio faint to observe a statistically complete sample without phase referencing, we chose a sample that represented the full range of log() values observable in HBLs, as shown in Figure 1. Our sample was selected primarily from the Einstein “Slew” Survey (1ES; Perlman et al. (1996)). Objects that are LBL-like (i.e., log() ) were discarded. This sample was supplemented with three objects from the RGB BL Lac sample to fill in the log() distribution with objects intermediate to LBLs and HBLs. The final sample consists of fifteen HBLs with an even distribution of log() ranging from 6 to , and is compared to the complete 1Jy LBL sample in Figure 1.
A summary of the sample properties is given in Table 1. The columns are: [1] the object name; [2-3] the Right Ascension and Declination in J2000 coordinates; [4] the log() value (Perlman et al., 1996; Laurent-Muehleisen et al., 1999); and [5] the redshift (Laurent-Muehleisen et al., 1999; Perlman et al., 1999). The redshifts for 1ES 0647+250 and 1ES 1028+511 are marked with a colon because they are tentative.
2.1. VLBA Observations
Twelve BL Lacs in our sample were observed with the NRAO111The National Radio Astronomy Observatory is operated by Associated Universities, Inc., under cooperative agreement with the National Science Foundation. Very Long Baseline Array (VLBA) on 17 May 1997. We chose to observe at 4.964 GHz in order to obtain both high resolution and high sensitivity to maximize the probability of detecting and resolving faint VLBI jets in these compact objects. A single 24-hour time allocation was used with the complete VLBA array of 10 x 25m antennas. This allowed approximately twelve 6.5-minute scans per source, which were well-spaced in hour angle for optimal () plane coverage. To minimize potential phase and amplitude errors due to poor source positions in the correlator model, high-resolution “snapshots” were completed with the NRAO Very Large Array (VLA) B-array at 3.6cm prior to the VLBA observations to obtain core positions with 0.01″ accuracy. These are the positions given in Table 1. The data were initially calibrated with the AIPS software package in the standard manner. Self-calibration and imaging were then done with the DIFMAP software package (Shepherd, 1997). The resultant maps each have an RMS noise level of mJy beam-1. The three RGB sources in our sample were observed by Bondi et al. (2001) and Fey & Charlot (2000).
All of the objects except for 1ES 0647+250 and 1ES 1028+511 are clearly resolved; however these two objects do show evidence for very faint extended structure. In all sources 60% to 90% of the VLA core flux, as determined by snapshots in Perlman et al. (1996), was detected on parsec scales. All of the resolved objects show a core-jet morphology, as is typical of LBLs and core-dominated quasars (Pearson & Readhead, 1988). All are core dominated on parsec scales (). Some sources show a well-collimated jet with discrete components (e.g., 1ES 1741+196 and 1ES 1212+078), whereas others show a diffuse jet with a wide opening angle (°; e.g., 1ES 0806+524 and 1ES 1959+650). A map of 1E 1415+259 is not shown because its extended structure is too faint to be imaged. The peak component flux is of the order of the baseline noise (7 mJy), and baseline phase errors dominate the apparent morphology of the extended structure.
2.2. VLA Observations
Eleven BL Lacs in our sample were observed with the VLA on 10 October 1998. We chose to observe with the B-array at 1.425 GHz with a 50MHz bandwidth to maximize sensitivity to extended, steep-spectrum structure while achieving 4″ resolution. The B-array was chosen based upon the redshifts of the objects in our sample to avoid over-resolution of the extended structure. Three or four 8-minute scans, each bracketed by a 90–second scan on a primary VLA flux calibrator, were made for each source. Scans were spaced to optimize coverage in the plane. Objects which were sufficiently resolved in previous efforts (Laurent-Muehleisen et al., 1993; Perlman et al., 1996) were not reobserved here.
Epoch 1995.2 VLA values were used to flux calibrate the maps using multiple observations of 3C 286. Since these sources are highly core dominated, a point source model was assumed to start the self-calibration process. Phase-only self-calibration in decreasing solution time intervals was used for the first four iterations. Amplitude and phase self-calibration were then used until the maximum dynamic range was achieved, usually requiring only one or two more iterations. The AIPS task IMAGR was used to generate the maps and clean components. Robust weighting (ROBUST = 0.5) was used to achieve a smaller beam FWHM with only a 10–12% increase in noise over natural weighting; see Briggs (1995) for an explanation. The core flux densities were measured by fitting the core with a single Gaussian with the synthesized beam’s parameters. The extended flux was determined by measuring the total flux density with a box enclosing the entire source and then subtracting the core flux density. For unresolved sources, conservative upper limits on extended radio flux densities were calculated by assuming that each source has uniformly bright extended emission at the 1 detection level over a 3000 kpc2 area surrounding the core.
2.3. Summary of Radio Properties
The VLA and VLBA maps are shown in Figures 2 through 20. A summary of the radio properties is given in Table 2. The columns are: [1] the object name; [2-3] the 1.425 GHz VLA core and extended flux densities (mJy); [4] the VLA jet position angle [5-6] the 4.964 GHz VLBA core and extended flux densities (mJy); and [7] the VLBA jet position angle. The errors in the flux densities are 0.1 mJy beam-1 for both the VLA and VLBA maps. The cumulative errors in the extended flux densities depend upon the solid angular extent of the measured flux. Note that, as discussed in §3, measured jet position angles are subjective; and in most objects the jet morphology is more complex than what can be modeled with a single PA value. Thus the discussion of individual sources below should be consulted for each source.
2.4. Discussion of Individual Sources
1ES 0033+595: The VLBA map (Figure 2) shows a diffuse jet extending in PA = +65°. It is not clear whether or not the parsec-scale jet is well-collimated. There is some evidence for the jet curving to the north. Thus the measured PAkpc is likely resolution dependent. The VLA image (Figure 3) of this source shows a diffuse halo surrounding the core. Jets are not clearly resolved; however the core is elongated in the PA = ° and PA = ° directions, so the parsec- and kpc-scale jets appear to be well aligned if the parsec-scale jet is assumed to be related with the PA = ° extension of the VLA core. HST PC observations of this object shows two unresolved sources of similar brightness separated by 1.58″ (Scarpa et al., 1999), which might have been explained as multiple images of a gravitationally lensed system. However, the VLA astrometric observations presented here do not detect a second radio source, ruling out that possibility.
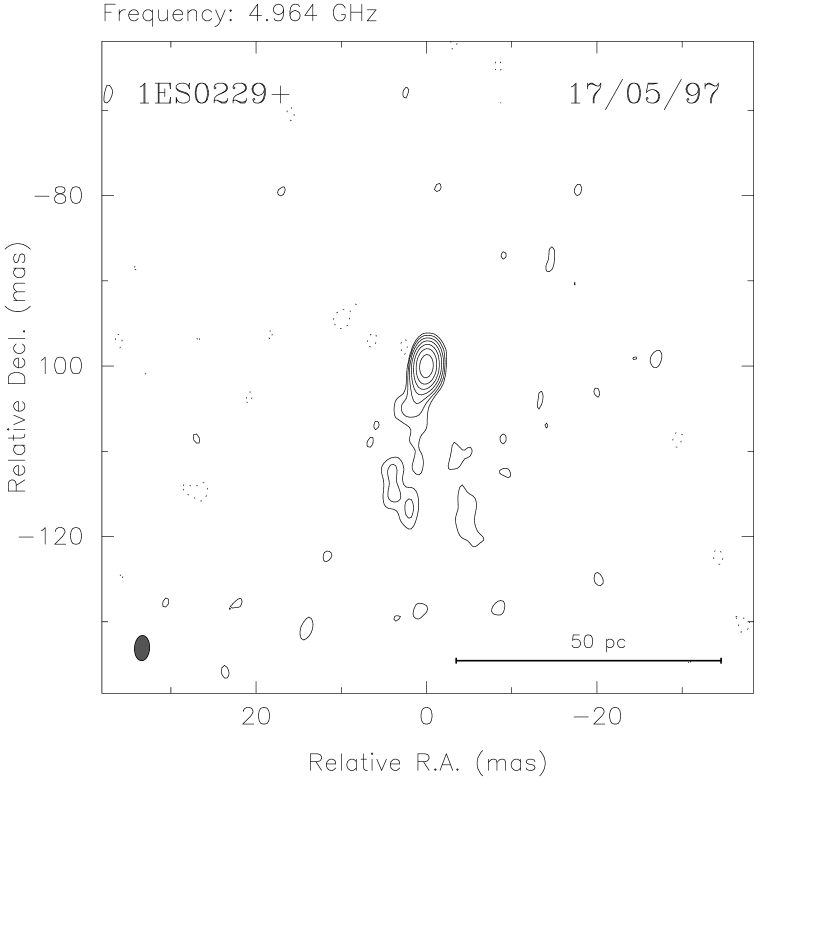
1ES 0229+200: The VLBA map (Figure 4) shows a jet extending to the south (PA = +170°), with weak evidence for a broad jet opening angle of 30°. The VLA image (Figure 5) shows curved jets to the north and south, both of which curve to the west. Measuring the jet PAs from the the inner contours gives PA ° and PA = 180°. The VLBA jet appears to be well-aligned with the southern jet ( = °).
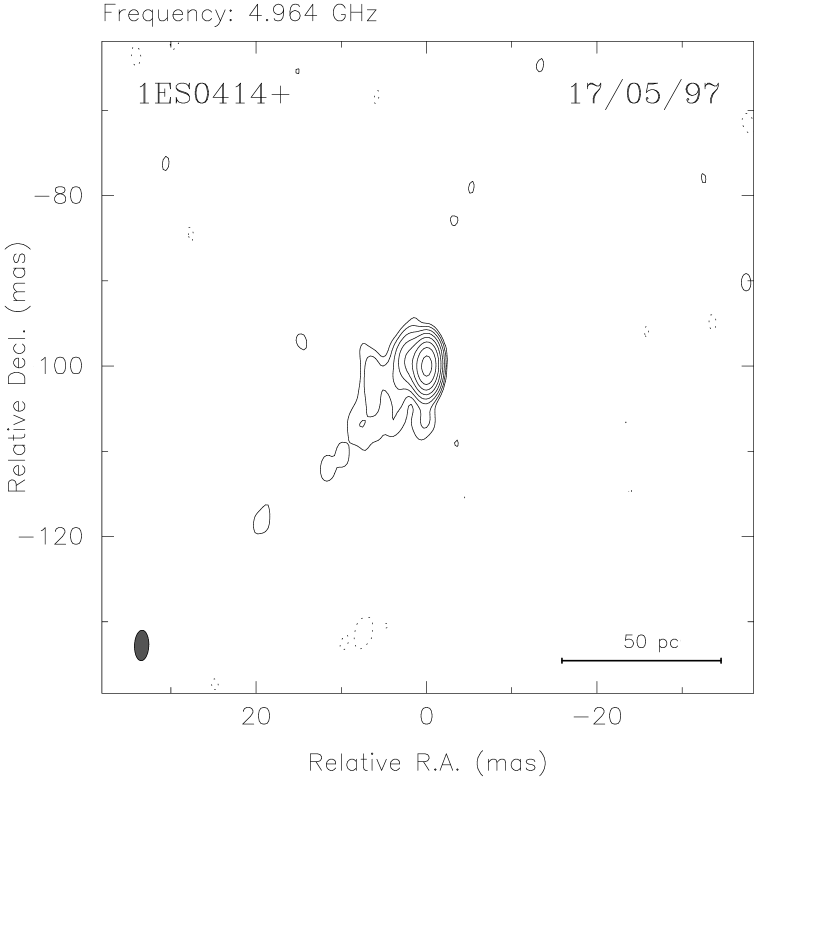
1ES 0414+009: The VLBA map (Figure 6) resolves a jet which initially extends to the east-northeast (PA = °) of the core. There is also weak, extended (3-4) emission to the southeast of the jet, which suggests either that the jet is collimated and bends to the south 10pc from the core, or that the projected jet opening angle is wide (60°). If the jet does indeed bend to the southeast, the misalignment angle could be as large as = 60°; however the inner portion of the jet is well-aligned ( °) to the kpc-scale jet shown in Figure 3 of Laurent-Muehleisen et al. (1993).
1ES 0647+250: The VLBA map (Figure 7) of this source does not show a distinct jet but there is some evidence for a faint, diffuse halo around the core, with weak evidence of elongation of the core to the north at PA = °. VLA snapshot observations (Perlman & Stocke, 1993) of this source show a jet extending to the southwest (PA = °) as well as a possible extention to the northwest; although the reality of the extended structure is seriously questioned due to the poor quality of this map. A deep VLA map is necessary to better determine the kpc-scale structure of this source. Due to the uncertainty of the VLA and VLBA structure a for this source is not considered in analysis. The redshift of 1ES 0647+250 is tentative and must be confirmed by further optical spectroscopy.
RGB 0656+426: The VLA map of this source (Figure 8) shows a jet-core-jet source embedded in a bright halo, with a jet at PA ° and a colinear counter-jet. The VLBA map of this source (Bondi et al., 2001) resolves a well-collimated jet at PA °, which is well-aligned ( °) with the counter-jet. The halo morphology on kpc scales suggests this object is seen very close to the jet axis.
1ES 0806+524: The VLBA map (Figure 9) shows a jet to the north with PA = °. Very faint, diffuse extended emission surrounds the jet, suggesting it has a broad opening angle which may be as wide as 70°. A deep VLA map of this source is unresolved; no extended flux is detected at the 0.2 mJy beam-1 level.
1ES 1028+511: This source is unresolved by both the VLBA (this paper) and in a VLA snapshot by Perlman et al. (1996). The VLBA core flux is only % of the VLA core flux, indicating either variability or extended flux which is too faint or resolved out on parsec scales. The redshift for this source is tentative, and must be confirmed by further optical spectroscopy.
1ES 1212+078: The VLBA map of this source (Figure 10) shows a well-collimated jet extending to the east (PA = °). The jet is straight as far as 50 parsecs; and it has several discrete components. A deep VLA map of this source (Figure 11) shows an unusual, diffuse halo around the source, with no clear evidence of a jet in any direction. Measuring from the core to the brightest hotspot gives PA = ° and °, although this is highly speculative. However, a very large does seem likely for this source.
1E 1415+259: This source was detected by the VLBA, but due to its faintness its extended structure cannot be modeled.
RGB 1427+238: The VLA map of this source (Figure 12) shows a compact structure that consists of a core and either a halo or roughly collinear jets extending north PA ° and south PA °. The VLBA source is unresolved on the 1.1 mJy beam-1 level (Fey & Charlot, 2000).
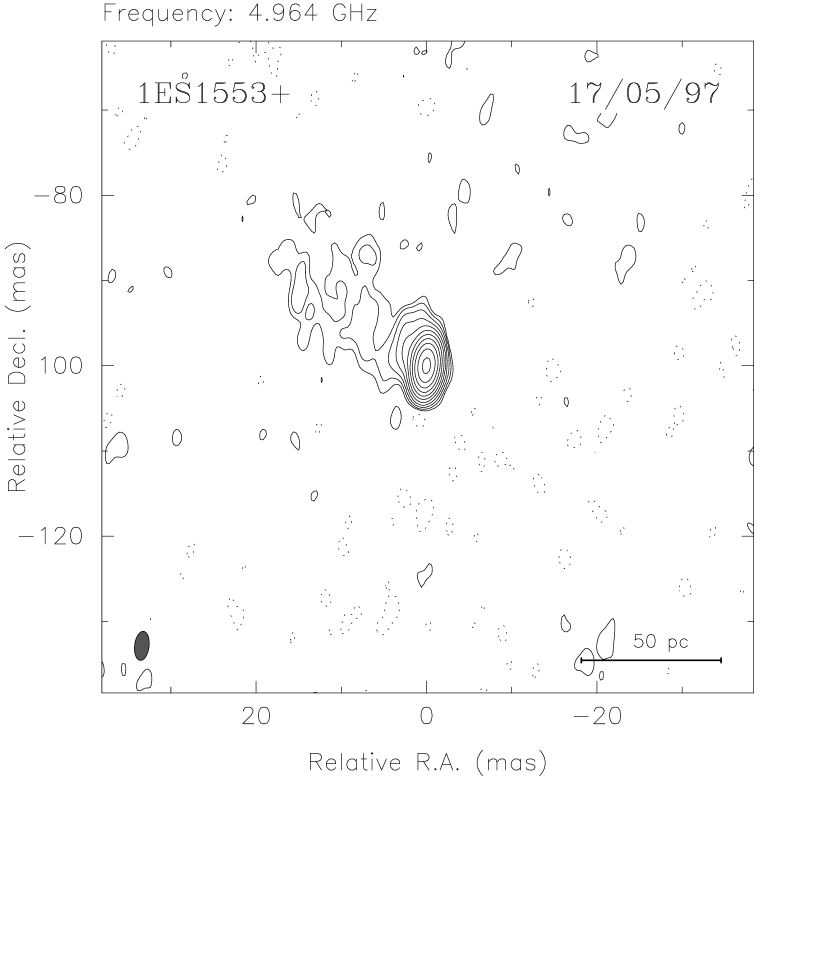
1ES 1553+113: The VLBA map (Figure 13) shows a jet extending to the northeast (PA = +48°). Beyond parsecs the jet is very faint and diffuse, thus it is difficult to determine the opening angle or if the jet is bent. No jet continuous from the core is detected in a deep VLA map (Figure 14); however a faint lobe is detected south of the core, with a weak “hot spot” at PA = +160°, giving a large misalignment angle of ° if we assume the VLBA jet is related to the southern lobe.
1ES 1741+196: The VLBA map of this source (Figure 15) shows a well-collimated jet extending to the east (PA = +86°). The jet is very straight, although it does show evidence for 5° bend to the south, 15–20 parsecs from the core. The VLA snapshot of this source (Perlman et al., 1996) shows a jet which is well-aligned with the parsec-scale jet ( = 5°).
RGB 1745+398: RGB 1745+398 is the unusual object to the north in the VLA map shown in Figure 16. It has an edge-darkened, FR-I morphology that is highly distorted. One jet appears to emerge from the core at PA = ° before bending to the west. The other jet emerges from the core at PA ° before bending to the southeast. Both jets show sharp bends, of up to 70°. This object lies close to the center of a moderately massive galaxy cluster (Nilsson et al., 1999); thus its distorted shape may be the result of interaction with either the ICM or the halos of other cluster members. This hypothesis is supported by the presence of another highly distorted radio source to the southwest of RGB 1745+398 in Figure 16, which may also be a cluster member. A VLBA map of RGB 1745+398 (Preeti, private comm.) shows a component emerging due south from the core at PA °. Thus ° in this very distorted source.
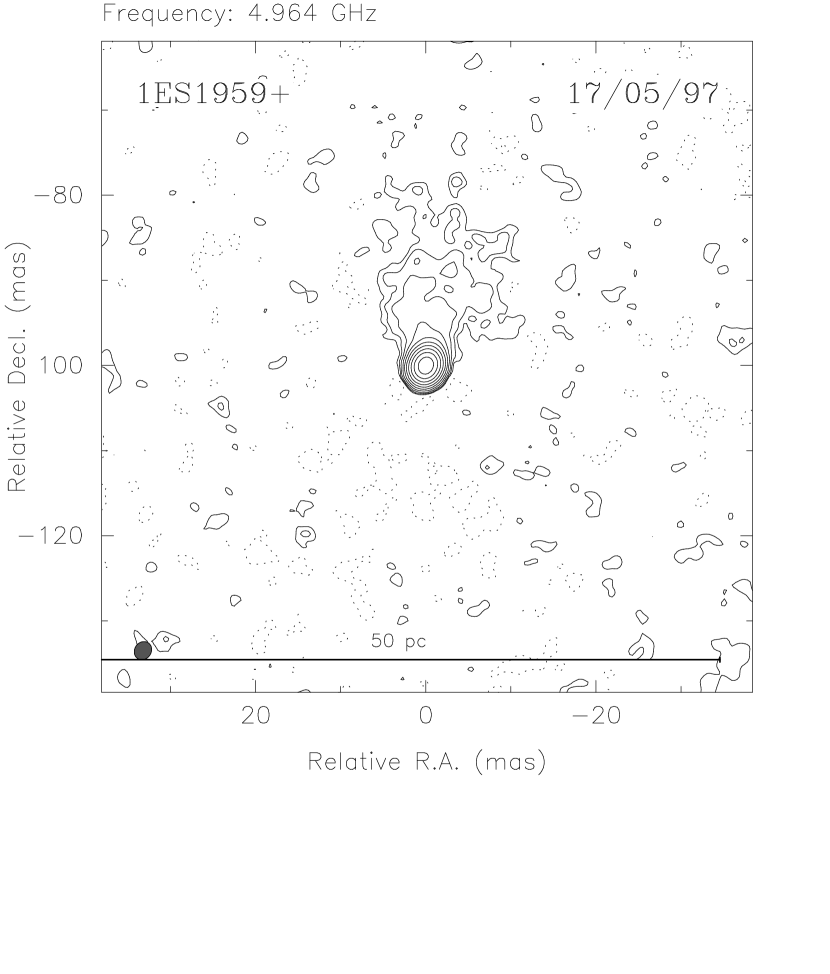
1ES 1959+650: The VLBA map (Figure 17) shows a broad, diffuse jet to the north (PA °). The opening angle of the jet is wide (55°). The core is unresolved in a deep VLA map (Figure 18); however, very faint extended flux is detected to the north (PA °) and south (PA °) of the core. Thus the VLBA jet appears to be well aligned with the northern lobe.
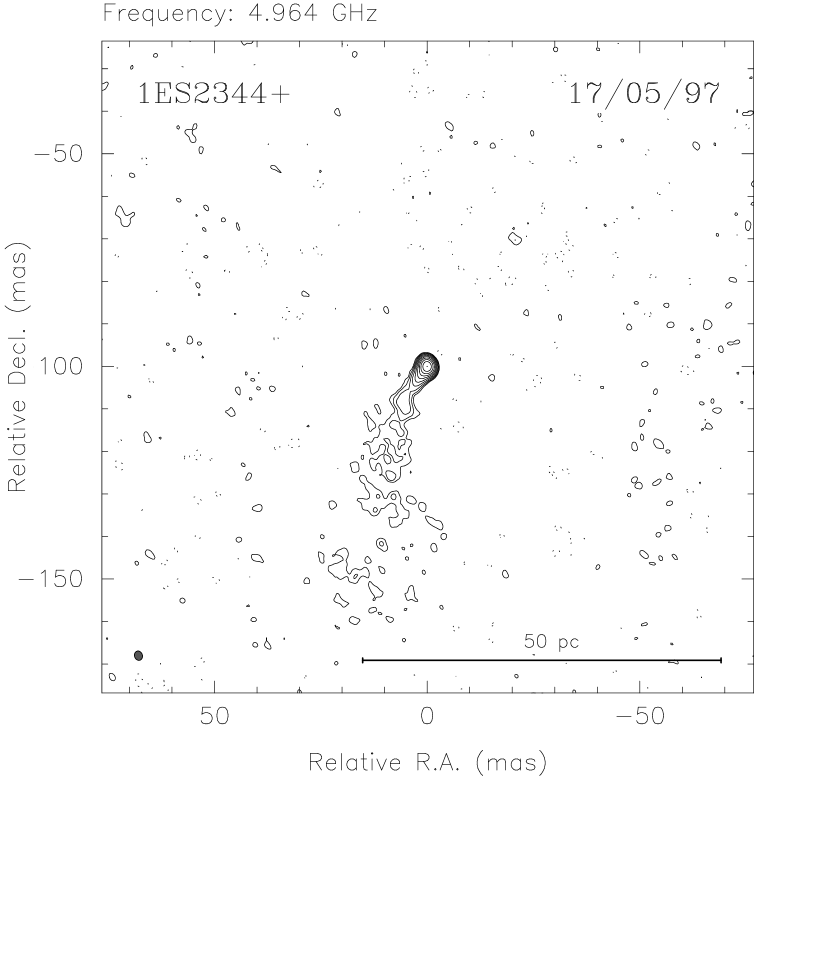
1ES 2344+514: The VLBA map (Figure 19) shows a jet extending to the southeast (PA = +145); it appears to be well-collimated for about 10 parsecs before bending 25°to the south and broadening into a cone with a 35° opening angle. A deep VLA map (Figure 20) detects emission extending to the east (PA = +105°) in a 50° cone. The for this source is at least 40°.
3. Results and Discussion
Previous studies of the VLBI structure of BL Lac objects, nearly all of which were of LBLs, have shown that large misalignment angles are common in these objects (Kollgaard et al., 1992; Appl et al., 1996; Cassaro et al., 2002). This is to be expected in sources that are seen close to the line of sight, as projection effects will magnify the apparent distortion from intrinsic bends and complex structure within these jets.
Measuring the parsec-scale jet PAs in BL Lacs is very difficult for several reasons. Many of these objects show jets which bend within several parsecs from the core; and in many cases the emission where the bending occurs is very faint. Thus the measured PA is very sensitive to the linear resolution and the sensitivity of the observations, which of course depend on the observed wavelength, the distance to the object, the () coverage and the overall quality of the observations. The parsec-scale jets seen in Mkn 501 and 1Jy 1147+245 are good examples of this problem (Conway & Wrobel, 1995; Gabuzda et al., 1999; Cassaro et al., 2002). Adding another dimension to the problem, there is evidence that the jet trajectory for some of these objects can change on short timescales; e.g., 1Jy 0735+178 (Gómez et al., 2001).
Like the VLBI maps, the measured jet PAs in the VLA maps are also dependent on sensitivity and resolution; e.g., the measured PAs can differ by as much as 60° based upon the resolution of the maps for 1Jy 0814+425 and 1Jy 2131–021 (Cassaro et al., 2002; Rector & Stocke, 2002). Additionally, the kpc-scale structure of these sources are usually highly distorted, often with a “halo” that surrounds the core with no clear PA. Thus, it is not surprising that we see such a range of values, even without considering the enormous difference in physical scales between the VLA and VLBI maps and the physical environments through which a jet propagates from the core to kiloparsec scales.
Despite the uncertainties inherent in such measurements, we have measured parsec- and kpc-scale jet position angles for our HBL sample. We include the four HBLs observed by Kollgaard et al. (1996) into our HBL sample. For comparison, we consider all of the LBLs in the complete 1Jy sample (Stickel et al., 1991) for which high dynamic-range VLA maps exist (Rector & Stocke, 2001, 2002, and references therein) and that have been studied in detail with VLBI techniques (Cassaro et al., 2002; Fey & Charlot, 1997, 2000; Fomalont et al., 2000; Gabuzda et al., 1999, 2000; Gabuzda & Cawthorne, 2000; Kellermann et al., 1998; Ros et al., 2001; Shen et al., 1997, 1998). For consistency, we measure jet position angles from these maps using the methodology described below rather than use published values.
There are only a few cases where the jet PA is unambiguous. Thus the parsec- and kpc-scale jet position angles were measured with the following methodology. For both the VLA and VLBI maps the PA is measured from the core through contiguous jet components that are more than 2–3 detections. In some cases the PA on VLBI scales is uncertain because the jet is diffuse with a broad opening angle (e.g., 1ES 0806+524 and 1ES 1959+650). In these cases the PA is measured either down the center of the jet or along the brightest contours within the jet. Also, there are four objects in our HBL sample (1ES 0033+595, 1ES 0414+009, 1ES 1741+196 and 1ES 2344+514) that have bright, well-collimated parsec-scale jets close to the core and show evidence of bending further from the core. However, the emission where the bending may be occuring is faint; and it is not clear whether the jet is actually bending or simply broadening. For this reason the jet PA is measured from the bright jet components near the core. In three of the four objects the kpc-scale structure is well aligned with these measurements; the exception is 1ES 2344+514, for which no measurement of the PApc will align it with the VLA PAkpc. Thus it is possible that the jets in these objects are bending and may not as well aligned as measured.
The better alignment of the parsec-scale jet near the core with the kpc-scale jets in these sources may be the result of collisions with dense clouds of gas near the core. For a powerful jet, such collisions are not effective at deflecting the jet in a coherent manner; however they may result in temporary distortions of the jets on timescales of yr (De Young, 1991; Wang, Witta & Hooda, 2000). Thus, it is possible that the observed VLBI morphologies could be explained by an off-center collision with a dense gas cloud 10–20 parsecs from the core which distorts the observed PA at this distance but doesn’t affect the long-term propagation of the jet to kpc distances.
It is worth noting that Hough et al. (2002) find significant PA differences between inner and outer VLBI jet components in a sample of lobe-dominated quasars, wherein the outer VLBI jet components are better aligned with the kiloparsec-scale jets. This suggests that, in quasars at least, jets may distort or bend close to the core before becoming well-collimated further from the core. The comparison is limited because quasar jets are of much higher power; and due to the much higher redshift of their quasar sample (), the VLBI maps in Hough et al. (2002) are studying larger physical scales by a factor of 10. Also, lobe-dominated quasar jets are seen at large angles to the line of sight, and therefore do not suffer from projection effects to nearly the degree as BL Lac objects.
In all of the resolved VLBI maps jet structure is apparent; however the VLA maps reveal that many of these sources have a “halo” morphology, i.e., extended emission that surrounds the core with no clear jet. For these objects the PA is measured to the brightest “hotspot” within the lobe; and for objects which have two distinct lobes and no clear jet, the PA is measured to the lobe most likely associated with the parsec-scale jet (i.e., to the lobe which minimizes the value of ). Naturally, could only be determined for objects which were resolved by both the VLA and with VLBI.
Figure 21 shows the distribution of misalignment angles for the HBLs in our sample and the LBLs in the 1Jy sample. Unfortunately, in only seven of the fifteen HBLs in our sample are jets resolved in both VLA and VLBI images. The parsec- and kpc-scale jets are well-aligned ( °) for five of the seven. In three additional sources a VLA PA value was determined by the brightest hotspot in a lobe. In only one of these cases is the parsec-scale jet well aligned with the hotspot. The remaining six sources are unresolved in one or both maps. To this sample we added the four HBLs in Kollgaard et al. (1996), although for only one could a value be determined. While all four are resolved in VLBI maps, a VLA map of 1ES 1133+704 by Ulvestad & Antonucci (1986) shows a halo morphology with no clear PA; and VLA maps of the other sources reliably resolve only 1ES 1727+503 (Ulvestad & Antonucci, 1986; Laurent-Muehleisen et al., 1993). In the 1Jy LBL sample we were able to determine values for only 18 of 37 objects, with an additional three tentative values. The difficulty in determining values in the 1Jy sample is due to unresolved sources as well as many objects which show halo structures around the core with no resolved jet or hotspots.
Whereas most of the HBLs are well aligned ( °), the LBL sample shows a wide distribution of values, evenly distributed from 0° to 150°. The distributions of for HBLs and LBLs are different at the 96% level of confidence using a two-sided Kolmogorov-Smirnov test. Additionally, all four extreme HBLs (log() ) with well-measured misalignment angles are very well aligned. While not conclusive, this suggests that HBLs either have intriniscally straighter jets than LBLs, or that HBLs are seen further off-axis than LBLs, such that projection effects are not as important. Clearly larger and statistically-complete samples are desirable.
We note that the distribution of values in the 1Jy LBL sample is consistent with the distribution of values seen by Kollgaard et al. (1992). We also note that there is no significant evidence for a bimodal distribution of misalignment angles, with two peaks centered on 0° and 90°, as suggested for BL Lacs by Appl et al. (1996). Thus we argue that the 1Jy LBL sample is consistent with a population of radio galaxies whose jet axes are seen close to the line of sight; and that complex bend geometries such as those proposed by Conway & Murphy (1993) are not necessary to explain the distributions of in either of our samples.
If the orientation hypothesis is correct, that is, if HBLs are simply LBLs seen further from the jet axis, there should be a correlation between log() and because LBLs will appear to be more misaligned due to projection effects. Figure 22 shows the distribution of as a function of log() for both samples. There is a weak evidence (90% probability) that and log() are linearly anticorrelated when the samples are combined; but this anticorrelation is not seen in the LBL sample alone. No correlation is seen between and for either the full LBL and HBL sample or amongst the LBLs alone.
4. Conclusions
We have completed VLA and first-epoch VLBA observations as part of a program to study the parsec-scale radio structure of a sample of fifteen HBLs. All of the resolved objects are core dominated in the VLA and VLBA maps; and they show a core-jet morphology on parsec scales, similar to LBLs and core-dominated quasars. Some sources show a well-collimated, parsec-scale jet with discrete components, whereas others show a diffuse jet with a wide opening angle. Some objects also show evidence for the interaction of their parsec-scale jets with a dense gas environment. Further modeling is warranted.
While LBLs show a wide distribution of parsec- and kpc-scale jet alignment angles, most of the HBLs considered here have well-aligned jets, suggesting either that HBL jets are seen further off-axis than LBL jets, or that HBL jets are intrinsically straighter. Complex bend geometries, such as those proposed by Conway & Murphy (1993), are not necessary to explain the observed distributions of misalignment angles seen in our LBL or HBL samples. There is a hint in our data that extreme HBLs (log() ) have intrinsically straight jets that are viewed well off-axis in that all four extreme HBLs in our sample have very small (%) misalignment angles. Observations of other extreme HBLs are needed to test this preliminary result.
While it is now clear that orientation alone cannot be invoked to unify HBLs and LBLs (Rector & Stocke, 2001), selection effects may nonetheless cause LBLs to be seen closer to the jet axis than HBLs. For example, LBLs show optical emission lines which are several orders of magnitude more luminous than HBLs. Thus LBLs may require larger Doppler factors to sufficiently boost the jet continuum relative to the emission lines to remain within the BL Lac spectral criterion (rest Å). Similarly, the bright radio flux limit as well as the flat radio spectrum criterion of the 1Jy sample may also bias LBLs towards more highly beamed objects, whereas the X-ray surveys used to draw our HBL sample do not have any radio-based selection criteria. Thus, LBLs may be systematically more beamed than HBLs even though they may not necessarily share the same parent population.
References
- Aurière (1982) Aurière, M. 1982, A&A 109, 301.
- Abraham et al. (1991) Abraham, R.G., Crawford, C.S. & McHardy, I.M. MNRAS 1991 252, 482.
- Appl et al. (1996) Appl, S., Sol, H. & Vicente, L. 1996 A&A 310, 419.
- Antonucci & Ulvestad (1985) Antonucci, R.R.J. & Ulvestad, J.S. 1985 ApJ 294, 158.
- Bondi et al. (2001) Bondi, M., Marchã, M.J.M., Dallacasa, D. & Stanghellini, C. 2001 MNRAS 325, 1109.
- Briggs (1995) Briggs, D. 1995, PhD dissertation, New Mexico Institute of Mining and Technology.
- Brinkmann et al. (1996) Brinkmann, W., Siebert, J., Kollgaard, R.I. & Thomas, H.-C. 1996 A&A 313, 356.
- Cassaro et al. (2002) Cassaro, P., Stanghellini, C., Dallacasa, D., Bondi, M. & Zappalà, R.A. 2002 A&A 381, 378.
- Celotti et al. (1993) Celotti, A., Maraschi, L., Ghisellini, G., Caccianiga, A. & Maccacaro, T. 1993 ApJ 416, 118.
- Conway & Murphy (1993) Conway, J.E. & Murphy, D.W. 1993 ApJ 411, 89.
- Conway & Wrobel (1995) Conway, J.E. & Wrobel, J.M. 1995 ApJ 439, 98.
- Cohen (1988) Cohen, M.H. 1988, in BL Lac Objects, ed. L. Maraschi, T. Maccacaro & M.-H. Ulrich (Heidelberg: Springer-Verlag), 13.
- De Young (1991) De Young, D.S. 1991 ApJ 371, 69.
- Fanaroff & Riley (1974) Fanaroff, B.L. & Riley, J.M. 1974 MNRAS 167, 31.
- Fey & Charlot (1997) Fey, A.L. & Charlot, P. 1997 ApJS 111, 95.
- Fey & Charlot (2000) Fey, A.L. & Charlot, P. 2000 ApJS 128, 17.
- Fleming et al. (1993) Fleming, T.A., Green, R.F., Jannuzi, B.T., Liebert, J., Smith, P.S. & Fink, H. 1993 AJ 106, 1729.
- Fomalont et al. (2000) Fomalont, E.B., Frey, S., Paragi, Z., Gurvits, L.I. & Scott, W.K., Taylor, A.R., Edwards, P.G. & Hirabayshi, H. 2000 ApJS 131, 95.
- Fossati et al. (1998) Fossati, G., Maraschi, L., Celotti, A., Comastri, A. & Ghisellini, G. 1998 MNRAS 299, 433.
- Gabuzda et al. (1999) Gabuzda, D.C., Pushkarev, A.B. & Cawthorne, T.V. 1999 MNRAS 307, 725.
- Gabuzda & Cawthorne (2000) Gabuzda, D.C. & Cawthorne, T.V. 2000 MNRAS 319, 1056.
- Gabuzda et al. (2000) Gabuzda, D.C., Pushkarev, A.B. & Cawthorne, T.V. 2000 MNRAS 319, 1109.
- Ghisellini et al. (1993) Ghisellini, G., Padovani, P. Celotti, A. & Maraschi, L. 1993 ApJ 407, 65.
- Giommi & Padovani (1994) Giommi, P. & Padovani, P. 1994 MNRAS 268, L51.
- Gómez et al. (2001) Gómez, J.L., Guirado, J.C., Agudo, I., Marscher, A.P., Alberdi, A., Marcaide, J.M. & Gabuzda, D.C. 2001 MNRAS 328, 873.
- Hough et al. (2002) Hough, D.H., Vermeulen, R.C., Readhead, A.C.S., Cross, L.L., Barth, E.L., Yu, L.H., Beyer, P.J. & Phifer, E.M. 2002 AJ 123, 1258.
- Jannuzi (1990) Jannuzi, B.T. 1990 PhD thesis, U. of Arizona.
- Jannuzi et al. (1993) Jannuzi, B.T., Smith, P.S. & Elston, R. 1993 ApJS 85, 265.
- Jannuzi et al. (1994) Jannuzi, B.T., Elston, R. and Smith, P. 1994 ApJ 428, 130.
- Kellermann et al. (1998) Kellermann, K.I., Vermeulen, R.C., Zensus, J.A. & Cohen, M.H. 1998 ApJ 115, 1295.
- Kollgaard et al. (1992) Kollgaard, R.I., Wardle, J.F.C., Roberts, D.H. & Gabuzda, D.C. 1992 AJ 104, 1687.
- Kollgaard et al. (1996) Kollgaard, R.I., Gabuzda, D.C. and Feigelson, E.D. 1996 ApJ 460, 164.
- Laurent-Muehleisen et al. (1993) Laurent-Muehleisen, S.A., Kollgaard, R.I., Moellenbrock, G.A. & Feigelson, E.D. 1993 AJ 106, 875.
- Laurent-Muehleisen et al. (1999) Laurent-Muehleisen, S.A., Kollgaard, R.I., Feigelson, E.D., Brinkmann, W. & Siebert, J. 1999 ApJ 525, 127.
- Ma et al. (1998) Ma, C., Arias, E.F., Eubanks, T.M., Fey, A.L., Gontier, A.-M., Jacobs, C.S., Sovers, O.J., Archinal, B.A. & Charlot, P. 1998 AJ 116, 516.
- Morris et al. (1991) Morris, S.L., Stocke, J.T., Gioia, I.M., Schild, R.E., Wolter, A. & Della Ceca, R. 1991 ApJ 380, 49.
- Nilsson et al. (1999) Nilsson, K., Takalo, L.O., Pursimo, T., Sillanpää, A., Heidt, J., Wagner, S.J., Laurent-Muehleisen, S.A. & Brinkmann, W. A&A 343, 81.
- O’Dea et al. (1992) O’Dea, C.P., Baum, S.A., Stanghellini, C., Dey, A., van Breugel, W., Deustua, S. & Smith, E.P. 1992 AJ 104, 1320.
- Orr & Browne (1982) Orr, M.J.L. & Browne, I.W.A. 1982 MNRAS 200, 1067.
- Padovani & Urry (1990) Padovani, P. & Urry, C.M. 1990 ApJ 356, 75.
- Padovani & Giommi (1995) Padovani, P. & Giommi, P. 1995 ApJ 444, 567.
- Pearson & Readhead (1988) Pearson, T.J. & Readhead, A.C.S. 1988 ApJ 328, 114.
- Perlman & Stocke (1993) Perlman, E.S. & Stocke, J.T. 1993 ApJ 406, 430.
- Perlman & Stocke (1994) Perlman, E.S. & Stocke, J.T. 1994 AJ 108, 56.
- Perlman et al. (1996) Perlman, E.S., Stocke, J.T., Schachter, J.F., Elvis, M., Ellingson, E., Urry, C.M., Potter, M., Impey, C.D. & Kolchinsky, P. 1996 ApJS 104, 251.
- Perlman et al. (1998) Perlman, E.S., Padovani, P., Giommi, P., Sambruna, R., Jones, L.R., Tzioumis, A. & Reynolds, J. 1998 AJ 115, 1253.
- Perlman et al. (1999) Perlman, E.S., Schachter, J.F. & Stocke, J.T. 1999, in prep.
- Rector et al. (2000) Rector, T.A., Stocke, J.T., Perlman, E.S., Morris, S.L. & Gioia, I.A. 2000 AJ 120, 1626.
- Rector & Stocke (2001) Rector, T.A. & Stocke, J.T. 2001 AJ 122, 565.
- Rector & Stocke (2002) Rector, T.A. & Stocke, J.T. 2002, in prep.
- Ros et al. (2001) Ros, E., Marcaide, J.M., Guirado, J.C. & Pérez-Torres, M.A. 2001 A&A 376, 1105.
- Sambruna et al. (1996) Sambruna, R.M. Maraschi, L. & Urry, M. 1996 ApJ 463, 444.
- Scarpa et al. (1999) Scarpa, R., Urry, C.M., Falomo, R., Pesce, J.E., Webster, R., O’Dowd, M. & Treves, A. 1999 ApJ 521, 134.
- Schwartz et al. (1989) Schwartz, D.A., Brissenden, R.J.V., Tuohy, I.R., Feigelson, E.D., Hertz, P.L. & Remillard, R.A. 1989 BAAS 21, 777.
- Shen et al. (1997) Shen, Z.-Q., Wan, T.-S., Moran, J.M., Jauncey, D.L., Reynolds, J.E., Tzioumis, A.K., Gough, R.G., Ferris, R.H., Sinclair, M.W., Jiang, D.-R., Hong, X.-Y., Liang, S.-G., Costa, M.E., Tingay, S.J., McCulloch, P.M., Lovell, J.E.J., King, E.A., Nicolson, G.D., Murphy, D.W., Meier, D.L., van Ommen, T.D. & White, G.L. 1997 AJ 114, 1999.
- Shen et al. (1998) Shen, Z.-Q., Wan, T.-S., Moran, J.M., Jauncey, D.L., Reynolds, J.E., Tzioumis, A.K., Gough, R.G., Ferris, R.H., Sinclair, M.W., Jiang, D.-R., Hong, X.-Y., Liang, S.-G., Edwards, P.G., Costa, M.E., Tingay, S.J., McCulloch, P.M., Lovell, J.E.J., King, E.A., Nicolson, G.D., Murphy, D.W., Meier, D.L., van Ommen, T.D., Edwards, P.G. & White, G.L. 1998 AJ 1115, 1357.
- Shepherd (1997) Shepherd, M.C. 1997, in ASP Conf. Ser. 125, Astronomical Data Analysis Software and Systems IV, eds. G. Hunt & H.F. Payne (San Francisco: ASP), 77.
- Stickel et al. (1991) Stickel, M., Padovani, P., Urry, C.M., Fried, J.W. & Kühr, H. 1991 ApJ 374, 431.
- Stocke (1989) Stocke, J.T. 1989, in BL Lac Objects, ed. L. Maraschi, T. Maccacaro & M.-H. Ulrich (Heidelberg: Springer-Verlag), 242.
- Stocke et al. (1991) Stocke, J.T., Morris, S.L., Gioia, I.M., Maccacaro, T., Schild, R., Wolter, A., Fleming, T.A. & Henry, J.P. 1991 ApJS 76, 813.
- Ulvestad & Antonucci (1986) Ulvestad, J.S. & Antonucci, R.R.J. 1986 AJ 92, 6.
- Urry et al. (1991) Urry, C.M., Padovani, P. & Stickel, M. 1991 ApJ 382, 501.
- Urry & Padovani (1995) Urry, C.M. & Padovani, P. 1995 PASP 107, 803.
- Wang, Witta & Hooda (2000) Wang, Z., Wiita, P.J. & Hooda, J.S. 2000 ApJ 534, 201.
- Wardle et al. (1984) Wardle, J.F.C., Moore, R.L. & Angel, J.R.P. 1984 ApJ 279, 93.
- Wurtz et al. (1996) Wurtz, R., Stocke, J.T. & Yee, H.K.C. 1996 ApJS 103, 109.
| Object | RA(J2000) | Dec | log() | |
|---|---|---|---|---|
| 1ES 0033+595 | 00:35:52.644 | +59:50:04.59 | -4.07 | 0.086 |
| 1ES 0229+200 | 02:32:48.616 | +20:17:17.45 | -4.23 | 0.139 |
| 1ES 0414+009 | 04:16:52.494 | +01:05:23.91 | -3.88 | 0.287 |
| 1ES 0647+250 | 06:50:46.489 | +25:02:59.63 | -4.09 | 0.203: |
| RGB 0656+426 | 06:56:10.72 | +42:37:02.7 | -5.49 | 0.059 |
| 1ES 0806+524 | 08:09:49.188 | +52:18:58.24 | -4.69 | 0.136 |
| 1ES 1028+511 | 10:31:18.524 | +50:53:35.79 | -3.96 | 0.359: |
| 1ES 1212+078 | 12:15:10.977 | +07:32:04.67 | -5.14 | 0.135 |
| 1E 1415+259 | 14:17:56.680aaThe core position for 1E 1415+259 was determined from the FIRST survey. | +25:43:26.24 | -4.56 | 0.237 |
| RGB 1427+238 | 14:27:00.392bbThe core position for RGB 1427+238 was reported in Ma et al. (1998). | +23:48:00.04 | -5.60 | |
| 1ES 1553+113 | 15:55:43.044 | +11:11:24.37 | -4.99 | 0.360 |
| 1ES 1741+196 | 17:43:57.838 | +19:35:08.99 | -4.89 | 0.083 |
| RGB 1745+398 | 17:45:37.71 | +39:51:31.8 | -5.66 | 0.267 |
| 1ES 1959+650 | 19:59:59.852 | +65:08:54.69 | -4.43 | 0.048 |
| 1ES 2344+514 | 23:47:04.838 | +51:42:17.88 | -4.87 | 0.044 |
| VLA (1.4 GHz) | VLBA (6cm) | |||||
|---|---|---|---|---|---|---|
| Object | (mJy) | (mJy) | PAkpcaaPlease read §2.4 and §3 regarding the measurement of jet PAs. | (mJy) | (mJy) | PApcaaPlease read §2.4 and §3 regarding the measurement of jet PAs. |
| 1ES 0033+595 | 90.4 | +62° | 39.7 | +65° | ||
| 1ES 0229+200 | 51.8 | 180° | 22.7 | +170° | ||
| 1ES 0414+009 | +63° | 36.4 | +68° | |||
| 1ES 0647+250 | 46.0 | |||||
| RGB 0656+426 | 252.8 | ° | ° | |||
| 1ES 0806+524 | 189.1 | 111.2 | +13° | |||
| 1ES 1028+511 | 215.7 | 22.4 | ||||
| 1ES 1212+078 | 87.4 | +178° | 36.3 | +92° | ||
| 1E 1415+259 | 8.7 | |||||
| RGB 1427+238 | 331.7 | ° | ||||
| 1ES 1553+113 | 271.1 | +160° | 258.7 | +48° | ||
| 1ES 1741+196 | +91° | 83.5 | +86° | |||
| RGB 1745+398 | 372.5 | +105° | ° | |||
| 1ES 1959+650 | 227.5 | ° | 181.7 | ° | ||
| 1ES 2344+514 | 217.0 | +105° | 109. | +145° | ||