A New Sample of Distant Compact Groups From DPOSS
Abstract
We have identified eighty-four small, high density groups of galaxies out to in a region of square degrees around the north galactic pole using DPOSS (the Digitized Second Palomar Observatory Sky Survey). The groups have at least four galaxies satisfying more stringent criteria than those used by Hickson in his pioneering work in 1982: the adopted limiting surface brightness for each group is brighter (24 mag arcsec-2 instead of 26 mag arcsec-2), and the spread in magnitude among the member galaxies is narrower (two magnitudes instead of three). We also adopt a slightly modified version of the isolation criterion used by Hickson, in order to avoid rejecting groups with projected nearby faint background galaxies. A 10% contamination rate due to projection effects is expected for this sample based on extensive simulations.
1 Introduction
A large fraction of all galaxies in the universe is found in groups (Nolthenious & White 1987). Groups probe intermediate scales between isolated galaxies and rich clusters, and are therefore important from a cosmological standpoint, providing constraints on the density parameter, , and on the spectrum of primordial density fluctuations (e.g. West, Oemler & Dekel 1989). The study of groups is also important for investigating the relevant processes in the course of galaxy formation and evolution.
Despite their importance and frequency of occurrence, galaxy groups are much less studied than clusters of galaxies. Identification of structures with small numbers of galaxies is a difficult task because of contamination by the field, motivating the search for high density contrast systems. This special class of groups, called compact groups, was first observed by Stephan (1877) and Seyfert (1948). Later, extensive searches were conducted using the first Palomar Observatory Sky Survey (POSS-I, covering the sky north of = -27∘), allowing a more systematic study of these small galaxy systems (Vorontsov-Velyaminov 1959, 1977; Arp 1966). Vorontsov-Velyaminov (1959), by visually inspecting POSS-I plates, produced a list of 355 peculiar and interacting galaxy systems. Taking advantage of the light-gathering power of the 200-inch telescope on Palomar, Arp (1966) re-examined these peculiar systems and found other unusual types, producing an atlas of peculiar galaxies with 338 objects. These two works have shown the importance of compiling a more complete list of interacting systems, which could ultimately be used for studying environmental effects on galactic properties. Not as popular, but equally important, is the work of Shakhbasian (1973), who also visually inspected 200 POSS-I plates, covering 18% of the northern sky, and cataloged 376 small galaxy groups. Unfortunately, the search criteria used in these works relied on subjective values of critical selection parameters, and used visual inspection to establish object magnitudes and isolation from nearby structures. Motivated by the need for a homogeneous and well-quantified sample of compact groups, several authors produced objectively defined catalogs which are suitable for statistical analysis. Rose (1977) was the first to establish a quantitative method to search for compact groups, covering 7.5% of the sky and finding 205 systems, including triplets, quartets, and quintets. Although Rose’s work pioneered the systematic study of small galaxy systems, the best studied sample is that of Hickson (1982), which covers 67% of the northern sky and lists exactly 100 groups, with a median redshift of 0.03. This is the only sample for which redshift information is available for every group. More recently, new samples were defined based on digitized catalogs, avoiding most of the subjectivity of the previous compilations. Examples include the catalogs of Prandoni, Iovino & MacGillivray (1994), and Iovino (2002), which lists 121 compact groups in the southern sky over an area of 5000 square degrees. Other studies have been done utilizing redshifts for group identification. This alternative, which obvously alleviates most of the problems with interlopers that purely photometric searches encounter, is still limited by the availability of deep, large area redshift surveys, which are only recently becoming available (e.g. Barton et al. 1996, Barton, de Carvalho & Geller 1998; Allam & Tucker 2000, Focardi & Kelm 2002).
The level of AGN and starburst activity among compact group members was recently measured systematically, and an important relation established between morphology, density and activity (Coziol et al. 1998a,b). A subsample of 17 compact groups in the southern sky shows an excess of AGNs in the central regions, with the surrounding areas dominated by starburst activity. This relation has been confirmed by Coziol, Iovino, and de Carvalho (2000) using a larger sample, and may represent an important diagnostic measure of the degree of dynamical evolution in a group. The selection of a statistically significant sample of groups, not only in the nearby Universe, but also at higher redshifts, is of paramount importance to further test and extend such relations.
Iovino (2002) examined the main pitfalls of the Hickson sample and presented a new automated algorithm to search for groups. This new algorithm is especially suited to reach fainter magnitudes and can be properly adapted to extend the search for groups to higher redshifts. We have made use of this algorithm to define a sample of small, extremely dense groups of galaxies from the new digitized DPOSS survey catalog. This catalog has star/galaxy separation reliability of 90% at (Gunn-Thuan system). Moreover, it provides color information which can be valuable in understanding the properties of the sample selected. Within an area of square degrees around the north galactic pole, we selected a sample of 84 small, extremely compact groups, singled out by their high surface density of member galaxies, high density contrast with respect to the neighboring galaxy distribution, and narrow spread in magnitude among the member galaxies. These criteria provide an efficient way to minimize contamination by background/foreground galaxies, a main concern when going to fainter magnitudes.
In a hierarchical cosmological scenario, larger mass objects form from the non-linear interactions between smaller mass units (Press & Schechter 1974). Group progenitors would be formed during the early clustering of galaxies (or galaxy progenitors) and so one possibility to identify them and study their dynamical evolution is to extend current samples to higher redshifts. As the DPOSS catalog is released, we intend to build an objective sample of small, dense groups of galaxies covering the entire northern hemisphere out to . This sample will help investigate how interactions and mergers, likely to occur in such extreme environments, influence galaxy evolution.
This paper is organized as follows: §2 presents a brief description of the data used for the group search, methods employed in the group definition, and the group catalog. In §3 we discuss the statistical significance of this new catalog, and in §4 we summarize the main points presented in the paper, as well as the prospects for future studies of small galactic systems in the slightly larger redshift domain we probe here.
2 Data and Algorithm Used
Our search for Compact Groups is based on the DPOSS catalogs, which contain information for stars and galaxies in 3 colors (photographic bands, calibrated using CCDs to Thuan-Gunn , and corrected for Galactic extinction), down to a limiting magnitude of . The star-galaxy classification is accurate to at (Odewahn et al. 2002). For more details on how the catalogs were defined and their photometric quality we refer the reader to Gal et al. (2002). The details of the star-galaxy separation procedures are found in Odewahn et al. (2002).
We conducted our search using DPOSS catalogs covering a modest area of square degrees around the north galactic pole. Our input catalog contains only galaxies in the magnitude range , and we restrict our search to groups whose brightest galaxy has .
The main goal of our algorithm is to keep the contamination by background/foreground galaxies down to reasonable levels, a difficult task in the magnitude range considered. The increase in surface density of galaxies seriously hampers the search, and the algorithm should maximize the probability of selecting groups which are real physical configurations.
As the algorithm will be run on a catalog of galaxies, we use a very simple tool to judge the amount of contamination in our group catalog by chance projection effects. We can apply the algorithm to select candidate groups from random galaxy catalogs, generated by shuffling, plate by plate, the coordinates of galaxies (ra,dec) in our original catalog, while preserving the magnitude and color information for each galaxy (see Prandoni, Iovino, & MacGillivray 1994). This way, any inherent correlation between color and magnitude of the catalogue galaxies is preserved. The plate by plate approach was chosen in order to preserve differences, sometimes on the order of 30%, in galaxy surface density among different plates.
The shuffled and the original galaxy catalogs will have the same distribution of galaxy apparent magnitudes and colors, while the spatial correlation is lost through the shuffling. The shuffled database is thus the parent sample in luminosity and colors for the compact groups and represents a good mixture of field and cluster galaxies. The candidate compact groups that are obtained applying our algorithm to such a shuffled catalog can be viewed as chance projection groups, as they are detected because of projection effects in a catalog where the spatial distribution of galaxies is randomized. We repeated the generation of shuffled galaxy catalogues twenty times, and used the mean value of the number of chance projection groups detected, . In the extreme case of the presence of high density contrast structures in the galaxy distribution within single plates, we could be over-estimating the number of expected groups, as the structure in question will be only partially washed out by the shuffling of the coordinates. On the other hand, we note that shuffling was done on the full plate catalogue down to magnitude 20m, and at such faint magnitudes large, high density contrast structures are rare.
The ratio of the number of chance projection groups selected from the shuffled galaxy catalog to the number of compact group candidates selected from the original database, is a good estimate of the contamination rate (defined as ) of our final catalog.
According to the criteria originally devised by Hickson, an aggregation of galaxies is defined as a compact group if it contains four or more galaxies in a compact configuration and is isolated from the surrounding field (H82). The criteria are expressed by the following formulae:
-
•
richness: , where is the number of galaxies within 3 magnitudes of the brightest group member ().
-
•
isolation: , where is the radius of the smallest circle containing the centers of the group members and is the distance from the center of the circle to the nearest non–member galaxy within 3 magnitudes of the brightest group member.
-
•
compactness: , where is the mean surface brightness (magnitudes arcsec-2) within the circle of radius .
All magnitudes refer to the red E band of POSS-I, with which Hickson performed his visual search. In this photometric band magnitudes arcsec-2.
At fainter magnitudes, the surface density of the sample of galaxies considered for the search increases. Background galaxies can, by chance, be superimposed on the isolation ring of a foreground group, causing it to be rejected by the isolation criterion. The reverse can also happen: a faint galaxy can be projected onto an existing triplet, causing it to be accepted by the richness criterion.
At brighter magnitudes, the surface density of the faintest galaxies entering the sample is so low that these two problems do not greatly affect the search. Furthermore, in a visual search there are other (implicit) criteria used to select the sample, which can help alleviate these problems. As shown in Prandoni Iovino, & MacGillivray (1994), the sample selected visually at bright magnitudes by Hickson satisfies tighter constraints than those stated explicitly. However, in an automated search targeting fainter magnitudes, these two problems can become a major source of both incompleteness and contamination. We investigate, with the help of randomized catalogs, how modifying the H82 criteria can minimize the contamination by chance projections.
We begin by exploring how changing (the surface brightness limit imposed by the compactness criterion) to brighter values, while keeping the other parameters as in H82, affects contamination rates. Following the approach described above, we estimate the contamination rate as a function of by running our search algorithm with different values of , both on multiple random galaxy catalogs and on the original catalog. We estimate, for different values of , the number of groups expected to be found purely due to chance projection effects, and compare it to the number of groups found in the original catalog.
The ratio is % when restricting the search to groups with . Using fainter surface brightness limits, the contamination rate increases dramatically, reaching % for , and % for . We therefore set the surface brightness limit to = 24 mag arcsec-2, in order to reduce the contamination rate of our sample to reasonable values. The strong dependence of contamination rates on the value of is due to the high surface density of galaxies in the fainter magnitude ranges explored in our search. Only the highest density contrast configurations are truly improbable at these limits, and we restrict our search to these configurations only.
We proceed, maintaining = 24 mag arcsec-2, to investigate how narrowing the magnitude range among group member galaxies affects the contamination rate. We run our algorithm on real and randomized catalogs and, similar to the approach taken for , test how the ratio varies as a function of , the magnitude range allowed between the brightest and the faintest member galaxies. Adopting , the contamination rate drops to %, as compared to % with , as in H82. A further narrowing of the range to reduces the contamination rate to %. We thus adopt this final value for the richness criterion.
Tightening the interval of magnitude considered for richness, and choosing a bright surface brightness limit, reduces the contamination rates at fainter magnitudes. In other words, selecting extreme configurations, both in terms of local density and magnitude concordance among members, is a good strategy to avoid being overwhelmed by projection effects at fainter magnitudes. We note that tightening the compactness criterion is merely an acknowledgement of what is already known to be true also for the H82 sample - the galaxies in the groups present in his catalogue are actually within a tighter magnitude range than that stated explicitely (his catalogue is incomplete when the magnitude range among member galaxies is ; see Prandoni, Iovino, & MacGillivray (1994).
For the isolation criterion, we follow a strategy similar to that described in Iovino (2002). Adopting an absolute isolation criterion in our search would result in the rejection of a large fraction of group candidates, which are apparently not isolated because of projection effects. We adopt a flexible isolation criterion, such that no galaxy of magnitude brighter than +0.5m is within the isolation radius, where is the magnitude of the faintest group member. Relaxing the isolation criterion in this way alleviates the incompleteness problem due to the high surface density of fainter galaxies, while still rejecting cases of subcondensations within larger structures. The usefulness of the strict isolation criterion adopted by H82 has already been questioned in the literature. A detailed redshift study of 17 groups from H82 shows that most of them are part of larger structures, and only a few cases can be defined as truly isolated (de Carvalho et al. 1997, Ribeiro et al. 1998). Only a dedicated redshift survey of the surrounding fainter field population can truly assess the actual degree of isolation of the groups selected.
Thus, our final criteria for the compact group selection algorithm are:
-
•
richness: in the magnitude interval , with the constraint . Group members are those defined by this criterion.
-
•
isolation: , where is the distance from the center of the circle to the nearest non–member galaxy within 0.5 magnitudes of the faintest group member.
-
•
compactness: , where is the mean surface brightness (magnitudes arcsec-2) within the circle of radius , and in band.
Each candidate group is therefore characterized by 5 quantities: (1) the magnitude of its brightest galaxy ; (2) the number of its members, ; (3) the magnitude interval between its brightest and faintest member ; (4) the magnitude interval for which the group is isolated, ; and (5), its surface brightness, . It should be noted that with our choice for richness and isolation we avoid using the magnitude bin , where star–galaxy separation accuracy drops from 90% to 85%. For each group, only galaxies in the range are considered for selection purposes.
The choice of extreme values for the selection criteria, while considerably reducing the effects of contamination, does not result in a paucity of local analogues of such systems. Out of the one-hundred groups selected in H82 sample, thirty have brighter than our limit, a high percentage which confirms the incompleteness of H82 at fainter surface brightness limits. Interestingly, only one of these is due to projection effects, while six are triplets and the rest higher multiplicity systems. Twelve H82 groups that further satisfy the criterion are all quartets except for one triplet. The future availability of the Sloan database, with good star-galaxy separation even in the bright magnitude regime, will allow us to select a reliable, local comparison sample, following the same algorithm adopted here.
2.1 Contamination rate tests
Considering the importance of establishing a reliable contamination rate measure, we performed two specific tests in order to gain some insight into this issue. Therefore, we considered: (a) a purely random distribution; and (b) a Rayleigh-Levy (RL) distribution.
An uniform random distribution was generated by choosing a random pair of (ra,dec), within the limits of a plate, and associating a pair of magnitude and color (selected from the original galaxy catalog) to it. This was done plate by plate to preserve the correct galaxy surface density. The results obtained for the purely random catalog are consistent with those using the shuffling scheme. In the truly random case we find 7.13.9 expected groups, while in the shuffled case we find 8.22.8 expected groups. In both cases the procedure was repeated fifteen times, and the rms quoted results from the scatter among different simulations. It should be noted, however, that this procedure only estimates a lower limit to the true contamination rate in our sample, as it considers only truly random projections of galaxies in a uniform Universe, missing other instances of “fake” tight groupings on the sky. These include projections of galaxies within larger structures (e.g., within loose groups, see Mamon 1986, Mamon 1987 and Diaferio et al. 1994; or along walls, or filaments, see Hernquist, Katz, & Weinberg 1995), and real pairs or triplets with additional unassociated galaxies projected onto them.
To address some of these issues, we generated and RL distribution (see Peebles 1993) which reproduces the observed two-point correlation function of galaxies, and our group search was performed on this new galaxy database. The number of groups obtained in this case is only slightly higher than in the case of the purely random distribution, totalling nine in the simulation we performed. This result confirms that neglecting clustering in the real data does not result in a large error in our ”chance projection groups” estimate.
A more realistic way of measuring the contamination rate would be to consider a large cosmological simulation which implicitly assumes that we “know” what the correct model Universe is, but such a simulation is outside the scope of this paper. Our contamination rate estimate should be taken as an indicative value. Our main goal is not to establish an absolute contamination rate but rather to explore how the relative contamination rate changes as a function of the different parameters adopted for our search, and how properties of these “fake” groups differ from those of the real candidate groups.
We also experimented with searching for triplets applying the same criteria stated above (with the obvious change to of the richness parameter). The contamination rate for systems with three members only turned out to be exceedingly high (of the order of 60% in the magnitude range of our search), suggesting that, unfortunately, the search for these interesting systems is highly inefficient when no redshift information is available.
2.2 The compact group catalog
Running the algorithm described in the previous section on our galaxy database, we obtain a list of 84 compact group candidates (hereafter called PCG groups). We verified each candidate by eye, to ensure that no obvious plate defect was classified as a group member. As incompleteness of the galaxy database used could also be a concern, we also check each group candidate for the possible presence of a galaxy (missing in the database) in the isolation ring.
Table 1 lists the main parameters for each PCG group. Column headings are as follows:
-
1.
Group name.
-
2.
Right Ascension (J2000), the coordinates of the center of the smallest circle containing all member galaxies.
-
3.
Declination (J2000).
-
4.
Group radius () in arcminutes, the radius of the smallest circle containing the member galaxies.
-
5.
magnitude of the brightest group galaxy, .
-
6.
Mean surface brightness of the group ( mags arcsec-2), measured as the total magnitude of the member galaxies averaged over the area defining the group. The compactness constraint imposes .
-
7.
Magnitude interval between the brightest and the faintest group member (). The richness constraint imposes .
-
8.
Magnitude interval between the brightest group member and the brightest interloper in the isolation ring (). The isolation constraint imposes . This quantity is set to 99 when no interloper is found within the isolation ring.
-
9.
Number of group members, . The richness constraint imposes within an upper limit of 2 magnitudes from the brightest group member ().
Table 2 provides information on the member galaxies of each PCG group. Column headings are as follows:
-
1.
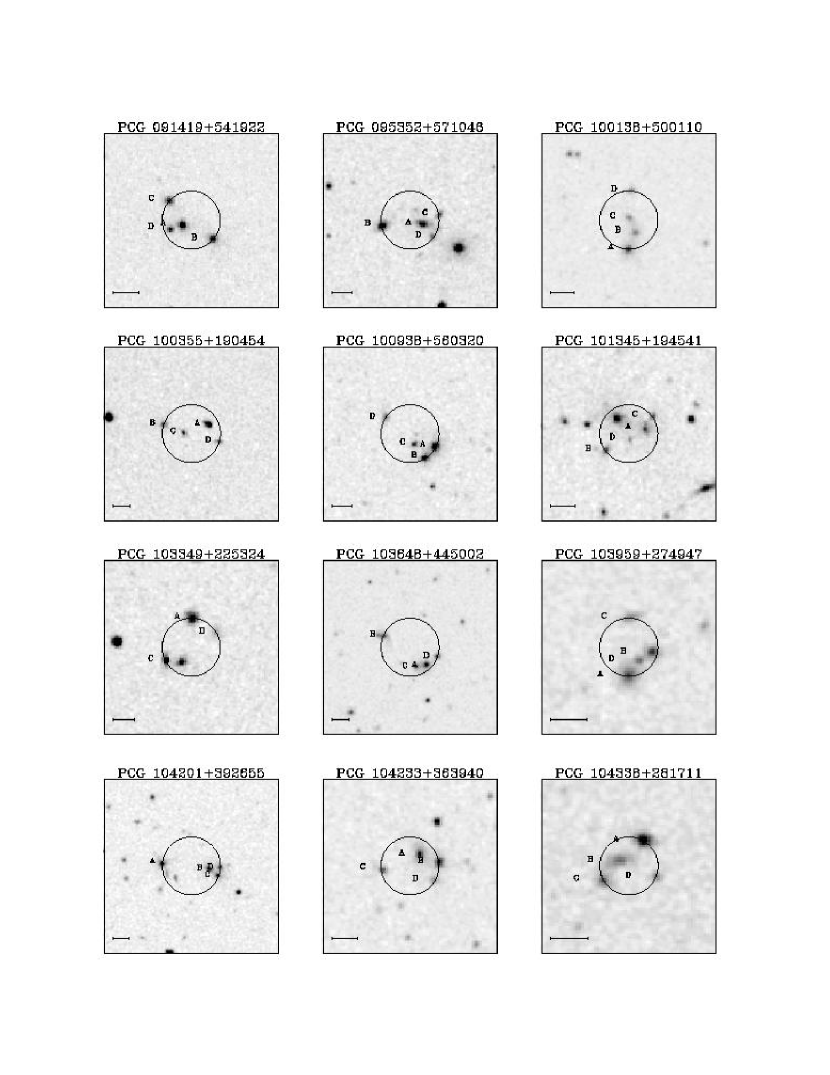
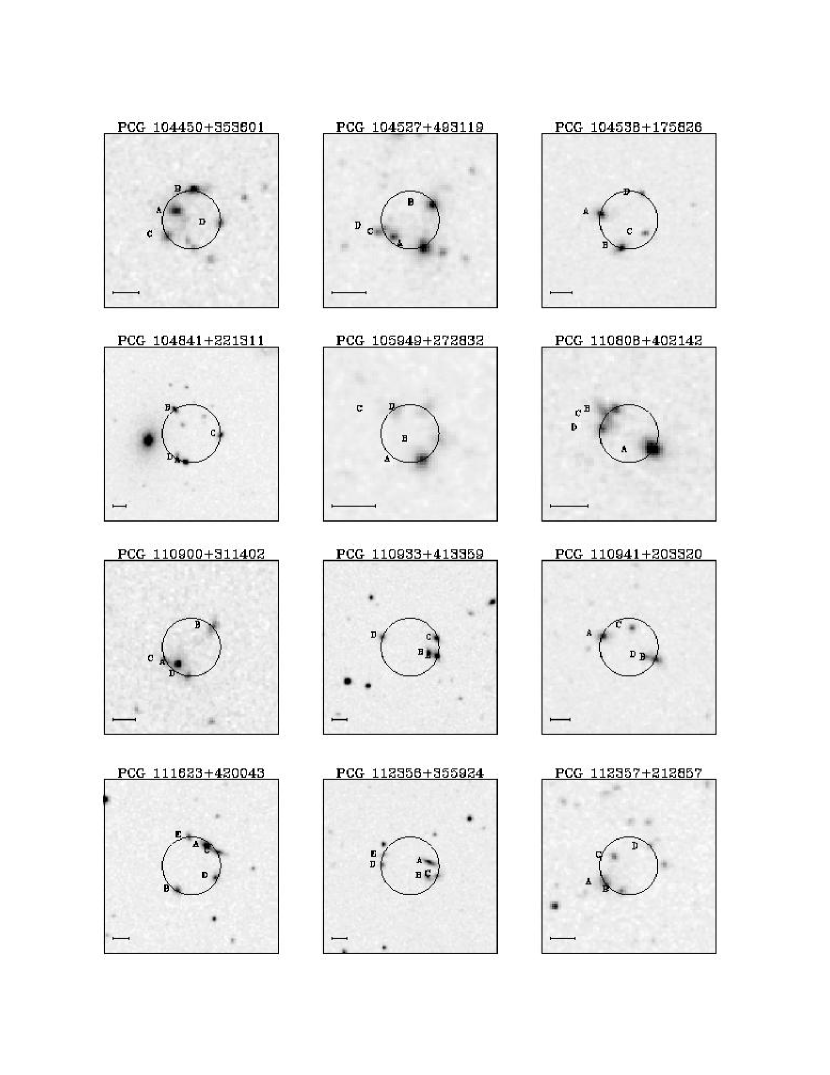
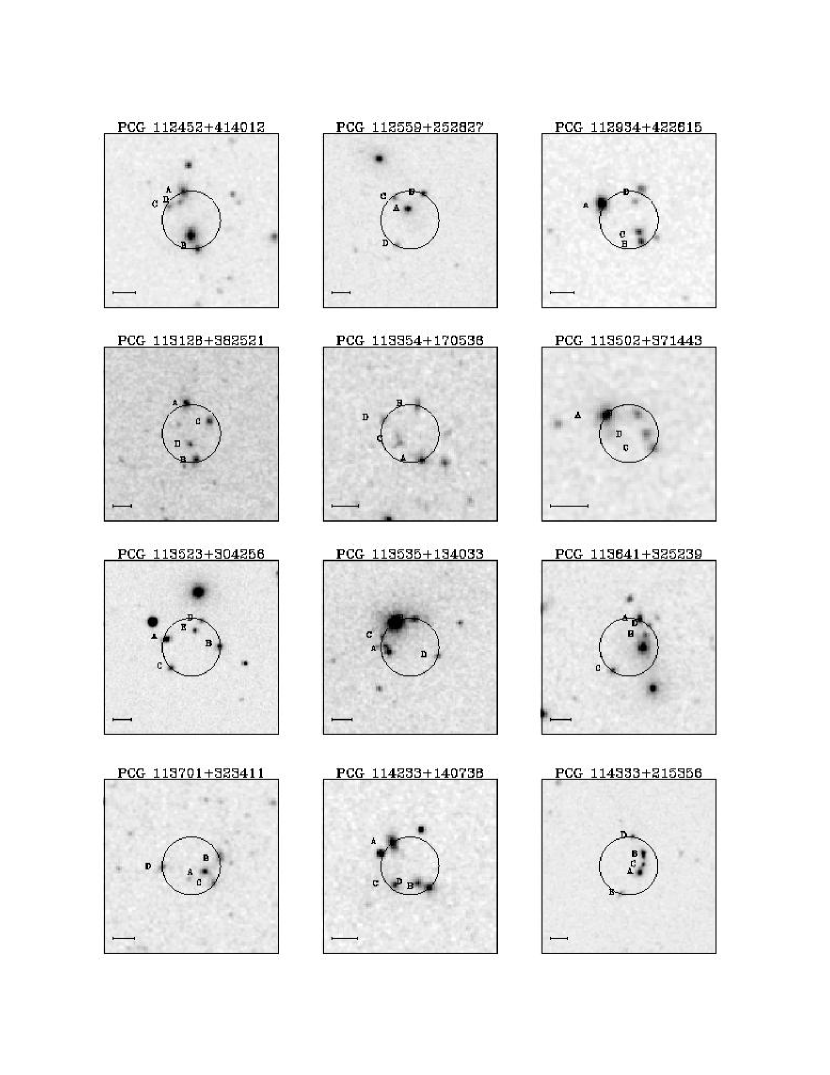
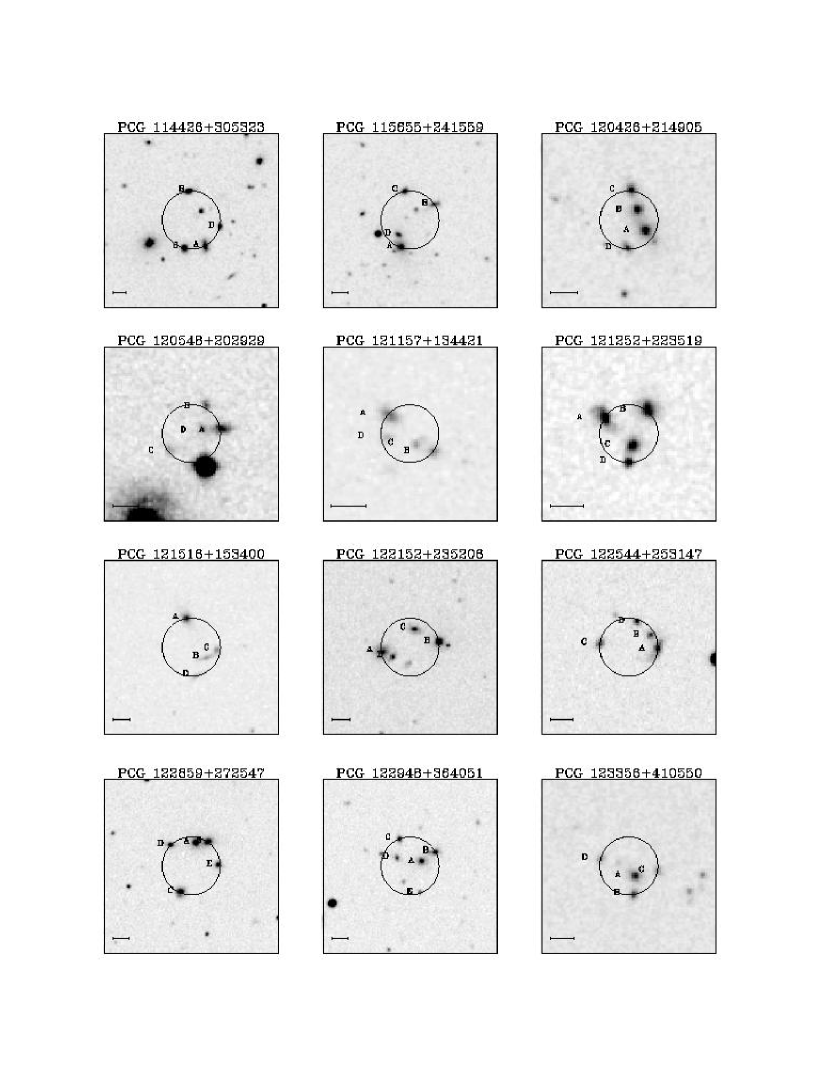
Galaxy name, as shown in Figure 2. All member galaxies are labeled in alphabetical order starting from the brightest and going to fainter members.
-
2.
Galaxy right ascension (J2000).
-
3.
Galaxy declination (J2000).
-
4.
magnitude.
-
5.
color.
-
6.
Position angle.
-
7.
Ellipticity.
3 Statistical Significance of the New Sample
Extensive random simulations have been performed, as described in the previous section, applying the same selection criteria to different random realizations of the DPOSS database. These simulations have shown that with the criteria chosen we expect 10% contamination due to projection effects. In Figure 1, we compare various properties of our sample with those of “fake” groups, selected by the same algorithm, but using the randomized DPOSS database. All histograms have been normalized to one, to emphasize the difference in shape. Panel (a) shows hints of a depletion of fainter member galaxies in real groups with respect to the “fake” ones, an effect that could be related to the dense environment (e.g. cannibalism, secular evolution). Panel (b) shows the surface brightness distribution in our sample compared to that in “fake” groups. The real groups have higher surface brightnesses with respect to the “fake” groups. In our automated search we are not biased to be incomplete as a function of magnitude interval between member galaxies, nor of surface brightness, and therefore these differences probably point to real evolutionary effects. Finally, panel (c) shows the spread of colors within our sample and within “fake” groups, demonstrating a color concordance within each group. This can be interpreted as a further check of the physical reality of the groups in our sample: we expect that real group member galaxies will share the same redshift and same environmental influences, resulting in similar colors among member galaxies.
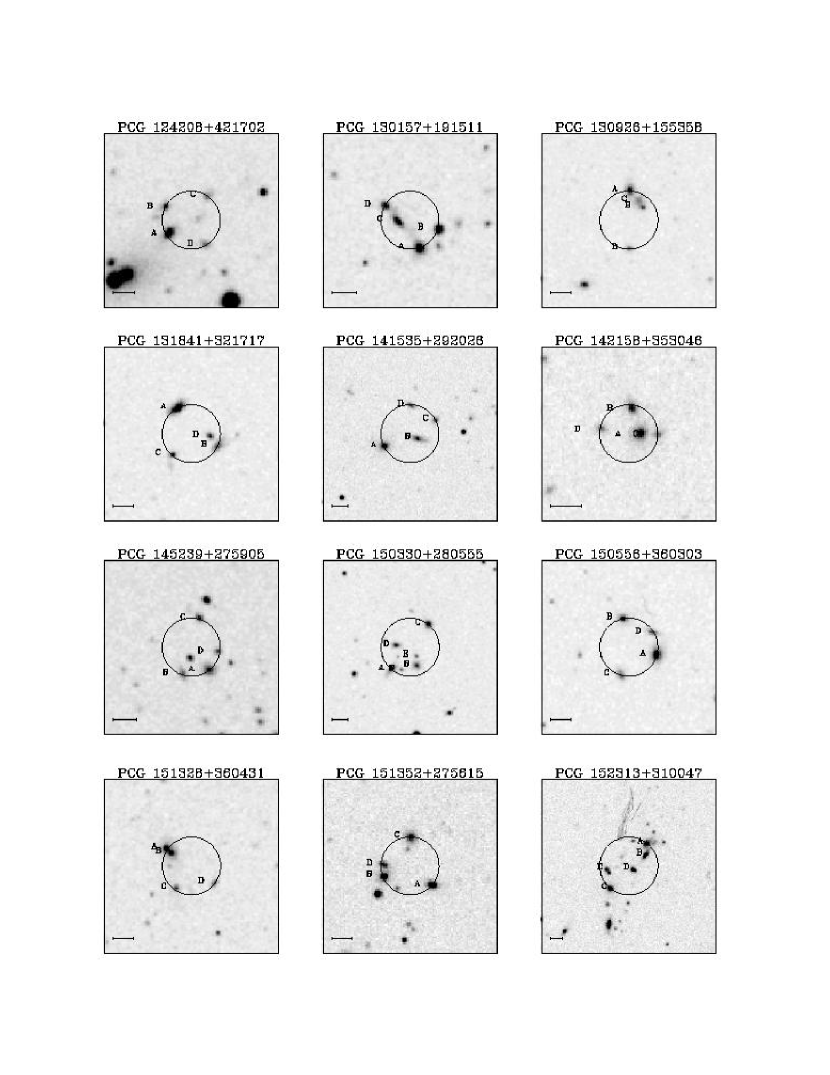
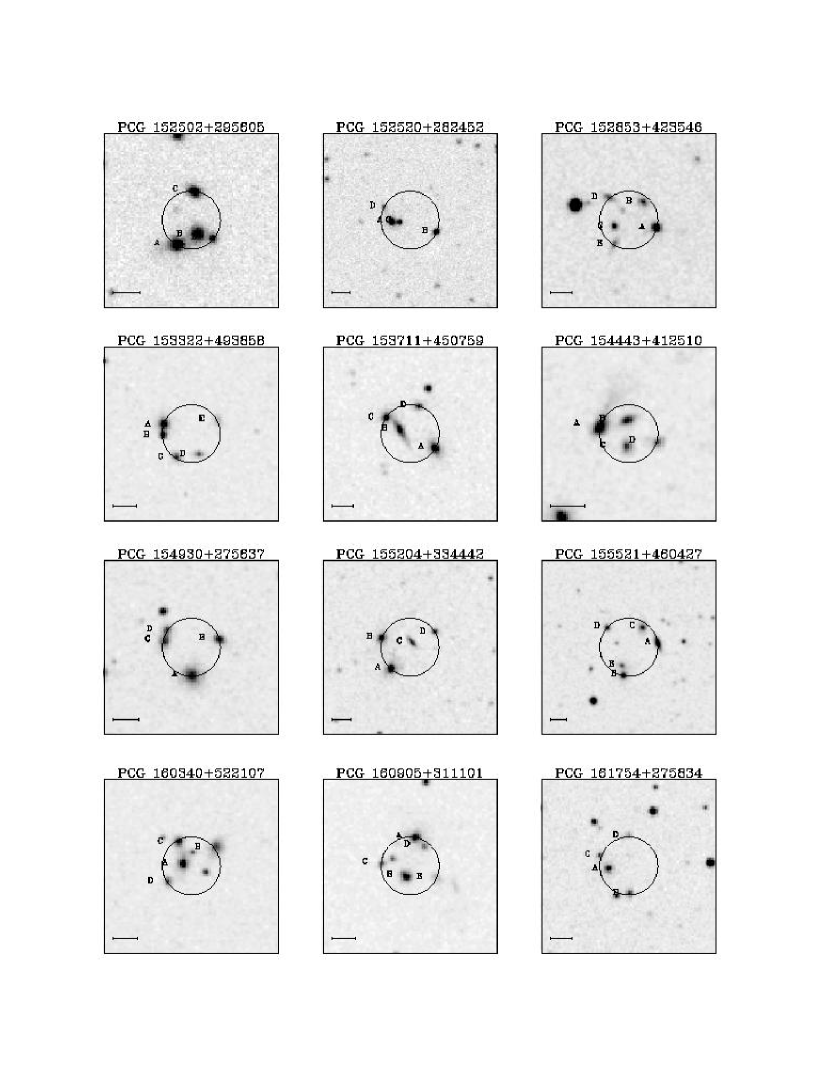
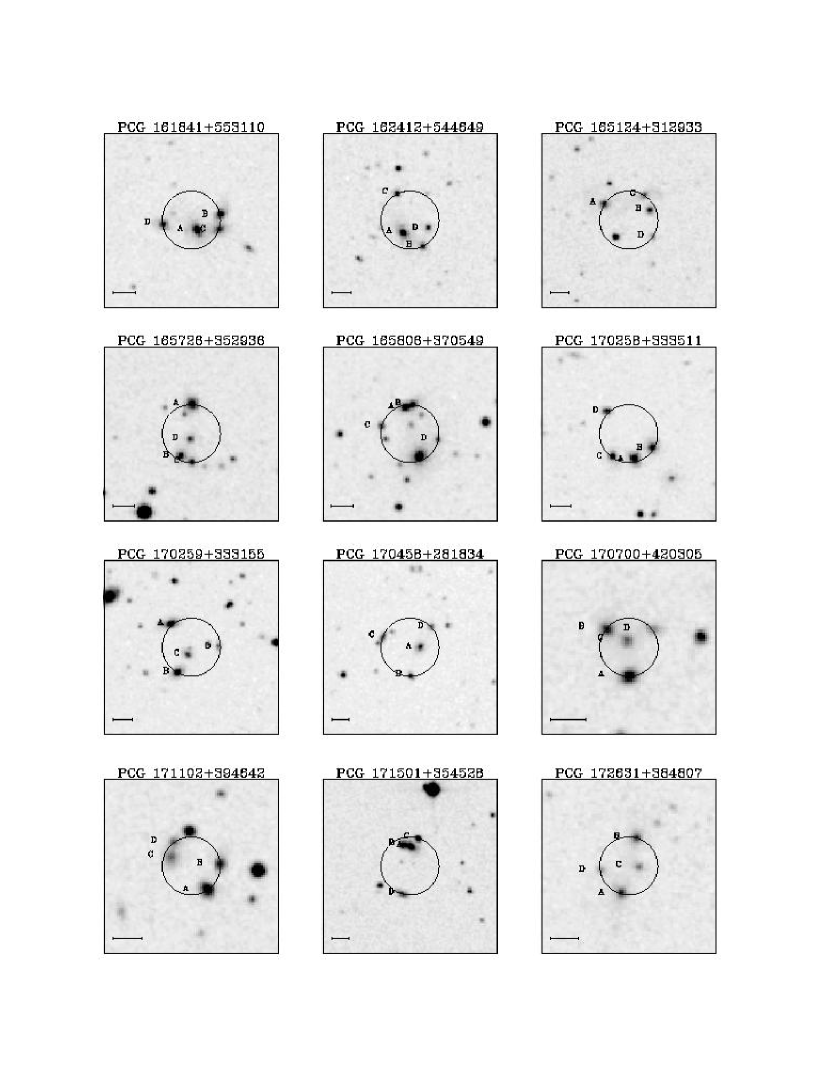
In Figure 2, we present the DPOSS (red) images of our entire sample. In each finding chart the circle drawn has radius , while the horizontal bar to the lower left corresponds to a length of one arcminute. All member galaxies are labeled in alphabetical order starting from brightest to faintest. Some of the images shown are reminiscent of the chain galaxies seen at higher redshifts (Cowie, Hu & Songaila 1995), and could be useful local analogues which can be studied in greater detail. Our catalog can be used to assess the density of such objects in the relatively nearby universe.
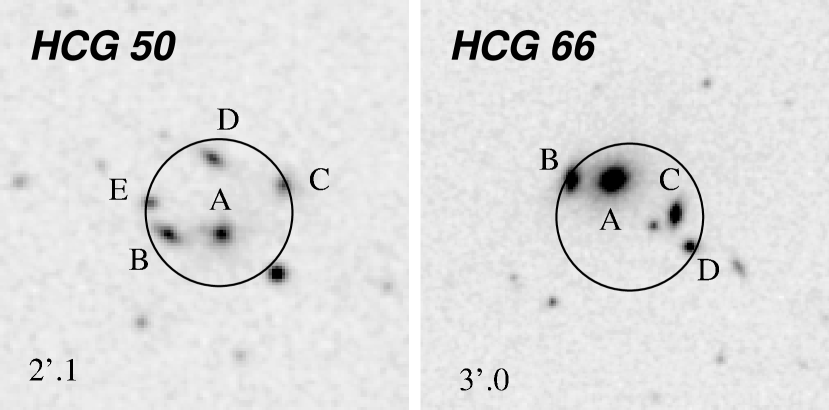
Figure 3 shows two groups from H82 which are confirmed to be at redshifts 0.14 and 0.07, respectively. The two images were extracted from the same plate material used to produce Figure 2 (and the same that, once cataloged, was the database for our search) and the resemblance to the groups of our sample is impressive. Interestingly, these two Hickson groups would both have been selected by our new, more stringent, criteria. As noted earlier, the few groups from H82 which are found in the magnitude range of our search satisfy much tighter constraints than those stated explicitly by Hickson.
4 Summary
We have used the DPOSS catalog of galaxies in an area of square degrees around the north galactic pole to search for small groups out to . Our sample consists of 84 groups with an expected contamination rate of 10%, based on the simulations described earlier.
We will enlarge our sample to eventually cover the full northern sky available to DPOSS (over 10000 square degrees), where we expect a total of candidates. We can estimate the space density of the groups in our catalog by assuming that the median redshift of our sample is , based on the magnitude distribution of the brightest group galaxies. This yields a space density of groups (for and ). This is in good agreement with the results of Mendes de Oliveira & Hickson (1991), who quote a space density of for the H82 sample, especially since we use more stringent selection criteria in our search. Obviously, this order of magnitude estimate needs to be assessed more firmly once redshift information becomes available. Spectroscopic follow-up of our catalog will allow confirmation of these systems as soon-to-merge structures, as well as enable the study of galaxy merger rates, complementing the picture emerging from studies of close galaxy pairs by including physical systems of higher multiplicity. The objective criteria by which our sample is defined will ease the comparison with N-body simulations and samples at different redshift ranges.
As shown in Figures 2 and 3, our group candidates closely resemble the compact groups defined by Hickson in his pioneering paper. Our candidates represent more distant counterparts of the highest density systems in H82, and their detailed study will allow us to study the evolutionary history of such structures. Signs of galaxy evolution have already been reported for clusters and groups above redshift (the Butcher-Oemler effect, see Carlberg et al. 2001). Detecting evolutionary effects for our high density groups would provide further observational constraints for theories and models of the processes that drive galaxy evolution at low and intermediate redshifts.
References
- (1) Allam, S., Tucker, D. 2000, AN, 321, 101
- (2) Arp, H. 1966, ApJS, 14, 1
- (3) Barton, E., Geller, M., Ramella, M., Marzke, R. O., da Costa, L. 1996, AJ, 112, 871
- (4) Barton, E., de Carvalho, R.R., and Geller, M. 1998, AJ, 116, 1573
- de Carvalho et al. (1997) de Carvalho, R. R., Ribeiro, A., Capelato, H., Zepf, S. E. 1997, ApJS, 110, 1
- (6) Carlberg R., Yee ,H., Morris, S., Lin, H., Hall, P., Patton, D., Sawicki, M. and Shepherd, C., 2001, ApJ, 563, 736
- (7) Coziol, R., Ribeiro, A. L. B., Capelato, H. V., de Carvalho, R. R. 1998a, ApJ, 493, 563
- (8) Coziol, R., de Carvalho, R. R., Capelato, H. V., Ribeiro, A. L. B. 1998b, ApJ, 506, 545
- (9) Coziol, R., Iovino, A., de Carvalho, R. R. 2000, AJ, 120, 47
- (10) Cowie, L., Hu, E. M. - and Songaila, H. 1995, AJ, 110, 1576
- (11) Diaferio, A., Geller, M., Ramella, M. 1994, AJ, 107, 868
- (12) Focardi, P., and Kelm, B. 2002, A&A, 391, 35
- (13) Gal, R.R., de Carvalho, R. R., Odewahn, S.C., Djorgovski, S.G., Mahabal, A., Brunner, R.J., and Lopes, P.A.A. 2002, AJ, accepted
- (14) Hernquist, L. Katz, N., Weinberg D. 1995, ApJ, 442, 57
- (15) Hickson, P. 1982, ApJ, 255, 382
- (16) Iovino, A. 2002, AJ, 124, 2471
- (17) Mamon, G. 1986,ApJ, 307, 426
- (18) Mamon, G. 1987, ApJ, 321, 622
- (19) Mendes de Oliveira, C., & Hickson, P. 1991, ApJ, 380, 30
- (20) Nolthenius, R., & White, S.D.M. 1987, MNRAS, 235, 505
- (21) Odewahn, S.C., Gal, R.R., de Carvalho, R. R.,Djorgovski, S.G., Mahabal, A., Brunner, R.J., Stalder, B., and Lopes, P.A.A. 2002, submitted to AJ
- (22) Peebles, P.J.E. Principles of Physical Cosmology, Princeton Series in Physics, 1993.
- (23) Prandoni, I., Iovino, A., MacGillivray, H. T. 1994, AJ, 107, 1235
- (24) Press, W., Schechter, P. 1974, ApJ, 187, 425
- Ribeiro et al (98) Ribeiro, A., de Carvalho, R. R., Capelato, H., Zepf, S. E. 1998, ApJ, 497, 72
- (26) Rose, J. A. 1977, ApJ, 211, 311
- (27) Shakhbazian R. K. 1973, Astrofizika, 9, 495
- (28) Stephan, M. 1877, MNRAS, 37, 334
- (29) Vorontsov-Velyaminov B.A. 1959, Atlas and Catalog of Interacting Galaxies, Vol. 1, Moscow: Sternberg Inst.
- (30) Vorontsov-Velyaminov B.A. 1977, Atlas and Catalog of Interacting Galaxies, Part II, A&A Suppl, 28, 1
- (31) West, M., Oemler, A., Dekel, A. 1989, ApJ, 346, 539

| Name | RA | DEC | Rad | Mag | Number | |||
|---|---|---|---|---|---|---|---|---|
| (J2000) | (J2000) | arcmin | mag | mag | mag | |||
| PCG0914+5419 | 09 14 19 | +54 19 22 | 0.27 | 15.76 | 23.09 | 1.10 | 3.00 | 4 |
| PCG0953+5710 | 09 53 52 | +57 10 46 | 0.35 | 15.50 | 23.36 | 1.86 | 2.80 | 4 |
| PCG1001+5001 | 10 01 38 | +50 01 10 | 0.31 | 16.14 | 23.70 | 1.54 | 2.19 | 4 |
| PCG1003+1904 | 10 03 55 | +19 04 54 | 0.41 | 15.60 | 23.80 | 1.49 | 3.00 | 4 |
| PCG1009+5603 | 10 09 38 | +56 03 20 | 0.36 | 15.38 | 23.30 | 1.53 | 3.00 | 4 |
| PCG1013+1945 | 10 13 45 | +19 45 41 | 0.29 | 15.96 | 23.42 | 1.98 | 2.85 | 4 |
| PCG1033+2253 | 10 33 49 | +22 53 24 | 0.33 | 15.46 | 23.18 | 1.67 | 3.00 | 4 |
| PCG1036+4450 | 10 36 48 | +44 50 02 | 0.43 | 15.45 | 23.75 | 1.22 | 1.74 | 4 |
| PCG1039+2749 | 10 39 59 | +27 49 47 | 0.20 | 16.09 | 22.71 | 1.77 | 3.00 | 4 |
| PCG1042+3926 | 10 42 01 | +39 26 55 | 0.46 | 15.14 | 23.58 | 0.58 | 1.50 | 4 |
| PCG1042+3639 | 10 42 33 | +36 39 40 | 0.28 | 15.74 | 23.07 | 1.89 | 2.86 | 4 |
| PCG1043+2817 | 10 43 38 | +28 17 11 | 0.19 | 16.04 | 22.60 | 1.98 | 3.00 | 4 |
| PCG1044+3536 | 10 44 50 | +35 36 01 | 0.28 | 15.12 | 22.51 | 1.79 | 2.32 | 4 |
| PCG1045+4931 | 10 45 27 | +49 31 19 | 0.22 | 15.59 | 22.38 | 1.70 | 2.54 | 4 |
| PCG1045+1758 | 10 45 38 | +17 58 26 | 0.34 | 15.58 | 23.35 | 1.53 | 3.00 | 4 |
| PCG1048+2213 | 10 48 41 | +22 13 11 | 0.56 | 14.88 | 23.77 | 0.70 | 2.01 | 4 |
| PCG1059+2728 | 10 59 49 | +27 28 32 | 0.16 | 16.41 | 22.62 | 1.94 | 3.00 | 4 |
| PCG1108+4021 | 11 08 08 | +40 21 42 | 0.19 | 16.03 | 22.57 | 1.71 | 3.00 | 4 |
| PCG1109+3114 | 11 09 00 | +31 14 02 | 0.32 | 15.33 | 23.00 | 1.61 | 2.46 | 4 |
| PCG1109+4133 | 11 09 33 | +41 33 59 | 0.49 | 15.30 | 23.88 | 0.96 | 2.16 | 4 |
| PCG1109+2033 | 11 09 41 | +20 33 20 | 0.37 | 15.88 | 23.85 | 1.62 | 2.77 | 4 |
| PCG1116+4200 | 11 16 23 | +42 00 43 | 0.44 | 15.19 | 23.55 | 1.72 | 3.00 | 5 |
| PCG1123+3559 | 11 23 56 | +35 59 24 | 0.47 | 15.18 | 23.67 | 1.95 | 3.00 | 5 |
| PCG1123+2128 | 11 23 57 | +21 28 57 | 0.29 | 15.72 | 23.20 | 1.79 | 2.88 | 4 |
| PCG1124+4140 | 11 24 52 | +41 40 12 | 0.32 | 16.09 | 23.77 | 1.95 | 2.53 | 4 |
| PCG1125+2528 | 11 25 59 | +25 28 27 | 0.40 | 15.38 | 23.53 | 1.84 | 3.00 | 4 |
| PCG1129+4226 | 11 29 34 | +42 26 15 | 0.30 | 15.56 | 23.07 | 1.81 | 2.99 | 4 |
| PCG1131+3825 | 11 31 28 | +38 25 21 | 0.39 | 15.79 | 23.87 | 1.33 | 2.71 | 4 |
| PCG1133+1705 | 11 33 54 | +17 05 36 | 0.27 | 16.26 | 23.54 | 1.56 | 2.68 | 4 |
| PCG1135+3714 | 11 35 02 | +37 14 43 | 0.19 | 15.90 | 22.49 | 1.95 | 2.55 | 4 |
| PCG1135+3042 | 11 35 23 | +30 42 56 | 0.40 | 15.49 | 23.64 | 1.25 | 3.00 | 5 |
| PCG1135+1340 | 11 35 35 | +13 40 33 | 0.35 | 15.51 | 23.36 | 1.86 | 2.95 | 4 |
| PCG1136+3252 | 11 36 41 | +32 52 39 | 0.35 | 15.78 | 23.63 | 1.78 | 2.80 | 4 |
| PCG1137+3234 | 11 37 01 | +32 34 11 | 0.34 | 15.48 | 23.29 | 0.96 | 2.43 | 4 |
| PCG1142+1407 | 11 42 33 | +14 07 38 | 0.28 | 15.40 | 22.76 | 1.25 | 3.00 | 4 |
| PCG1143+2153 | 11 43 33 | +21 53 56 | 0.42 | 15.71 | 23.96 | 1.83 | 2.41 | 5 |
| PCG1144+3053 | 11 44 26 | +30 53 23 | 0.54 | 14.76 | 23.54 | 0.97 | 1.53 | 4 |
| PCG1156+2415 | 11 56 55 | +24 15 59 | 0.44 | 15.31 | 23.65 | 1.25 | 2.70 | 4 |
| PCG1204+2149 | 12 04 26 | +21 49 05 | 0.27 | 15.19 | 22.48 | 1.30 | 2.87 | 4 |
| PCG1205+2029 | 12 05 48 | +20 29 29 | 0.28 | 15.91 | 23.25 | 1.97 | 3.00 | 4 |
| PCG1211+1344 | 12 11 57 | +13 44 21 | 0.21 | 16.20 | 22.93 | 1.45 | 3.00 | 4 |
| PCG1212+2235 | 12 12 52 | +22 35 19 | 0.22 | 15.21 | 22.02 | 1.22 | 3.00 | 4 |
| PCG1215+1534 | 12 15 16 | +15 34 00 | 0.43 | 15.49 | 23.78 | 1.76 | 3.00 | 4 |
| PCG1221+2352 | 12 21 52 | +23 52 06 | 0.40 | 15.31 | 23.45 | 1.38 | 2.31 | 4 |
| PCG1225+2531 | 12 25 44 | +25 31 47 | 0.31 | 16.11 | 23.74 | 1.40 | 2.84 | 4 |
| PCG1228+2725 | 12 28 59 | +27 25 47 | 0.46 | 14.90 | 23.32 | 1.08 | 2.59 | 5 |
| PCG1229+3640 | 12 29 48 | +36 40 51 | 0.45 | 15.49 | 23.87 | 1.91 | 2.96 | 5 |
| PCG1233+4105 | 12 33 56 | +41 05 50 | 0.31 | 16.25 | 23.85 | 1.66 | 3.00 | 4 |
| PCG1242+4217 | 12 42 08 | +42 17 02 | 0.33 | 15.52 | 23.23 | 1.85 | 2.56 | 4 |
| PCG1301+1915 | 13 01 57 | +19 15 11 | 0.29 | 15.39 | 22.86 | 0.88 | 2.24 | 4 |
| PCG1309+1553 | 13 09 26 | +15 53 58 | 0.35 | 16.05 | 23.89 | 1.67 | 3.00 | 4 |
| PCG1318+3217 | 13 18 41 | +32 17 17 | 0.36 | 15.66 | 23.58 | 1.92 | 3.00 | 4 |
| PCG1415+2920 | 14 15 35 | +29 20 26 | 0.44 | 15.38 | 23.72 | 1.50 | 2.46 | 4 |
| PCG1421+3530 | 14 21 58 | +35 30 46 | 0.23 | 16.11 | 23.06 | 1.72 | 3.00 | 4 |
| PCG1452+2759 | 14 52 39 | +27 59 05 | 0.30 | 16.09 | 23.62 | 1.29 | 2.43 | 4 |
| PCG1503+2805 | 15 03 30 | +28 05 55 | 0.44 | 15.37 | 23.70 | 1.97 | 2.75 | 6 |
| PCG1505+3603 | 15 05 56 | +36 03 03 | 0.35 | 15.75 | 23.63 | 1.55 | 3.00 | 4 |
| PCG1513+3604 | 15 13 28 | +36 04 31 | 0.35 | 16.03 | 23.91 | 1.46 | 2.57 | 4 |
| PCG1513+2756 | 15 13 52 | +27 56 15 | 0.35 | 15.50 | 23.33 | 0.94 | 2.50 | 4 |
| PCG1523+3100 | 15 23 13 | +31 00 47 | 0.61 | 14.71 | 23.77 | 0.87 | 2.16 | 5 |
| PCG1525+2956 | 15 25 02 | +29 56 05 | 0.27 | 15.07 | 22.33 | 1.42 | 3.00 | 4 |
| PCG1525+2824 | 15 25 20 | +28 24 52 | 0.41 | 15.78 | 23.96 | 1.82 | 2.71 | 4 |
| PCG1528+4235 | 15 28 53 | +42 35 46 | 0.34 | 15.84 | 23.63 | 1.71 | 3.00 | 5 |
| PCG1533+4938 | 15 33 22 | +49 38 58 | 0.31 | 15.73 | 23.33 | 1.66 | 3.00 | 5 |
| PCG1537+4507 | 15 37 11 | +45 07 59 | 0.34 | 15.31 | 23.10 | 1.35 | 3.00 | 4 |
| PCG1544+4125 | 15 44 43 | +41 25 10 | 0.21 | 16.27 | 23.05 | 1.79 | 3.00 | 4 |
| PCG1549+2756 | 15 49 30 | +27 56 37 | 0.28 | 15.70 | 23.09 | 1.67 | 3.00 | 4 |
| PCG1552+3344 | 15 52 04 | +33 44 42 | 0.37 | 15.67 | 23.64 | 1.61 | 3.00 | 4 |
| PCG1555+4604 | 15 55 21 | +46 04 27 | 0.46 | 15.45 | 23.88 | 1.52 | 2.23 | 5 |
| PCG1603+5221 | 16 03 40 | +52 21 07 | 0.29 | 15.77 | 23.20 | 1.48 | 2.27 | 4 |
| PCG1609+3111 | 16 09 05 | +31 11 01 | 0.30 | 15.64 | 23.17 | 1.95 | 2.81 | 5 |
| PCG1617+2758 | 16 17 54 | +27 58 34 | 0.34 | 15.99 | 23.81 | 1.64 | 2.36 | 4 |
| PCG1618+5531 | 16 18 41 | +55 31 10 | 0.32 | 15.30 | 23.00 | 1.02 | 2.05 | 4 |
| PCG1624+5446 | 16 24 12 | +54 46 49 | 0.36 | 15.68 | 23.62 | 1.72 | 3.00 | 4 |
| PCG1651+3129 | 16 51 24 | +31 29 33 | 0.40 | 15.65 | 23.79 | 1.71 | 2.86 | 4 |
| PCG1657+3529 | 16 57 26 | +35 29 36 | 0.33 | 15.66 | 23.38 | 1.38 | 2.75 | 4 |
| PCG1658+3705 | 16 58 06 | +37 05 49 | 0.34 | 15.77 | 23.56 | 1.66 | 2.42 | 4 |
| PCG1702+3335 | 17 02 58 | +33 35 11 | 0.35 | 15.43 | 23.27 | 1.01 | 3.00 | 4 |
| PCG1702+3331 | 17 02 59 | +33 31 55 | 0.38 | 15.61 | 23.62 | 1.92 | 2.52 | 4 |
| PCG1704+2818 | 17 04 57 | +28 18 34 | 0.41 | 15.62 | 23.84 | 0.97 | 1.71 | 4 |
| PCG1707+4203 | 17 07 00 | +42 03 05 | 0.21 | 15.77 | 22.49 | 1.63 | 3.00 | 4 |
| PCG1711+3946 | 17 11 02 | +39 46 42 | 0.25 | 15.70 | 22.80 | 1.53 | 2.03 | 4 |
| PCG1715+3545 | 17 15 01 | +35 45 28 | 0.42 | 15.19 | 23.42 | 1.15 | 3.00 | 4 |
| PCG1726+3848 | 17 26 31 | +38 48 07 | 0.26 | 16.11 | 23.28 | 1.94 | 2.66 | 4 |
| Name | RA | DEC | r | g-r | PA | Ellip. | ||
|---|---|---|---|---|---|---|---|---|
| (J2000) | (J2000) | mag | mag | |||||
| PCG 0914+5419 | ||||||||
| A | 09 14 20.50 | +54 19 20.21 | 16.88 | 0.30 | 34 | 0.05 | ||
| B | 09 14 18.52 | +54 19 11.79 | 17.11 | 0.31 | 04 | 0.08 | ||
| C | 09 14 21.28 | +54 19 34.04 | 17.38 | 0.26 | 40 | 0.30 | ||
| D | 09 14 21.31 | +54 19 18.26 | 17.98 | 0.28 | -34 | 0.08 | ||
| PCG 0953+5710 | ||||||||
| A | 09 53 51.81 | +57 10 43.57 | 16.40 | 0.27 | 09 | 0.48 | ||
| B | 09 53 55.46 | +57 10 42.67 | 16.53 | 0.30 | -23 | 0.31 | ||
| C | 09 53 50.35 | +57 10 50.01 | 17.97 | 0.26 | -49 | 0.34 | ||
| D | 09 53 50.96 | +57 10 33.99 | 18.26 | 0.18 | 85 | 0.25 | ||
| PCG 1001+5001 | ||||||||
| A | 10 01 38.86 | +50 00 52.71 | 16.85 | 0.61 | -65 | 0.11 | ||
| B | 10 01 38.41 | +50 01 3.36 | 17.81 | 0.37 | -72 | 0.08 | ||
| C | 10 01 38.75 | +50 01 12.21 | 18.25 | 0.46 | 39 | 0.48 | ||
| D | 10 01 38.65 | +50 01 29.28 | 18.39 | 0.31 | -37 | 0.19 | ||
| PCG 1003+1904 | ||||||||
| A | 10 03 54.22 | +19 05 2.11 | 16.37 | 0.38 | 33 | 0.27 | ||
| B | 10 03 56.92 | +19 05 2.11 | 17.23 | 0.34 | 48 | 0.07 | ||
| C | 10 03 55.69 | +19 04 55.09 | 17.56 | 0.36 | 56 | 0.31 | ||
| D | 10 03 53.61 | +19 04 47.20 | 17.86 | 0.29 | 12 | 0.26 | ||
| PCG 1009+5603 | ||||||||
| A | 10 09 36.39 | +56 03 11.66 | 16.23 | 0.43 | -70 | 0.24 | ||
| B | 10 09 37.21 | +56 03 3.46 | 16.62 | 0.35 | -33 | 0.43 | ||
| C | 10 09 38.21 | +56 03 12.92 | 17.75 | 0.33 | -34 | 0.16 | ||
| D | 10 09 40.91 | +56 03 32.43 | 17.77 | 0.30 | -83 | 0.42 | ||
| PCG 1013+1945 | ||||||||
| A | 10 13 45.16 | +19 45 44.28 | 16.67 | 0.60 | 87 | 0.12 | ||
| B | 10 13 46.87 | +19 45 30.71 | 17.60 | 0.43 | -55 | 0.37 | ||
| C | 10 13 44.87 | +19 45 51.52 | 17.82 | 0.48 | -56 | 0.27 | ||
| D | 10 13 45.84 | +19 45 37.61 | 18.65 | 0.48 | 78 | 0.25 | ||
| PCG 1033+2253 | ||||||||
| A | 10 33 48.96 | +22 53 44.60 | 16.37 | -0.07 | 74 | 0.13 | ||
| B | 10 33 49.50 | +22 53 14.43 | 16.91 | 0.43 | -21 | 0.27 | ||
| C | 10 33 50.26 | +22 53 15.68 | 17.15 | 0.52 | 83 | 0.46 | ||
| D | 10 33 47.75 | +22 53 34.15 | 18.03 | 0.06 | 69 | 0.13 | ||
| PCG 1036+4450 | ||||||||
| A | 10 36 46.97 | +44 49 45.12 | 16.44 | 0.40 | 00 | 0.17 | ||
| B | 10 36 50.49 | +44 50 11.76 | 16.74 | 0.12 | 34 | 0.37 | ||
| C | 10 36 47.76 | +44 49 43.75 | 17.37 | 0.48 | 20 | 0.16 | ||
| D | 10 36 46.00 | +44 49 52.61 | 17.67 | 0.32 | -41 | 0.23 | ||
| PCG 1039+2749 | ||||||||
| A | 10 39 59.23 | +27 49 35.72 | 16.86 | 0.07 | -56 | 0.06 | ||
| B | 10 39 58.52 | +27 49 44.98 | 17.46 | 0.48 | -05 | 0.11 | ||
| C | 10 39 59.13 | +27 49 59.48 | 18.33 | 0.22 | -14 | 0.47 | ||
| D | 10 39 58.90 | +27 49 41.88 | 18.63 | 0.57 | -17 | 0.35 | ||
| PCG 1042+3926 | ||||||||
| A | 10 42 3.74 | +39 26 57.98 | 16.43 | 0.41 | 48 | 0.15 | ||
| B | 10 41 59.88 | +39 26 51.60 | 16.45 | 0.47 | 25 | 0.28 | ||
| C | 10 41 59.25 | +39 26 45.02 | 16.76 | 0.48 | 44 | 0.21 | ||
| D | 10 41 59.02 | +39 26 52.37 | 17.01 | 0.39 | 59 | 0.20 | ||
| PCG 1042+3639 | ||||||||
| A | 10 42 33.35 | +36 39 46.48 | 16.65 | 0.19 | 77 | 0.26 | ||
| B | 10 42 32.47 | +36 39 41.84 | 16.85 | 0.08 | 82 | 0.26 | ||
| C | 10 42 35.19 | +36 39 38.38 | 17.93 | 0.56 | 25 | 0.45 | ||
| D | 10 42 32.71 | +36 39 31.78 | 18.54 | 0.25 | -25 | 0.13 | ||
| PCG 1043+2817 | ||||||||
| A | 10 43 38.19 | +28 17 21.23 | 16.87 | -0.06 | 14 | 0.27 | ||
| B | 10 43 38.97 | +28 17 13.09 | 17.44 | -0.05 | -13 | 0.56 | ||
| C | 10 43 39.40 | +28 17 5.49 | 17.84 | 0.91 | -29 | 0.02 | ||
| D | 10 43 37.83 | +28 17 6.68 | 18.84 | 0.58 | -30 | 0.08 | ||
| PCG 1044+3536 | ||||||||
| A | 10 44 50.95 | +35 36 6.28 | 16.13 | -0.21 | 45 | 0.35 | ||
| B | 10 44 50.05 | +35 36 18.41 | 16.16 | 0.18 | -02 | 0.53 | ||
| C | 10 44 51.40 | +35 35 51.99 | 17.19 | 0.42 | -58 | 0.10 | ||
| D | 10 44 48.87 | +35 35 59.21 | 17.91 | 0.22 | -62 | 0.22 | ||
| PCG 1045+4931 | ||||||||
| A | 10 45 26.68 | +49 31 8.25 | 16.37 | 0.57 | -83 | 0.22 | ||
| B | 10 45 26.20 | +49 31 26.43 | 16.92 | 0.42 | -70 | 0.18 | ||
| C | 10 45 28.04 | +49 31 13.43 | 17.88 | 0.48 | 42 | 0.05 | ||
| D | 10 45 28.59 | +49 31 16.11 | 18.07 | 0.74 | -18 | 0.54 | ||
| PCG 1045+1758 | ||||||||
| A | 10 45 39.90 | +17 58 31.48 | 16.58 | 0.28 | 02 | 0.34 | ||
| B | 10 45 38.98 | +17 58 7.86 | 16.59 | 0.34 | -32 | 0.24 | ||
| C | 10 45 37.78 | +17 58 17.54 | 17.92 | 0.29 | -37 | 0.33 | ||
| D | 10 45 37.90 | +17 58 45.16 | 18.11 | 0.35 | 48 | 0.30 | ||
| PCG 1048+2213 | ||||||||
| A | 10 48 42.52 | +22 12 38.41 | 16.13 | 0.30 | 44 | 0.22 | ||
| B | 10 48 43.35 | +22 13 39.50 | 16.29 | 0.17 | 43 | 0.36 | ||
| C | 10 48 39.54 | +22 13 9.05 | 16.37 | 0.32 | -57 | 0.22 | ||
| D | 10 48 43.14 | +22 12 41.72 | 16.83 | 0.18 | 80 | 0.49 | ||
| PCG 1059+2728 | ||||||||
| A | 10 59 49.74 | +27 28 23.02 | 16.89 | 0.40 | -74 | 0.10 | ||
| B | 10 59 49.29 | +27 28 29.75 | 18.62 | 0.73 | -55 | 0.21 | ||
| C | 10 59 50.44 | +27 28 39.97 | 18.71 | 0.97 | 07 | 0.23 | ||
| D | 10 59 49.61 | +27 28 40.77 | 18.83 | 0.70 | -49 | 0.38 | ||
| PCG 1108+4021 | ||||||||
| A | 11 08 7.25 | +40 21 35.08 | 16.64 | 0.26 | 35 | 0.19 | ||
| B | 11 08 8.53 | +40 21 51.08 | 17.87 | 1.28 | -26 | 0.30 | ||
| C | 11 08 8.84 | +40 21 49.10 | 18.25 | 0.02 | 57 | 0.51 | ||
| D | 11 08 8.99 | +40 21 43.64 | 18.34 | 0.26 | -42 | 0.18 | ||
| PCG 1109+3114 | ||||||||
| A | 11 09 1.09 | +31 13 51.24 | 16.06 | 0.42 | -36 | 0.12 | ||
| B | 11 08 59.28 | +31 14 15.86 | 16.95 | 0.18 | -64 | 0.48 | ||
| C | 11 09 1.70 | +31 13 53.44 | 17.33 | 0.71 | 38 | 0.61 | ||
| D | 11 09 0.58 | +31 13 43.54 | 17.67 | 0.29 | -72 | 0.27 | ||
| PCG 1109+4133 | ||||||||
| A | 11 09 31.06 | +41 33 49.28 | 16.43 | 0.35 | 40 | 0.23 | ||
| B | 11 09 31.75 | +41 33 52.42 | 16.76 | 0.30 | 66 | 0.26 | ||
| C | 11 09 31.05 | +41 34 7.18 | 16.82 | 0.33 | 36 | 0.32 | ||
| D | 11 09 35.97 | +41 34 9.62 | 17.40 | 0.39 | -18 | 0.03 | ||
| PCG 1109+2033 | ||||||||
| A | 11 09 42.65 | +20 33 29.67 | 16.88 | 0.11 | -04 | 0.28 | ||
| B | 11 09 39.79 | +20 33 11.20 | 16.90 | 0.38 | 21 | 0.40 | ||
| C | 11 09 41.07 | +20 33 35.53 | 18.11 | 0.35 | -45 | 0.08 | ||
| D | 11 09 40.29 | +20 33 13.28 | 18.50 | 0.55 | -30 | 0.05 | ||
| PCG 1116+4200 | ||||||||
| A | 11 16 21.83 | +42 01 1.99 | 16.12 | 0.08 | 41 | 0.39 | ||
| B | 11 16 24.28 | +42 00 21.13 | 17.03 | -0.06 | 64 | 0.20 | ||
| C | 11 16 20.95 | +42 00 56.02 | 17.14 | 0.40 | 18 | 0.57 | ||
| D | 11 16 21.14 | +42 00 33.01 | 17.31 | 0.50 | -58 | 0.22 | ||
| E | 11 16 23.31 | +42 01 10.27 | 17.84 | 0.26 | 77 | 0.22 | ||
| PCG 1123+3559 | ||||||||
| A | 11 23 55.11 | +35 59 28.14 | 16.09 | 0.03 | 24 | 0.66 | ||
| B | 11 23 55.17 | +35 59 13.88 | 16.76 | 0.01 | 43 | 0.39 | ||
| C | 11 23 54.45 | +35 59 15.00 | 17.28 | 0.30 | -07 | 0.28 | ||
| D | 11 23 58.86 | +35 59 24.36 | 17.44 | 0.27 | 68 | 0.06 | ||
| E | 11 23 58.80 | +35 59 34.73 | 18.05 | 0.29 | -13 | 0.48 | ||
| PCG 1123+2128 | ||||||||
| A | 11 23 58.82 | +21 28 46.84 | 16.33 | 0.66 | 57 | 0.20 | ||
| B | 11 23 58.09 | +21 28 41.96 | 17.60 | 0.54 | -46 | 0.14 | ||
| C | 11 23 58.40 | +21 29 3.05 | 17.83 | 0.56 | -80 | 0.18 | ||
| D | 11 23 56.82 | +21 29 8.38 | 18.11 | 0.60 | -39 | 0.33 | ||
| PCG 1124+4140 | ||||||||
| A | 11 24 52.78 | +41 40 31.37 | 16.75 | 0.76 | 62 | 0.20 | ||
| B | 11 24 51.90 | +41 39 54.03 | 17.49 | 0.61 | 44 | 0.24 | ||
| C | 11 24 53.61 | +41 40 21.61 | 18.69 | 0.18 | -37 | 0.35 | ||
| D | 11 24 52.95 | +41 40 24.83 | 18.70 | 0.57 | -44 | 0.51 | ||
| PCG 1125+2528 | ||||||||
| A | 11 25 59.90 | +25 28 36.26 | 16.07 | 0.50 | -16 | 0.13 | ||
| B | 11 25 58.97 | +25 28 49.15 | 17.02 | 0.55 | 05 | 0.09 | ||
| C | 11 26 0.71 | +25 28 45.20 | 17.39 | 0.54 | 16 | 0.17 | ||
| D | 11 26 0.59 | +25 28 6.35 | 17.91 | 0.09 | 56 | 0.00 | ||
| PCG 1129+4226 | ||||||||
| A | 11 29 36.13 | +42 26 23.21 | 16.08 | -0.09 | -81 | 0.28 | ||
| B | 11 29 34.00 | +42 25 59.08 | 17.69 | 0.13 | -85 | 0.11 | ||
| C | 11 29 34.11 | +42 26 4.85 | 17.80 | 0.64 | 29 | 0.20 | ||
| D | 11 29 33.90 | +42 26 31.14 | 17.89 | 0.10 | -11 | 0.02 | ||
| PCG 1131+3825 | ||||||||
| A | 11 31 28.78 | +38 25 44.51 | 16.70 | 0.63 | -75 | 0.20 | ||
| B | 11 31 28.23 | +38 24 58.25 | 17.20 | 0.49 | -73 | 0.25 | ||
| C | 11 31 27.22 | +38 25 29.02 | 17.70 | 0.19 | -52 | 0.06 | ||
| D | 11 31 28.62 | +38 25 11.03 | 18.02 | 0.34 | 47 | 0.04 | ||
| PCG 1133+1705 | ||||||||
| A | 11 33 54.15 | +17 05 22.02 | 16.95 | 0.46 | 41 | 0.15 | ||
| B | 11 33 54.31 | +17 05 52.29 | 18.01 | 0.34 | -81 | 0.48 | ||
| C | 11 33 55.05 | +17 05 32.68 | 18.30 | 0.58 | 71 | 0.39 | ||
| D | 11 33 55.61 | +17 05 44.34 | 18.51 | 0.47 | -75 | 0.15 | ||
| PCG 1135+3714 | ||||||||
| A | 11 35 3.23 | +37 14 49.76 | 16.37 | 0.27 | -65 | 0.13 | ||
| B | 11 35 2.16 | +37 14 50.28 | 18.09 | 0.42 | 19 | 0.19 | ||
| C | 11 35 1.62 | +37 14 36.37 | 18.26 | 0.32 | 47 | 0.12 | ||
| D | 11 35 1.85 | +37 14 41.93 | 18.33 | 0.23 | 78 | 0.05 | ||
| PCG 1135+3042 | ||||||||
| A | 11 35 24.99 | +30 43 3.18 | 16.68 | 0.16 | -23 | 0.34 | ||
| B | 11 35 21.51 | +30 42 57.38 | 16.80 | 0.38 | -83 | 0.12 | ||
| C | 11 35 24.66 | +30 42 38.74 | 17.54 | 0.36 | -52 | 0.12 | ||
| D | 11 35 22.71 | +30 43 18.69 | 17.87 | 0.20 | -12 | 0.14 | ||
| E | 11 35 23.10 | +30 43 10.49 | 17.93 | 0.26 | 42 | 0.09 | ||
| PCG 1135+1340 | ||||||||
| A | 11 35 36.68 | +13 40 31.51 | 16.25 | 0.30 | 64 | 0.56 | ||
| B | 11 35 35.37 | +13 40 53.51 | 16.91 | 0.44 | 00 | 0.40 | ||
| C | 11 35 36.91 | +13 40 40.84 | 17.74 | 0.14 | -83 | 0.21 | ||
| D | 11 35 34.20 | +13 40 26.94 | 18.11 | 0.30 | -22 | 0.27 | ||
| PCG 1136+3252 | ||||||||
| A | 11 36 40.57 | +32 52 58.77 | 16.48 | 0.08 | 83 | 0.40 | ||
| B | 11 36 40.26 | +32 52 46.82 | 17.56 | 0.34 | -88 | 0.34 | ||
| C | 11 36 42.10 | +32 52 22.16 | 17.64 | -0.06 | -60 | 0.14 | ||
| D | 11 36 40.02 | +32 52 54.51 | 18.26 | 0.30 | 87 | 0.15 | ||
| PCG 1137+3234 | ||||||||
| A | 11 37 1.00 | +32 34 5.45 | 16.62 | 0.62 | 08 | 0.06 | ||
| B | 11 37 0.12 | +32 34 14.77 | 16.73 | 0.55 | -88 | 0.38 | ||
| C | 11 37 0.51 | +32 33 57.39 | 17.29 | 0.68 | 62 | 0.07 | ||
| D | 11 37 3.34 | +32 34 9.20 | 17.58 | 0.52 | -33 | 0.34 | ||
| PCG 1142+1407 | ||||||||
| A | 11 42 33.85 | +14 07 51.56 | 16.34 | 0.28 | 72 | 0.39 | ||
| B | 11 42 32.39 | +14 07 25.61 | 16.74 | 0.36 | 12 | 0.14 | ||
| C | 11 42 33.78 | +14 07 27.09 | 17.38 | 0.30 | 42 | 0.23 | ||
| D | 11 42 32.83 | +14 07 28.27 | 17.59 | 0.35 | 44 | 0.08 | ||
| PCG 1143+2153 | ||||||||
| A | 11 43 33.15 | +21 53 50.32 | 16.83 | -0.01 | -75 | 0.25 | ||
| B | 11 43 32.86 | +21 54 5.44 | 16.85 | 0.22 | 79 | 0.35 | ||
| C | 11 43 32.93 | +21 53 56.37 | 18.02 | 0.26 | -72 | 0.33 | ||
| D | 11 43 33.53 | +21 54 21.46 | 18.09 | 0.27 | 22 | 0.03 | ||
| E | 11 43 34.29 | +21 53 32.03 | 18.65 | 0.24 | -44 | 0.32 | ||
| PCG 1144+3053 | ||||||||
| A | 11 44 25.77 | +30 52 55.12 | 16.01 | 0.34 | 87 | 0.34 | ||
| B | 11 44 27.07 | +30 53 56.15 | 16.13 | 0.33 | -14 | 0.49 | ||
| C | 11 44 27.55 | +30 52 52.93 | 16.17 | 0.32 | -70 | 0.03 | ||
| D | 11 44 24.46 | +30 53 16.26 | 16.98 | 0.33 | 89 | 0.31 | ||
| PCG 1156+2415 | ||||||||
| A | 11 56 55.84 | +24 15 35.10 | 16.07 | 0.56 | 80 | 0.21 | ||
| B | 11 56 53.53 | +24 16 13.58 | 17.08 | 0.34 | -07 | 0.42 | ||
| C | 11 56 55.50 | +24 16 25.89 | 17.29 | 0.41 | -22 | 0.31 | ||
| D | 11 56 55.95 | +24 15 46.40 | 17.33 | 0.52 | 56 | 0.22 | ||
| PCG 1204+2149 | ||||||||
| A | 12 04 26.12 | +21 48 59.65 | 16.18 | 0.31 | 55 | 0.24 | ||
| B | 12 04 26.44 | +21 49 10.91 | 16.55 | 0.35 | -83 | 0.05 | ||
| C | 12 04 26.70 | +21 49 22.00 | 16.98 | 0.35 | 73 | 0.18 | ||
| D | 12 04 26.85 | +21 48 49.68 | 17.48 | 0.29 | 34 | 0.10 | ||
| PCG 1205+2029 | ||||||||
| A | 12 05 47.04 | +20 29 30.37 | 16.46 | 0.17 | 03 | 0.53 | ||
| B | 12 05 47.66 | +20 29 43.84 | 17.79 | -0.11 | 81 | 0.30 | ||
| C | 12 05 49.11 | +20 29 18.46 | 18.15 | 0.77 | -21 | 0.24 | ||
| D | 12 05 47.81 | +20 29 30.16 | 18.42 | 0.08 | 05 | 0.14 | ||
| PCG 1211+1344 | ||||||||
| A | 12 11 58.59 | +13 44 29.76 | 16.96 | 0.00 | 33 | 0.37 | ||
| B | 12 11 57.29 | +13 44 13.34 | 17.78 | 0.45 | -14 | 0.21 | ||
| C | 12 11 57.77 | +13 44 16.77 | 18.34 | 0.32 | -33 | 0.45 | ||
| D | 12 11 58.65 | +13 44 19.75 | 18.40 | 0.41 | 44 | 0.42 | ||
| PCG 1212+2235 | ||||||||
| A | 12 12 53.31 | +22 35 26.56 | 16.37 | 0.12 | 48 | 0.40 | ||
| B | 12 12 51.93 | +22 35 30.08 | 16.44 | 0.02 | 34 | 0.11 | ||
| C | 12 12 52.42 | +22 35 14.28 | 16.86 | 0.42 | -59 | 0.16 | ||
| D | 12 12 52.55 | +22 35 6.94 | 17.59 | 0.39 | -88 | 0.23 | ||
| PCG 1215+1534 | ||||||||
| A | 12 15 16.30 | +15 34 25.29 | 16.12 | 0.45 | 65 | 0.28 | ||
| B | 12 15 15.07 | +15 33 50.90 | 17.31 | 0.53 | -18 | 0.70 | ||
| C | 12 15 14.43 | +15 33 57.85 | 17.62 | 0.36 | -65 | 0.40 | ||
| D | 12 15 15.71 | +15 33 34.89 | 17.87 | 0.03 | -32 | 0.57 | ||
| PCG 1221+2352 | ||||||||
| A | 12 21 53.95 | +23 52 2.68 | 16.39 | 0.07 | -09 | 0.12 | ||
| B | 12 21 50.50 | +23 52 10.20 | 16.43 | 0.46 | 44 | 0.02 | ||
| C | 12 21 51.95 | +23 52 20.96 | 17.24 | 0.27 | 14 | 0.41 | ||
| D | 12 21 53.33 | +23 51 58.28 | 17.76 | 0.59 | -42 | 0.39 | ||
| PCG 1225+2531 | ||||||||
| A | 12 25 43.58 | +25 31 45.16 | 16.83 | 0.14 | -69 | 0.54 | ||
| B | 12 25 43.88 | +25 31 53.87 | 17.94 | 0.27 | 28 | 0.09 | ||
| C | 12 25 46.37 | +25 31 48.87 | 18.10 | 0.03 | -37 | 0.23 | ||
| D | 12 25 44.57 | +25 32 2.83 | 18.23 | 0.37 | 41 | 0.25 | ||
| PCG 1228+2725 | ||||||||
| A | 12 28 59.19 | +27 26 8.81 | 16.19 | 0.36 | -18 | 0.13 | ||
| B | 12 28 58.37 | +27 26 9.35 | 16.36 | 0.30 | -06 | 0.27 | ||
| C | 12 29 0.33 | +27 25 21.83 | 16.62 | 0.02 | -14 | 0.07 | ||
| D | 12 29 1.02 | +27 26 6.51 | 17.20 | 0.34 | 04 | 0.39 | ||
| E | 12 28 57.61 | +27 25 47.32 | 17.27 | 0.30 | 07 | 0.07 | ||
| PCG 1228+2725 | ||||||||
| A | 12 28 58.37 | +27 26 9.35 | 16.36 | 0.30 | -06 | 0.27 | ||
| B | 12 29 0.33 | +27 25 21.83 | 16.62 | 0.02 | -14 | 0.07 | ||
| C | 12 29 1.02 | +27 26 6.51 | 17.20 | 0.34 | 04 | 0.39 | ||
| D | 12 28 57.61 | +27 25 47.32 | 17.27 | 0.30 | 07 | 0.07 | ||
| PCG 1229+3640 | ||||||||
| A | 12 29 47.52 | +36 40 54.80 | 16.62 | 0.52 | -08 | 0.20 | ||
| B | 12 29 46.42 | +36 41 4.12 | 16.79 | 0.44 | -11 | 0.43 | ||
| C | 12 29 49.31 | +36 41 16.02 | 17.47 | 0.47 | 83 | 0.31 | ||
| D | 12 29 49.47 | +36 40 58.66 | 17.72 | 0.25 | 51 | 0.28 | ||
| E | 12 29 47.66 | +36 40 26.26 | 18.53 | 0.58 | -42 | 0.10 | ||
| PCG 1233+4105 | ||||||||
| A | 12 33 56.28 | +41 05 43.67 | 16.96 | 0.38 | 37 | 0.17 | ||
| B | 12 33 56.36 | +41 05 31.91 | 17.81 | 0.56 | -65 | 0.26 | ||
| C | 12 33 54.95 | +41 05 46.69 | 18.42 | 0.32 | 64 | 0.18 | ||
| D | 12 33 58.18 | +41 05 54.53 | 18.63 | 0.29 | -50 | 0.18 | ||
| PCG 1242+4217 | ||||||||
| A | 12 42 9.53 | +42 16 52.46 | 16.09 | 0.43 | -47 | 0.37 | ||
| B | 12 42 9.78 | +42 17 10.75 | 17.29 | 0.50 | -42 | 0.16 | ||
| C | 12 42 7.15 | +42 17 18.74 | 17.90 | 0.39 | -45 | 0.20 | ||
| D | 12 42 7.30 | +42 16 45.26 | 17.94 | 0.32 | 06 | 0.28 | ||
| PCG 1301+1915 | ||||||||
| A | 13 01 56.80 | +19 14 54.93 | 16.57 | 0.11 | 74 | 0.16 | ||
| B | 13 01 55.98 | +19 15 6.26 | 16.84 | 0.17 | -55 | 0.11 | ||
| C | 13 01 57.72 | +19 15 11.27 | 16.88 | -0.09 | 55 | 0.52 | ||
| D | 13 01 58.24 | +19 15 20.38 | 17.46 | 0.22 | 34 | 0.17 | ||
| PCG 1309+1553 | ||||||||
| A | 13 09 26.89 | +15 54 19.48 | 16.73 | 0.38 | 85 | 0.24 | ||
| B | 13 09 26.26 | +15 54 7.67 | 17.80 | 0.15 | 68 | 0.38 | ||
| C | 13 09 26.44 | +15 54 12.20 | 18.05 | 0.00 | 20 | 0.40 | ||
| D | 13 09 26.91 | +15 53 37.82 | 18.41 | 0.47 | 05 | 0.16 | ||
| PCG 1318+3217 | ||||||||
| A | 13 18 42.84 | +32 17 36.82 | 16.27 | 0.11 | -37 | 0.44 | ||
| B | 13 18 40.47 | +32 17 8.49 | 17.37 | -0.05 | -47 | 0.51 | ||
| C | 13 18 43.17 | +32 17 2.22 | 17.92 | 0.01 | -25 | 0.26 | ||
| D | 13 18 40.94 | +32 17 15.50 | 18.18 | 0.45 | 34 | 0.21 | ||
| PCG 1415+2920 | ||||||||
| A | 14 15 36.91 | +29 20 14.78 | 16.12 | 0.29 | -21 | 0.19 | ||
| B | 14 15 34.57 | +29 20 21.98 | 16.96 | 0.46 | 12 | 0.64 | ||
| C | 14 15 33.33 | +29 20 38.30 | 17.55 | 0.11 | -61 | 0.13 | ||
| D | 14 15 35.05 | +29 20 51.51 | 17.62 | 0.15 | 31 | 0.44 | ||
| PCG 1421+3530 | ||||||||
| A | 14 21 58.34 | +35 30 45.36 | 16.88 | 0.51 | -41 | 0.04 | ||
| B | 14 21 58.66 | +35 30 57.64 | 17.40 | 0.56 | 63 | 0.31 | ||
| C | 14 21 57.67 | +35 30 45.24 | 18.50 | 0.53 | -18 | 0.23 | ||
| D | 14 21 59.93 | +35 30 47.61 | 18.61 | 0.42 | 01 | 0.20 | ||
| PCG 1452+2759 | ||||||||
| A | 14 52 39.07 | +27 58 50.41 | 16.92 | 0.09 | 10 | 0.13 | ||
| B | 14 52 40.31 | +27 58 48.18 | 17.79 | 0.52 | 69 | 0.38 | ||
| C | 14 52 39.48 | +27 59 22.67 | 17.90 | 0.36 | 49 | 0.27 | ||
| D | 14 52 38.65 | +27 59 1.68 | 18.22 | 0.54 | -29 | 0.14 | ||
| PCG 1503+2805 | ||||||||
| A | 15 03 32.21 | +28 05 34.80 | 16.66 | 0.42 | -44 | 0.53 | ||
| B | 15 03 30.51 | +28 05 38.33 | 16.97 | 0.30 | -04 | 0.01 | ||
| C | 15 03 29.74 | +28 06 15.66 | 17.08 | 0.47 | 62 | 0.25 | ||
| D | 15 03 31.90 | +28 05 56.44 | 17.39 | 0.23 | 04 | 0.34 | ||
| PCG 1505+3603 | ||||||||
| A | 15 05 54.90 | +36 02 57.44 | 16.46 | 0.23 | -80 | 0.26 | ||
| B | 15 05 56.92 | +36 03 24.18 | 17.43 | 0.23 | 06 | 0.26 | ||
| C | 15 05 57.08 | +36 02 42.97 | 17.84 | 0.14 | 66 | 0.28 | ||
| D | 15 05 55.20 | +36 03 13.66 | 18.01 | 0.15 | 17 | 0.53 | ||
| PCG 1513+3604 | ||||||||
| A | 15 13 29.87 | +36 04 43.68 | 16.91 | 0.39 | 11 | 0.25 | ||
| B | 15 13 29.63 | +36 04 40.62 | 17.27 | 0.48 | 47 | 0.20 | ||
| C | 15 13 29.30 | +36 04 14.44 | 18.29 | 0.60 | -36 | 0.02 | ||
| D | 15 13 27.05 | +36 04 18.37 | 18.36 | 0.24 | -54 | 0.35 | ||
| PCG 1513+2756 | ||||||||
| A | 15 13 51.38 | +27 56 1.32 | 16.68 | 0.44 | 09 | 0.24 | ||
| B | 15 13 53.99 | +27 56 8.02 | 16.84 | 0.59 | -71 | 0.13 | ||
| C | 15 13 52.49 | +27 56 36.24 | 17.06 | 0.19 | 72 | 0.14 | ||
| D | 15 13 53.97 | +27 56 16.15 | 17.62 | -0.06 | 19 | 0.34 | ||
| PCG 1523+3100 | ||||||||
| A | 15 23 11.29 | +31 01 15.92 | 16.07 | 0.25 | -45 | 0.25 | ||
| B | 15 23 11.37 | +31 01 1.63 | 16.37 | 0.53 | -59 | 0.58 | ||
| C | 15 23 14.85 | +31 00 18.65 | 16.38 | 0.36 | 50 | 0.10 | ||
| D | 15 23 12.63 | +31 00 43.24 | 16.75 | 0.39 | 50 | 0.15 | ||
| E | 15 23 15.25 | +31 00 43.09 | 16.93 | 0.60 | 60 | 0.43 | ||
| PCG 1525+2956 | ||||||||
| A | 15 25 2.97 | +29 55 51.78 | 16.17 | 0.30 | -06 | 0.22 | ||
| B | 15 25 2.04 | +29 55 56.96 | 16.34 | 0.38 | 69 | 0.07 | ||
| C | 15 25 2.21 | +29 56 21.41 | 16.63 | 0.53 | 25 | 0.23 | ||
| D | 15 25 1.41 | +29 55 54.98 | 17.59 | 0.68 | 12 | 0.05 | ||
| PCG 1525+2824 | ||||||||
| A | 15 25 21.66 | +28 24 50.54 | 16.56 | 0.60 | 42 | 0.12 | ||
| B | 15 25 18.79 | +28 24 41.68 | 17.27 | 0.53 | -42 | 0.26 | ||
| C | 15 25 21.12 | +28 24 50.58 | 17.66 | 0.36 | -40 | 0.21 | ||
| D | 15 25 22.13 | +28 25 2.71 | 18.38 | 0.58 | 85 | 0.34 | ||
| PCG 1528+4235 | ||||||||
| A | 15 28 51.56 | +42 35 39.86 | 16.72 | 0.21 | -16 | 0.16 | ||
| B | 15 28 52.39 | +42 35 57.92 | 17.72 | 0.33 | 28 | 0.25 | ||
| C | 15 28 54.21 | +42 35 40.52 | 17.90 | 0.11 | 45 | 0.12 | ||
| D | 15 28 54.58 | +42 36 0.83 | 17.97 | 0.28 | 21 | 0.51 | ||
| E | 15 28 54.22 | +42 35 28.24 | 18.43 | 0.29 | -60 | 0.54 | ||
| PCG 1533+4938 | ||||||||
| A | 15 33 24.80 | +49 39 3.53 | 16.73 | 0.63 | 71 | 0.18 | ||
| B | 15 33 24.90 | +49 38 56.48 | 17.18 | -0.02 | -75 | 0.32 | ||
| C | 15 33 23.96 | +49 38 42.41 | 17.75 | 0.41 | 42 | 0.16 | ||
| D | 15 33 22.51 | +49 38 44.45 | 18.26 | 0.38 | 00 | 0.36 | ||
| E | 15 33 21.27 | +49 39 6.67 | 18.39 | 0.15 | 77 | 0.28 | ||
| PCG 1537+4507 | ||||||||
| A | 15 37 9.96 | +45 07 49.01 | 16.37 | 0.43 | 64 | 0.31 | ||
| B | 15 37 12.40 | +45 08 1.43 | 16.56 | 0.15 | 59 | 0.62 | ||
| C | 15 37 13.32 | +45 08 9.39 | 17.04 | 0.35 | -38 | 0.10 | ||
| D | 15 37 11.16 | +45 08 18.16 | 17.72 | 0.36 | 06 | 0.32 | ||
| PCG 1544+4125 | ||||||||
| A | 15 44 44.78 | +41 25 14.12 | 16.94 | 0.23 | -65 | 0.61 | ||
| B | 15 44 43.78 | +41 25 15.96 | 17.90 | 0.27 | -25 | 0.41 | ||
| C | 15 44 43.77 | +41 25 4.32 | 18.43 | 0.29 | -79 | 0.20 | ||
| D | 15 44 42.61 | +41 25 6.46 | 18.73 | 0.46 | 00 | 0.27 | ||
| PCG 1549+2756 | ||||||||
| A | 15 49 30.29 | +27 56 20.47 | 16.42 | 0.02 | 48 | 0.06 | ||
| B | 15 49 29.11 | +27 56 41.78 | 17.48 | 0.45 | 34 | 0.34 | ||
| C | 15 49 31.49 | +27 56 41.00 | 17.52 | 0.14 | -84 | 0.48 | ||
| D | 15 49 31.41 | +27 56 46.83 | 18.09 | 0.02 | -71 | 0.27 | ||
| PCG 1552+3344 | ||||||||
| A | 15 52 5.38 | +33 44 25.34 | 16.54 | 0.38 | -41 | 0.21 | ||
| B | 15 52 5.91 | +33 44 48.59 | 16.91 | 0.47 | -71 | 0.22 | ||
| C | 15 52 4.07 | +33 44 44.95 | 17.85 | 0.31 | 50 | 0.54 | ||
| D | 15 52 2.65 | +33 44 52.54 | 18.14 | 0.48 | 23 | 0.14 | ||
| PCG 1555+4604 | ||||||||
| A | 15 55 19.09 | +46 04 30.36 | 16.60 | 0.28 | 68 | 0.55 | ||
| B | 15 55 22.21 | +46 04 0.08 | 16.86 | 0.40 | -69 | 0.06 | ||
| C | 15 55 20.51 | +46 04 45.55 | 17.28 | 0.13 | -89 | 0.29 | ||
| D | 15 55 23.70 | +46 04 45.15 | 17.76 | 0.35 | -77 | 0.10 | ||
| E | 15 55 22.35 | +46 04 9.11 | 18.12 | 0.25 | 50 | 0.12 | ||
| PCG 1603+5221 | ||||||||
| A | 16 03 41.39 | +52 21 8.08 | 16.79 | 0.29 | -87 | 0.31 | ||
| B | 16 03 39.27 | +52 21 17.06 | 17.06 | -0.09 | -64 | 0.26 | ||
| C | 16 03 41.69 | +52 21 20.37 | 17.47 | 0.15 | 85 | 0.19 | ||
| D | 16 03 42.34 | +52 20 56.97 | 18.27 | 0.32 | -89 | 0.15 | ||
| PCG 1609+3111 | ||||||||
| A | 16 09 5.17 | +31 11 18.82 | 16.58 | 0.36 | -16 | 0.10 | ||
| B | 16 09 5.64 | +31 10 54.59 | 16.78 | 0.40 | 27 | 0.02 | ||
| C | 16 09 6.84 | +31 11 2.40 | 18.31 | 0.23 | -38 | 0.28 | ||
| D | 16 09 4.78 | +31 11 13.45 | 18.43 | 0.23 | 53 | 0.38 | ||
| E | 16 09 4.16 | +31 10 53.40 | 18.53 | -0.09 | 48 | 0.26 | ||
| PCG 1617+2758 | ||||||||
| A | 16 17 55.20 | +27 58 31.77 | 16.69 | 0.42 | -24 | 0.07 | ||
| B | 16 17 54.09 | +27 58 13.65 | 17.73 | 0.44 | -53 | 0.25 | ||
| C | 16 17 55.64 | +27 58 41.19 | 17.98 | 0.32 | -42 | 0.15 | ||
| D | 16 17 54.11 | +27 58 54.95 | 18.33 | 0.59 | -20 | 0.48 | ||
| PCG 1618+5531 | ||||||||
| A | 16 18 41.08 | +55 31 3.32 | 16.29 | 0.44 | 39 | 0.25 | ||
| B | 16 18 39.12 | +55 31 12.65 | 16.77 | 0.46 | -33 | 0.23 | ||
| C | 16 18 39.30 | +55 31 2.64 | 17.12 | 0.34 | -22 | 0.26 | ||
| D | 16 18 43.67 | +55 31 7.39 | 17.32 | 0.13 | 22 | 0.28 | ||
| PCG 1624+5446 | ||||||||
| A | 16 24 13.66 | +54 46 39.81 | 16.30 | 0.54 | 59 | 0.32 | ||
| B | 16 24 11.94 | +54 46 29.35 | 17.61 | 0.41 | 21 | 0.28 | ||
| C | 16 24 14.03 | +54 47 9.12 | 17.72 | 0.47 | -20 | 0.13 | ||
| D | 16 24 11.43 | +54 46 42.37 | 18.03 | 0.49 | 36 | 0.13 | ||
| PCG 1651+3129 | ||||||||
| A | 16 51 25.83 | +31 29 46.53 | 16.59 | 0.29 | 10 | 0.08 | ||
| B | 16 51 22.92 | +31 29 41.43 | 17.15 | 0.55 | 79 | 0.07 | ||
| C | 16 51 23.29 | +31 29 53.48 | 17.18 | 0.19 | -27 | 0.44 | ||
| D | 16 51 22.76 | +31 29 19.21 | 18.30 | 0.34 | 70 | 0.10 | ||
| PCG 1657+3529 | ||||||||
| A | 16 57 26.03 | +35 29 56.58 | 16.54 | 0.08 | 88 | 0.01 | ||
| B | 16 57 26.60 | +35 29 21.12 | 17.06 | 0.44 | 25 | 0.04 | ||
| C | 16 57 25.99 | +35 29 16.97 | 17.63 | 0.42 | 69 | 0.05 | ||
| D | 16 57 26.10 | +35 29 32.66 | 17.92 | 0.47 | -61 | 0.10 | ||
| PCG 1658+3705 | ||||||||
| A | 16 58 6.28 | +37 06 7.20 | 16.48 | 0.58 | -30 | 0.31 | ||
| B | 16 58 5.90 | +37 06 9.24 | 17.30 | 0.31 | -21 | 0.13 | ||
| C | 16 58 7.69 | +37 05 53.58 | 18.04 | 0.49 | 64 | 0.13 | ||
| D | 16 58 4.36 | +37 05 44.61 | 18.14 | 0.56 | -69 | 0.19 | ||
| PCG 1702+3335 | ||||||||
| A | 17 02 58.24 | +33 34 52.32 | 16.51 | 0.39 | 65 | 0.13 | ||
| B | 17 02 57.19 | +33 35 0.26 | 16.88 | 0.36 | -65 | 0.15 | ||
| C | 17 02 59.49 | +33 34 54.05 | 17.05 | 0.31 | 76 | 0.17 | ||
| D | 17 02 59.72 | +33 35 26.95 | 17.53 | 0.15 | 18 | 0.18 | ||
| PCG 1702+3331 | ||||||||
| A | 17 03 0.14 | +33 32 12.88 | 16.59 | 0.22 | -18 | 0.36 | ||
| B | 17 02 59.81 | +33 31 35.05 | 16.73 | 0.31 | -30 | 0.30 | ||
| C | 17 02 59.15 | +33 31 49.04 | 17.51 | 0.09 | -69 | 0.19 | ||
| D | 17 02 57.21 | +33 31 54.19 | 18.52 | 0.40 | -89 | 0.31 | ||
| PCG 1704+2818 | ||||||||
| A | 17 04 57.36 | +28 18 33.81 | 16.66 | 0.50 | -50 | 0.17 | ||
| B | 17 04 58.02 | +28 18 9.29 | 17.11 | -0.24 | 56 | 0.21 | ||
| C | 17 04 59.77 | +28 18 42.95 | 17.31 | 0.27 | -61 | 0.59 | ||
| D | 17 04 56.59 | +28 18 50.58 | 17.63 | 0.26 | 58 | 0.15 | ||
| PCG 1707+4203 | ||||||||
| A | 17 07 0.51 | +42 02 53.41 | 16.68 | 0.54 | -18 | 0.12 | ||
| B | 17 07 1.27 | +42 03 13.94 | 17.05 | 0.42 | 25 | 0.06 | ||
| C | 17 07 0.55 | +42 03 8.90 | 17.71 | 0.48 | 37 | 0.15 | ||
| D | 17 06 59.52 | +42 03 13.32 | 18.31 | 0.29 | 09 | 0.45 | ||
| PCG 1711+3946 | ||||||||
| A | 17 11 2.26 | +39 46 30.07 | 16.56 | -0.04 | 33 | 0.11 | ||
| B | 17 11 1.65 | +39 46 43.24 | 17.24 | -0.10 | -79 | 0.37 | ||
| C | 17 11 3.82 | +39 46 47.35 | 17.49 | -0.11 | -85 | 0.26 | ||
| D | 17 11 3.68 | +39 46 54.70 | 18.08 | -0.14 | -72 | 0.04 | ||
| PCG 1715+3545 | ||||||||
| A | 17 15 1.68 | +35 45 45.81 | 16.20 | 0.29 | 16 | 0.49 | ||
| B | 17 15 2.26 | +35 45 46.87 | 16.49 | -0.05 | -13 | 0.30 | ||
| C | 17 15 1.19 | +35 45 52.89 | 17.07 | 0.15 | 54 | 0.19 | ||
| D | 17 15 2.27 | +35 45 4.59 | 17.35 | -0.07 | 24 | 0.49 | ||
| PCG 1726+3848 | ||||||||
| A | 17 26 31.34 | +38 47 53.08 | 16.98 | 0.74 | -80 | 0.32 | ||
| B | 17 26 30.66 | +38 48 22.71 | 17.30 | 0.50 | -69 | 0.23 | ||
| C | 17 26 30.57 | +38 48 7.52 | 18.18 | 0.44 | 33 | 0.35 | ||
| D | 17 26 32.21 | +38 48 5.01 | 18.91 | 0.51 | 29 | 0.36 |