Dust-to-gas ratios in the starburst regions of luminous infrared galaxies
Abstract
We investigate the properties of dust and dust-to-gas ratios in different starburst regions of luminous infrared galaxies (LIGs). We refer to the sample of seven LIGs recently observed in the mid-infrared by Soifer et al. (2001) using the Keck telescopes with spatial resolution approaching the diffraction limit. These seven objects are among the closest LIGs and have been classified as starburst galaxies from optical spectroscopy. Our goal consists in modelling the continuum spectral energy distribution (SED) of each galaxy, particularly in the infrared range. Models are further constrained by observed emission-line ratios in the optical range. The multi-cloud models consistently account for the coupled effect of shock, photoionization by hot stars, and diffuse secondary radiation from the shock-heated gas. Emission from clouds in the neighbourhood of evolved starbursts and with high shock velocities ( 500 ) explains both the bremsstrahlung and reradiation from dust in the mid-infrared. Clouds with lower velocity (100 ) and corresponding to younger starbursts also contribute to both line and continuum spectra. Both low- and high-velocity clouds are thus present in nearly all the sample galaxies. For all the galaxies, an old stellar population is revealed by black body emission in the optical-NIR range. Dust-to-gas ratios vary in different regions of individual galaxies.
keywords:
galaxies: starburst – galaxies: ISM – galaxies: evolution – infrared: galaxies – shock waves1 Introduction
IRAS surveys have revealed that a significant fraction of extragalactic objects produce the bulk of their radiation at far-infrared (FIR) wavelengths (Soifer 1986; Sanders & Mirabel 1996 for a recent review). Imaging surveys of luminous infrared galaxies (LIGs; ) showed that the vast majority of these objects is morphologically disturbed, with spatial structures indicative of galactic mergers (e.g. Sanders et al. 1988; Clements et al. 1996).
The interest on the nature of LIGs grew during the last few years as they may represent an important step in the global process of galaxy formation and evolution. Indeed, strong evolution in the space density of LIGs has been detected in the deep mid-infrared (MIR; Taniguchi et al. 1997; Aussel et al. 1999) and FIR surveys (Kawara et al. 1998; Puget et al. 1999) with ISO satellite. Reports from the first deep sub-millimeter (sub-mm) surveys with SCUBA (Smail et al. 1997; Hughes et al. 1998; Barger et al. 1998; Eales et al. 1999) showed that the space density of LIGs at high redshift () appears sufficient to account for nearly all of the FIR/sub-mm background radiation (e.g. Barger, Cowie & Sanders 1999). It seems clear that detailed studies of nearby LIGs are a required first step in order to better understand their high-redshift counterparts, and in particular to reveal the nature of the dominant energy source responsible for their enormous FIR luminosity (Lutz & Tacconi 1999). Results from recent studies at MIR (e.g. Genzel et al. 1998) and radio wavelengths suggest that the majority of LIGs are powered predominantly by young and hot stars rather than by active galactic nuclei (AGNs). However, there is growing evidence from optical/near-infrared (NIR) spectroscopy that the frequency of AGN occurrence among LIGs increases with increasing FIR luminosity (e.g. Veilleux et al. 1995; Kim, Veilleux & Sanders 1998; Veilleux, Sanders & Kim 1999).
In this paper, we refer to the sample of seven LIGs recently observed in the MIR (from 8 to 18 m) by Soifer et al. (2001, hereafter S01) using the Keck telescopes with spatial resolution approaching the diffraction limit. These seven objects are among the closest LIGs and have been classified as starburst galaxies from optical spectroscopy (Armus et al. 1989; Veilleux et al. 1995).
S01 give some important results by the analysis of the MIR data (S01, Table 3) about, sizes, temperatures, and luminosities in the different sources. We would like, however, to explain the results by modelling the emitting clouds or clumps in dusty regions surrounding the starbursts. Dust plays a major role in IR emission. We will thus investigate the distribution of dust in the different starburst regions within the galaxies, and dust-to-gas properties on small local scales. For sake of consistency, we will focus on both the continuum radiations and the optical emission lines from each galaxy of the sample. When the spectra are integrated, we will try to distinguish the contributions of clouds with different physical conditions, photoionized by starbursts of different ages.
The models adopted up to now for the calculation of dust emission in the IR (e.g. Siebenmorgen et al 1999) accounted for heating of dust by star radiation in starbursts, and for power-law radiation in AGN. The grains are destroyed by photo-dissociation. However, in the turbulent regime created by the starburst, shocks are playing a major role by heating gas and dust and by leading to sputtering of the grains. We will focus on the clouds in the very starburst regions. Therefore, in our models we account for the coupled effect of radiation from an external source and for the shocks.
Gas and dust mutually heat each other by collisions in shock turbulent regimes. Regarding the spectral energy distribution (SED) of the continuum, recall that the frequency corresponding to the dust reradiation peak depends on the shock velocity (e.g. Viegas & Contini 1994). At high shock velocities, the grains will reach high temperatures in the immediate post shock region, before being destroyed by sputtering, so that dust reradiation will peak in the MIR, whereas, at low velocities, the peak appears in the FIR.
Actually, our goal consists in modelling the continuum SED of each galaxy in the S01 sample, particularly in the IR range, adopting the data in the MIR presented by S01 and completed with data from NED111The NASA/IPAC Extragalactic Database (NED) is operated by the Jet Propulsion Laboratory, California Institute of Technology, under contract with the National Aeronautics and Space Administration (see Appendix B for the list of references) at other wavelengths. Indeed, the data from the NED show different precisions and different apertures, leading to a large scattering. The S01 data, however, refer to the IR range and hardly include radiation from the gas, so NED data are included in our modelling in order to determine the gas-to-dust ratio.
In most of the objects of the sample different fractions of flux from the old star population background are included in the near-IR (NIR) data, as generally found in AGN and starburst galaxies (Viegas & Contini 2000). We will try to fit the data corresponding to the lowest flux by emission from the clouds in the objects (e.g. NGC 1614, NGC 2623, NGC 3690), and those corresponding to the highest flux by the black body emission. In fact, the data from the NED in the NIR cluster within the black body curve.
The models which explain the continuum SED are constrained by the agreement with observations of the emission-line spectra (Armus et al. 1989; Veilleux et al. 1995). The spectra are quite poor in number of emission lines, however, being the most significant ones ([OIII] 5007, [OI] 6300, [NII] 6584, and [SII] 6716+6731) they are enough to constrain the models.
To obtain a basis for modelling, we have compared the observed emission-line ratios of each galaxy with the models presented in Contini & Viegas (2001a, hereafter CV01), where model calculations of line spectra in the UV-optical-IR ranges are presented. The results are obtained by the SUMA code (Viegas & Contini 1994) which, besides the line and continuum spectra emitted by the gas, also calculates reradiation by dust. Dust features are summarized in Sect. 2. The models in CV01 are all calculated adopting a dust-to-gas ratio by mass. In many cases the value will be increased to fit the SED in the IR. The line ratios will then change accordingly, because a high in the postshock region, before complete destruction of the grains by sputtering, acts as an increased density, speeding up the cooling processes. This will lead to a refinement of the models in order to obtain the best fit to the observational data. The models are described in Sect. 3. Recall that modelling the line and continuum spectra simultaneously implies cross-checking them (Sect. 4) until a fine tuning is obtained (Contini et al. 1998). The models adopted in this work are described and referred to the models of CV01 in Appendix A (Table A1). Discussion of results and concluding remarks appear in Sect. 5.
2 About dust
Emission from a starburst is generally calculated by computing the radiative transfer in the galactic nuclei under the assumption of spherical symmetry (Siebenmorgen, Krugel, & Zota 1999), or treating the starburst (Efastathiou et al. 2000) as an ensemble of optically thick giant molecular clouds centrally illuminated by recently formed stars. The dust-to-gas ratio is not required for computing the radiation transfer models.
Hildebrand (1983) discussed direct methods to determine cloud and dust masses and derived a lower limit ( 60) for g/d (where g=Mgas and d=Mdust) calculating Mgas from visual extinction and Mdust by thermal emission. A rough g/d 100 was estimated, given the errors for the implied coefficients (dielectric, etc).
Generally, three population of grains are adopted to fit the average IS extinction curve. 1) large grains of silicate and amorphous carbon, with a volume ratio of VSi/VaC =1.4 (Siebenmorgen et al. 1999) and a power-law size distribution, a-q with q=3.5 (100a2500 A) provide the bulk of emission responsible for 9.7 and 18 m resonance. 2) Small graphite particles corresponding to q=4 (10a100 A) emit primarily at MIR wavelengths. Being small, they show dramatic fluctuations in temperature. 3) PAH carriers of IR features correspond to single molecules with 25 carbon atoms and clusters of 10-20 molecules. The small graphite and PAH are underabundant with respect to ISM by factors of 10 or more.
Cold dust or cirrus emission results from heating by the IS radiation field, warm dust is associated with star formation regions, and hot dust appears around an active nucleus (Helou 1986). Rowan-Robinson & Crawford (1989) found that the ratio of the starburst emission to the cirrus emission is 2 to 1. PAHs are responsible for no more than 22 % of the total 3-1100 m emission (Dale et al. 2001), the exact percentage depending on the activity level of the interstellar medium.
Diffuse ISM radiates strongly in 3.3, 6.2, 7.7, 8.6, 11.3, 12.7 m and in atomic emission lines (Spoon et al. 2002), the relative strengths of the different PAH emission bands being a strong function of the PAH size: small PAH radiates strongly at 6.2 and 7.7 m, while larger PAHs emit most of their powers at increasingly long wavelengths. Moreover, laboratory simulations predict a double peaked bump in the 18-23 m wave band, due to the morphological transformation of ice on grain mantles (Contini 1990).
A broad absorption band due to the Si-O stretching mode in amorphous silicates, centered at 9.7 m is also commonly detected in galaxies (Spoon et al 2002). The center of the silicate absorption coincides with the gap between the 6.2 and 8.6 m and 11.3-12.8 m PAH complexes. Therefore, it is not clear whether the 9.7 m flux minimum should be interpreted as the ”trough” between PAH emission features or as strong silicate absorption, or a combination of the two. A strong silicate feature is often accompanied by MIR absorption features, due to molecules frozen in ice mantles which leads to a deep and broad 3.0 m water ice feature. The interplay of 6.0 m water ice and 5.25,5.7, 6.25 PAH emission is shown in many spectra (Spoon et al 2002).
Turbulent and hostile environments in galaxies often destroy the molecular material that resides in or close to these regions. PAHs are likely to be destroyed, or severely dumped in localized regions of high heating intensity such as the regions near OB associations (Dale et al. 2001), and may evaporate in a strong UV radiation field (Siebenmorgen et al. 1999). Mid-IR flux may also be diminished toward regions of high extinction in AGN-dominated galaxies, but it is unclear whether significant obscuration also occurs for starburst galaxies. Moreover, sputtering of grains throughout shock fronts is efficient for shock velocities in the range suitable to starburst galaxies and AGN (Viegas & Contini 1994). In conclusion, PAH emission comes from the extended region of the galaxy.
Coronal lines eventually blended with the bands of PAH and water ice (Contini & Viegas 2001) are the following : [MgVIII] 3.03 m, [SiIX] 3.9 m, [MgVII] 5.5 m, [MgV] 5.6 m, [NeVI] 7.6 m, [FeVII] 7.8 m, [ArIII] 8.99 m, [FeVII] 9.52 m, [SIV] 10.54 m, [NeII] 12.8 m, etc. (see also Sturm et al 2002) We have included lines which do not exactly correspond to the bands, because large FWHM of line profiles, corresponding to high velocities, lead to blending with the closer bands. Mg and Si are easily locked up in dust grains. In this case their lines in the MIR would not interfere with the bands. On the other hand, Ne is not adsorbed in grains due to its atomic configuration, therefore, the Ne lines coexist with dust features.
Model results (CV01) regarding black body radiation from stars show that [NeII] are strong for shock velocities 100 and U 10, while [ArIII] may be detected for between 200 and 500 and decreases at higher velocities, independently from the black body intensity flux.
Shock dominated models (Contini & Viegas 2001b) show that [NeII] is strong for =100 . High ionization lines appear for 200 , particularly [NeVI], increasing at = 500 , [NeVI] and [NeII] being the strongest at =300 . The high level lines [MgVIII], [SiIX], [MgVII] are strong for =1000 , particularly, [SiIX] 3.9 m.
3 Composite models


The SUMA code is described in CV01 and in Viegas & Contini (1994). The input parameters are the following: the shock velocity, , the preshock density, , the preshock magnetic field, , the starburst age, , the ionization parameter, (in number of photons / number of electrons), the geometrical thickness of the clouds, D, and the dust-to-gas ratio, . Relative abundances to H of He, C, N, O, Ne, Mg, Si, S, Ar, and Fe are cosmic (Allen 1973).
In our models we refer to clouds close to the starburst and therefore affected by radiation and shocks with velocities 100 .
Dust is collisionally heated by the gas across the shock front and downstream. The temperature of dust follows the temperature of gas and can reach very high temperatures in the postshock region, for 100 (Figs. 1, left diagram).
The models in Fig. 1 (left) are the following: =1000 , =1000 (solid lines); =500 , =300 (long-dashed lines); =300 , =300 (short-dashed lines); and =100 , =100 (dotted lines). For all the models = 1 pc, = 10-4 gauss and are adopted.
The distribution on grain size is automatically derived by SUMA which calculates sputtering in the different zone downstream of the shock. The sputtering rate depends on the gas temperature, that is 2 in the immediate postshock region. In Fig. 1 (right diagram) the distribution of grain radius downstream in two cases of relative strong (=500 ) and weak (=100 ) shocks is shown for silicate grains with an initial radius a0= 0.2 and 0.06 m. In the high velocity case the sputtering rate is so high that grains with a0= 0.06 m are rapidly destroyed downstream. So, only grains with large radius (a0 0.1 m) will survive downstream, while small grains are completely sputtered. On the other hand, the grains survive downstream of low velocity shocks. Graphite grains are more sputtered than silicate grains for T=106 K (Draine & Salpeter 1979) Therefore, in regions where strong shocks are created by the starburst, we will consider relatively large grains, e.g. silicate grains with an initial radius of 0.2 m. Small grains (e.g. PAH) survive in the extended galactic regions on scales of hundred pc and lead to the features that appear in the spectral energy distribution (SED).

In Fig. 2 the SED of bremsstrahlung radiation and emission by dust in the IR, corresponding to models in Fig. 1 (left diagram), is presented. Some significant wavelengths (in m, top scale) are also plotted (thin dotted lines).
The peaks of dust reradiation in the IR correspond to maximum grain temperatures of 314 K, 199 K, 143 K, and 41 K for = 1000, 500, 300, and 100 , respectively.
Notice that the bump corresponding to = 100 is wide, because the grains are less sputtered for low and a large region of grains emitting at low temperature is present downstream (Fig. 1 left). The flux ratios between the dust bumps and the bremsstrahlung curve will change adopting different values. In particular, the flux from a starburst region at 2.3 m hardly corresponds to dust, while for a high the flux at 3.2 m accounts for both gas and dust emission.
The clouds in the surrounding of a starburst are heated and ionized by the light of the stars with a distribution which depends on age (Cid Fernandes et al. 1992), and by secondary diffuse radiation from the slabs of the gas heated by the shock. The clouds move outwards from the starburst and shocks form on the outer edge of the clouds. Radiation heating leads to gas temperatures below K, while gas heated by the shocks can reach relatively high temperatures, depending on the shock velocity (Contini & Viegas 2000).
The continuum emissions by dust and gas in the different frequency ranges must be consistent. Therefore, we will adopt the following procedure. First we will model the line emission spectra from the gas and then will use the same models to calculate the continuum SED in all the ranges. The emission of dust in the IR depends on the intensity of the star cluster flux, on mutual cooling and heating by collision with gas, on the size of the grains which survive from sputtering, and on the dust-to-gas ratio.
In previous papers (e.g. Viegas, Contini, & Contini 1999, Contini, Viegas, & Prieto 2002) it was shown that fragmentation of clouds in shocked regions results from R-T instability in a turbulent regime. Therefore, the spectra emitted from the different regions of a galaxy are modelled by multi-cloud models, i.e. by models which account for the summed spectra emitted from single clouds adopting relative weights. The relative weight, which are defined by the best fit to the data, account for the relative number of clouds in the conditions determined by the model, and for the fraction of the emitting surfaces Throughout modelling we will show the best agreement to the data of single cloud models in the different wavelength domains in the SED, in order to explain the role of each type of cloud.
Indeed, the models leak a small scale fit to dust IR features corresponding to cirrus and extended ISM regions which should be added. Nevertheless, modelling gas and dust in a consistent way, provides a rough information of dust distribution in the different galaxies. The dust-to-gas ratios will be derived by the fit of the dust infrared bump consistently with bremsstrahlung at higher frequencies.
4 Modelling the sample


In the following, we model the individual SED and optical emission-line ratios of S01’s sample of galaxies.
4.1 VV114
| line | obs | M1 | M2 | M3 | M4 | M5 | SUMN |
|---|---|---|---|---|---|---|---|
| [OII] 3727 | 0.81 | 9.(-4) | 2.6 | 2.7 | 25. | 0.52 | |
| [OIII] 5007+4959 | 1.6 | 1.44 | 1.63 | 2.21 | 3. | 15.3 | 1.66 |
| [OI] 6300+6360 | 0.13 | 0.043 | 0.0 | 0.66 | 2.5 | 0.5 | 0.177 |
| [NII] 6584+6548 | 1.0 | 0.87 | 2.3(-4) | 2.64 | 7.14 | 8.7 | 0.79 |
| [SII] 6716+6731 | 0.71 | 0.08 | 5.3(-6) | 3.47 | 7.8 | 7.6 | 0.58 |
| [SII] 6716/6731 | 1/0.28: | 0.47 | 0.47 | 1.06 | 1.2 | 0.8 | 0.53 |
| H () | - | 0.664 | 0.037 | 0.016 | 0.044 | 0.0025 | 0.25 |
| w | - | 0.033 | 1. | 0.133 | 0.083 | 0.0167 |
| line | obs | M6 | M7 | M8 | M3 | SUMS |
|---|---|---|---|---|---|---|
| [OII] 3727 | 0.14: | 0.8 | 0.013 | 0.014 | 2.6 | 0.6 |
| [OIII] 5007+4959 | 2.9 | 3.48 | 3.97 | 4.0 | 2.21 | 3.5 |
| [OI] 6300+6360 | 0.1 | 0.064 | 0.0 | 6.(-8) | 0.66 | 0.15 |
| [NII] 6584+6548 | 0.8 | 0.61 | 0.007 | 0.0075 | 2.64 | 0.63 |
| [SII] 6716+6731 | 0.67 | 1.99 | 0.001 | 0.0012 | 3.5 | 0.9 |
| [SII] 6716/6731 | 1/0.71 | 0.95 | 0.92 | 0.92 | 1.06 | 0.95 |
| H () | - | 0.12 | 0.12 | 0.016 | 0.187 | 0.12 |
| w | - | 0.067 | 0.0167 | 0.0167 | 1. | - |
VV114 is a pair of interacting galaxy, particularly interesting for its high infrared luminosity (10) and high FIR-to-visible flux ratio. VV 114 is composed of two stellar components separated by 15″, designated by VV 114 E and VV 114 W (Knop et al 1994). The extreme NIR colors of VV 114 E indicate the presence of a large concentration of dust, while VV 114 W is relatively unobscured at optical wavelengths (Knop et al. 1994). The near-infrared color-color diagram presented by Doyon et al. (1995) shows that ”the intrinsic SED of VV114 is affected by three components, namely blue stars, nebular emission, hot dust, and extinction”.
In Tables 1 and 2 the observed emission-line ratios in VV 114 N and VV 114 S, respectively, are compared with model calculations, and in Figs. 3 and Fig. 4 the SED of the continuum for VV 114 E (see Soifer et al. 2001 for the nomenclature) is presented. Filled squares refer to the MIR photometry in a 4″ diameter beam (Soifer et al. 2001), open squares to the NIR, IRAS and radio-cm data found in NED.
We show in Figs. 3 the modelling of data in the different wavelength ranges in three different diagrams (top, middle, and bottom), in order to explain our procedure, while in Fig. 4 the best fit of the data by a multi-cloud model is shown. The models are not summed up, in order to better understand the role of each single-cloud model.
Table 1 shows that model M1 explains roughly the emission-line ratios. Indeed, the [OIII]/[OI] ratio is relatively high, but is lower than for other models. This model could explain the SED (Fig. 3 top) adopting , while the models in CV01 were all calculated with . Notice, however, that the datum representing emission at 3.2 m strongly constrains the modelling, and a more consistent fit to bremsstrahlung emission as well as to dust reradiation is presented in Fig. 3 (middle), where model M2 (solid lines) similar to M1 was run with and to recover the fit of the line ratios. Models M1 and M2 correspond to a stellar population age of 3.3 Myr, a relatively high shock velocity ( = 500 ) and a preshock density = 300 . Kim et al. (1995) give FWHM 400 for the [OIII] line profile of VV 114. Models with a higher age and/or with a reduced geometrical thickness give similar results regarding the continuum, because the effect of the shock prevails on radiation at high .
The NIR data from the NED show that there is a non negligible contribution from an old stellar population of about 5 000 K (Fig. 3 middle, dotted line).
Although model M2 explains satisfactorily S01 data both in the bremsstrahlung and in the MIR ranges, the contribution of high velocity ( = 1000 ) high density ( = 1000 ) dusty clouds with (short-dashed lines) is invoked to explain MIR data at higher frequencies. The maximum temperature of the grains corresponding to the high velocity shock is 330 K. This model is radiation-bound and the temperature of the gas in the downstream region behind the shock never drops below K. Therefore, these clouds do not contribute to the optical lines.
The IRAS FIR data indicate that lower shock velocities are also present in the emission regions. IRAS data at about 100 m can be explained by models with = 100 and = 100 (Fig. 3 bottom). Model M3 is selected because of very high [OI]/H and [SII]/H emission-line ratios which could improve the fit of the summed spectrum (SUMN). Also in this case model M4 similar to M3 but with a high value has been adopted (long dashed lines)), in agreement with the high ratio reported by Frayer et al. (1999). The emission-line ratios which result from M3 and M4 are very different. Moreover, the emission at 60 m can be better explained by emission from hotter dust, i.e. a shock of = 200 must be used (short dash-dot lines in Fig. 3 bottom). The corresponding line ratios appear in column 7 (M5) of Table 1 . The low - models correspond to a younger population ( = 0.0 Myr), while model M1 corresponding to an older population shows high - in agreement with Viegas, Contini & Contini (1999), namely, that an old starburst corresponds to high .
The two sub-mm data points at 450 m and 850 m (from Frayer et al. 1999) show that the FIR bump intensity corresponding to the low velocity models must be reduced. Considering that there is a single datum (at 3.2 m) which constrains the models, and consistently with the line spectra, we reduce both gas and dust emission of model M4. The fit of the dataset available for VV 114 E is presented in Fig. 4. The two radio data follow the trend of synchrotron emission, confirming the presence of strong supernova and stellar winds in the galaxy.
Model M5 overpredicts the datum at 850 m. Dust becomes optically thick for = (d/g) n Qabs 1. Adopting a 0.02 m(radius of the sputtered grains), d/g= 6 10-13 (by number), n= 3 103 (density downstream for model M5), and Qabs =2 (Contini 1992), the absorbing length, , results 2 1019 cm, similar to the geometrical thickness of the clouds. Notice that the grain radius, the temperature, the density, etc change downstream with distance from the shock front, therefore, absorption changes accordingly.
In Fig. 5 we compare the MIR spectra of VV 114 separate nuclei observed by Soifer et al (2002, fig. 1)) with MIR ISOCAM broad-band photometry by Le Floc’h et al. (2002). The depression at 10 m in the spectrum of VV 114ENE (open squares) is deeper than for VV 114ESW (filled squares) (Soifer et al 2002). VV 114NE also shows the peak at 11.3 m and the shoulder at 8.6 m, characteristic of PAH. Le Floc’h et al. broad band observations in the nucleus (open triangles, connected by a solid lines) and diffuse emission (large filled circles connected by a long-dashed line) are directly compared with the data for VV 114ENE and show a rough high scale similarity, however, they leak the substructures at about 9.5 and 11 m. Le Floc’h et al observations of VV 114W (knot 2) which correspond to filled triangles, connected with a dotted line, fit Soifer et al (2002) VV 114ESW data at wavelengths 9 m but leak the shoulder by PAH at lower wavelength.
The MIR data from the Keck telescope by Soifer et al. (2001) VV114E(4) (asteriks) are given for comparison in Fig. 5 as well as the models which better explain them (Fig. 3, middle diagram). The data follow the trend of Soifer et al (2002) for VV 114ESW at large wavelength. Recall that absorption reduces the emission corresponding to the high velocity model (=1000 ) (short dashed line) more than the emission corresponding to =500 (solid thick line), because densities downstream increase with and .
PAH emission is a consistent fraction fPAH of dust emission in the IR because their features are observed. Considering that the flux of silicate dust, integrated in the IR domain, is evaluated by models to 103 , and adopting that PAH emission is 20% of the total IR luminosity, 1011.3 L⊙ (Sect. 2), the radius of PAH extended region is 37/(fPAH)1/2 pc. PAH emission is observed up to some hundred pc scales, therefore fPAH 0.01 and hardly affects model physical processes in our model calculations.
About the MIR domain, PAH flux from Siebenmorgen, Krügel, and Laureijs (2001, fig. 6) integrated between 5 and 12 m is 10-9 , while the flux in the same wavelength range calculated with our high velocity model which peaks in the MIR, is 2 10-9 . the discrepancy is negligible, considering the approximation of modelling and indicates that PAH emission and silicate dust emission are similar.
Optical spectroscopic data for VV 114 S (from Veilleux et al. 1995) are compared with models in Table 2. Notice that the [OIII]/H emission-line ratio is higher than in VV 114 N. To reproduce such a ratio a stellar population with an age of 2.5 Myr is adopted (models M6, M7, and M8). The model corresponding to a young population (M3) is also added to better fit the data. Tables 1 and 2 refer to VV 114 N and S respectively, while the continuum data refer to VV 114 E. So we cannot refer to well located regions and the continuum relative to star with Myr is also shown in Fig. 3 (long dash-dot).
The weighted sum of the single contributions appears in the last column of Tables 1 and 2. We have added also the models calculated with a low , as they appear in CV01. In fact, dust has a clumpy distribution and cannot affect in the same way the emission from the overall galaxy. The weight adopted for each single model are given in the last row of Tables 1 and 2. They correspond roughly to those obtained to fit the SED of the continuum. Actually, the large range of emission-line ratios, corresponding to the different models, indicate that many different physical conditions coexist in VV 114.
To determine the amount of dust in the different regions of VV 114. specific emission in the different regions are compared with model results in Fig. 4. The data in the NIR domain are few, moreover, they are explained by black body emission from the old stellar population background rather than by bremsstrahlung. So, we will use the relative weights, which will indicate in this case the intensity of dust emission in the NIR. Therefore, we normalize the relative weight w of model M2, which best fit the data relative to dust emission, to that of model BB representing the old stellar population, corresponding to black body emission of K, in the different regions. Table 3 shows w in columns 2 and 3 for M2 and BB, respectively, and the ratio of the weights in column 4. In the second row we refer to the VV 114 E region represented in Fig. 3. Rows 3, 4, and 5 refer to regions whose SED is represented in Fig. 4 diagrams. The w referring to the IRAS data appear in the last row.
We consider now the ratios w(M2)/w(BB) (Table 3, last column), in order to compare the relative amount of dust in the different regions of VV 114. Adopting a homogeneous distribution of old stars, the results suggest that VV114 E SW and NE regions show about the same amount of dust, while W4 region is less dusty, in agreement with the results of Knop et al. (1994), namely that VV 114 W is relatively unobscured at optical wavelength. IRAS data (Fig. 4 right diagram) show a higher flux in all domain, besides less dust than for VV114 E.


| region | log(w(M2)) | log(w(BB1)) | w(M2)/w(BB1) |
|---|---|---|---|
| VV 114 E | -11.05 | -20.5 | 2.82(9) |
| ESW | -11.75 | -21.2 | 2.82(9) |
| ENE | -12.05 | -21.5 | 2.82(9) |
| W4 | -12.75 | -21.2 | 2.82(8) |
| IR | -10.85 | -20.2 | 2.24(9) |
1 = 5 000 K
Images of VV 114 taken at different wavelengths (see Fig. 1 of Soifer et al. 2001) show different characteristics. For example, at 2.2 m the NIR emission is black body from old stars ( = 5 000 K, see Fig. 3) with perhaps some contribution from bremsstrahlung from gas heated and ionized by the starburst and by diffuse emission downstream. Therefore we see a quite complex picture at 2.2 m and the shock fronts disrupted by R-T instability can also be recognized. At 3.3 m the image reveals dust reradiation downstream the high velocity shock. At 12.5 m the image shows the maximum of dust emission from clouds near a rather aged starburst. At this wavelength dust emits from the postshock region of a high velocity shock. The emission has therefore a clumpy distribution, considering that the high velocity shock fronts are disrupted. Moreover, the clumps are relatively small, because the grains are rapidly sputtered in the post shock region. Unfortunately there is no image at longer wavelengths which could show the distribution of low velocity gas and dust. Frayer et al. (1999) show images of VV 114 at 450 and 850 m. The images are different indicating that the two data in Fig. 3 belong to different models. The datum at 450 m represents dust corresponding to a model with = 200 (model M5) and the other one corresponds to a lower shock velocity (100 ). In fact the image is less tormented and more homogeneous.
The continuum SED in the radio range in Fig. 4 shows that radio emission at 8.4 GHz is synchrotron radiation created near the shock front. So, the image at 8.4 GHz shows some clumpiness.
4.2 NGC 1614

| line | obs1 | M9 | M10 | M3 | M5 | SUM |
|---|---|---|---|---|---|---|
| [OII] 3727 | 0.8 | 0.14 | 5.(-6) | 2.6 | 25. | 0.9 |
| [NeIII] 3869 | 0.51 | 10.15 | 0.1 | 0.33 | 3.1 | 0.4 |
| [SII] 4071 | 0.11: | 1.3 | 0.0 | 0.16 | 1.0 | 0.08 |
| [OIII] 5007 | 0.85 | 0.84 | 0.11 | 2.21 | 15. | 0.87 |
| [NI] 5200 | 0.033 | 1.(-4) | 0.0 | 0.03 | 0.019 | 0.011 |
| HeI 5876 | 0.07 | 0.002 | 0.008 | 0.29 | 0.13 | 0.1 |
| [OI] 6300 | 0.093 | 0.002 | 0.0 | 0.66 | 0.5 | 0.23 |
| [NII] 6584 | 2.0 | 0.086 | 0.0 | 2.64 | 8.8 | 1.0 |
| [SII] 6716+6731 | 0.56+ | 0.10 | 0.0 | 3.47 | 7.7 | 1.2 |
| [SII] 6716/6731 | 1/1.43 | 0.47 | 1.06 | 0.79 | - | |
| [OII] 7325 | 0.053 | 0.014 | 3.(-7) | 0.06 | 1.32 | 0.02 |
| H () | 3.3 (-13) | 0.44 | 0.14 | 0.016 | 0.003 | - |
| w | - | 0.002 | 0.2 | 1. | 0.02 | - |
1 from Vaceli et al. (1997), observed at earth
NGC 1614 is a strongly interacting galaxy showing crossed tails on photographic plates (Arp 1966). High-resolution NIR images and spectra (Alonso-Herrero et al. 2001) reveal a strong nuclear starburst ( pc diameter) surrounded by a ring ( pc diameter) of brigh HII regions. The detection of numerous Wolf-Rayet stars in the integrated nuclear spectrum of this galaxy (e.g. Vacca & Conti 1992) indicates that the starburst is very young (between 2 and 6 Myr). The optical spectrum observed by Vaceli et al. (1997) (see Table 4) is used to cross-check the continuum. The few line ratios by Veilleux et al. (1995) are in agreement with those of Vaceli et al. (1997). Model M9 (CV01) is selected because i) the line ratio [OIII]/H is in agreement with the data, ii) the [OIII]/[OI] ratio, even if high, is lower than for other models, and iii) particularly, because the MIR bump for VV 114 is nicely fitted by models with = 500 . Black body radiation from stars with = 5 000 K (dotted line) is also revealed between 1 and 3 m.
The dust peak in the FIR indicates that clouds with lower shock velocities contributes to the spectra, i. e. model M3 (CV01, , dashed lines) and clouds corresponding to = 200 and a higher (M5, dash-dot lines). A is a higher limit for model M3; a lower will not change the emission-line ratios. The high used for clouds at = 200 is also constrained by the data at Hz.
Fig. 7 shows that bremsstrahlung radiation from a cool gas overpredicts the datum in the radio range. Indeed, absorption of free-free radiation increases with wavelength and can reduce drastically the bremsstrahlung from cool gas. At 5 GHz gas with a density of 103 and T between 103 - 104 K becomes optically thick for distances of 4 - 90 pc (Osterbrock 1989).
The high velocity model represents a stellar population with an age of 3.3 Myr, = 500 , = 300 , = 10, and (M10, represented by solid lines), similar to model 12(10a) in CV01, but with a high (4 10-3). This model explains both the data in the soft X-ray from Einstein satellite and the radio measurement at 4.85 GHz (Griffith et al. 1995). Model M9 with a low contributes to the emission-line ratio and is included in Table 4. Both high and low d/g clouds are accounted for.
Kim et al. (1995) give [OIII] line FWHM of 310 , which is lower than the high velocity found. This could be a rough signal of galaxy interaction, namely, in some region of the system the shock velocity is higher than the real gas velocity, due to head-on collision of clouds. Low shock velocities, on the other hand, correspond to regions farther from the starburst bulk, or shocks resulting from head-on-back collisions.
The emission-line ratios of all the models used to explain the continuum and the optical line spectrum are presented in Table 4 and the weighted sum appears in the last column. The corresponding relative weights are given in the last row. The [OI]/H emission-line ratio is overpredicted by a factor of 2 and the [NII]/H emission-line ratio is underpredicted by the same factor. [NI]/H is also underpredicted indicating a N/H higher than cosmic (). Indeed, NGC 1614 is one of the starburst nucleus galaxies showing a particularly high nitrogen-to-oxygen abundance ratio (Coziol et al. 1999), which could be due to a sequence of starbursts over the past Gyrs.
Soifer et al. (2001) claim that the 2.2 m continuum image does not reveal a ring-like structure, but a strong central peak of emission. This results from the fact that the 2.2 m light traces the old stellar populations which peak at the nucleus, while the MIR, radio and P images trace the ring of current star formation. Indeed Fig. 7 shows that the datum at 2.2 m is explained by black body radiation from stars with = 5 000 K.
4.3 NGC 2623

| line | obs1 | M11 | M3 | M12 | SUM |
|---|---|---|---|---|---|
| [OI] 6300 | 0.9 | 0.0012 | 0.66 | 4.0 | 1.0 |
| [NII] 6584 | 3.8 | 0.096 | 2.64 | 11.7 | 3.1 |
| [SII] 6716+6731 | 1.6 | 0.043 | 3.47 | 7. | 1.9 |
| [SII] 6716/6731 | - | 0.47 | 1.06 | 1.0 | - |
| H () | - | 0.23 | 0.016 | 6.(-4) | - |
| w | - | 0.007 | 0.005 | 1. | - |
1 from Armus et al (1989)
This is a strongly interacting galaxy (Soifer et al. 2001), exhibiting strong Balmer absorption lines in its integrated optical spectrum (Armus, Heckman, & Miley 1989). Because of the steep emission-line Balmer decrement, the H and H lines appear in absorption, while H appears in emission. The strong absorption features indicate a large intermediate-age ( yr) stellar population.
The optical spectrum is presented in Table 5. The observed emission lines are few, hardly constraining the models. Therefore, we have used models similar to those adopted for VV 114 and NGC 1614. The continuum SED is presented in Fig. 8. The MIR bump and a few optical data are well explained by model M11 (solid lines), similar to 11(10A) from CV01, with , while reradiation by dust at wavelengths longer than 60 m is explained by model M12 (dash-dot lines), namely a model corresponding to = 200 , and a very young stellar population. Also for this model . Only one datum is available in the radio range. So, we cannot decide whether radio emission is synchrotron or bremsstrahlung from a relatively cool gas. Stars with = 5 000 K also contribute to the SED at about Hz. Concluding, NGC 2623 shows a lower amount of dust relative to VV 114.
4.4 NGC 3690 + IC 694


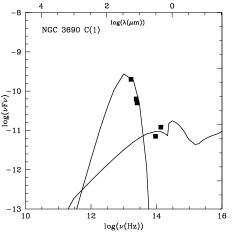


| line | obs(C)1 | obs(A)1 | obs(B)1 | M13 | M10 | M5 | M14 | M3 | SUM1 | SUM2 |
|---|---|---|---|---|---|---|---|---|---|---|
| [OIII] 5007 | 1.25 | 1.11 | - | 2.86 | 0.11 | 15. | 0.84 | 2.2 | 1.37 | 1.4 |
| [OI] 6300 | 0.067 | 0.31 | 0.21 | 3.(-5) | 0.0 | 0.5 | 0.002 | 0.66 | 0.057 | 0.2 |
| [NII] 6584 | 1.34 | 1.83 | 1.83 | 0.007 | 0.0 | 8.8 | 0.086 | 2.64 | 0.51 | 1.0 |
| [SII] 6716+6731 | 0.57 | 1.28 | 0.95 | 0.8 | 0.0 | 7.7 | 1.02 | 3.5 | 1.4 | 1.8 |
| H () | - | - | - | 0.11 | 0.14 | 0.0025 | 0.44 | 0.187 | - | - |
| w1 | - | - | - | 3.3(-3) | 3.3(-4) | 1. | 0.167 | 0.027 | - | - |
| w2 | - | - | - | 3.6(-3) | 3.3(-4) | 1. | 0.27 | 0.27 | - | - |
1 from Armus et al. (1989)
| A(1) | A(2.5) | B1(2.5) | B1(1) | B2(1) | B2(2.5) | C(2.5) | C(1) | C’(2.5) | C’(1) |
| 3. | 6. | 6. | 6.5 | 0.5 | 0.5 | 6. | 6. | 20. | 20. |
NGC 3690 + IC 694 show a system of five nuclei. The MIR photometry has been performed by S01 in single regions and with different apertures. It is thus possible to determine the ratios for each nucleus. The optical spectra (Armus et al. 1989) are available in the A, B, and C regions (see S01 for nomenclature). The number of lines is very small allowing only a rough modelling.
In Table 6 we compare model calculations with the observed emission-line ratios from Armus et al. (1989). The models are taken from CV01 and some of them are run with different values. Model M5 which refers to = 200 is constrained by the fit of the SED. The summed spectra SUM1 and SUM2 appear in the last two columns of Table 6. The fit is not very good, particularly the [NII]/H emission-line ratio is underpredicted and [SII]/H line ratio is overpredicted. A higher than cosmic N/H abundance ratio has been found in many galaxies containing a starburst. Moreover, in dust rich galaxies sulphur could be locked up into CS diatomic molecules.
The SED of the continuum is shown in Fig. 9 for the summed spectrum. Notice that most of the data in the radio-to-X-ray range are well explained by a model with = 500 and Myr (solid lines). However, lower velocities are also important to explain the FIR bump (dash-dot lines). For the summed SED shown by S01 in their fig. 6, = .
We adopted the same ratio of relative weights for models M5 and M14 as for the line ratios (Table 6), although dust emission from model M5 overpredicts the data in the FIR and indicates strong absorption by dust (see sect. 4.1).
In Fig. 10, the data from S01 (fig. 4f) for single regions are compared with models. The found for each region are presented in Table 7. B2 shows the lowest and C’ the highest. In fact, [SII]/H line ratios are low in region C, indicating that sulphur is locked in dust.
The image at 2.2 m shows a more complete and tormented structure, corresponding to the complex of contributions by the starburst radiation, by the old stellar population and by the strong shock. On the contrary, the image at 3.2 m is smoother because shows only the black body emission of the old stellar population. The images at 12.5 m and that at 6.4 GHz are similar because they show the flux at different frequencies on the distribution of dust emission from the same cloud.
4.5 IC 883


| line | obs | M9 | M15 | M16 | SUM |
|---|---|---|---|---|---|
| [OIII] 5007 | 0.86 | 0.8 | 0.82 | 2.7 | 0.81 |
| [OI] 6300 | 0.44 | 0.002 | 4.55 | 9.(-4) | 0.6 |
| [NII] 6584 | 2.7 | 0.086 | 12.7 | 0.039 | 1.9 |
| [SII] 6716+6731 | 1.23 | 0.10 | 6.6 | 0.6 | 1.0 |
| [SII] 6716/6731 | 1/1.23: | 0.47 | 1. | 0.46 | - |
| H () | - | 0.44 | 0.004 | 0.24 | |
| w | - | 0.05 | 1. | 1.6(-4) | - |
The optical spectrum of IC 883 is classified as that of a LINER by Veilleux et al. (1995). However, we could fit the few line ratios presented in Table 8 with an averaged sum of starburst models, as for the other galaxies of the sample. Nevertheless, checking the results of composite models presented by Contini & Viegas (2001b) which refers to AGN, we found that the observed line ratios could be also explained by a model with = 100 , = 100 , and = 109 cm-2 s-1 eV-1 at 1 Ryd. However, such a model cannot explain the emission by dust in the MIR, because is too low.
The SED of the continuum is presented in Fig. 11 top. We show both the contributions of a model corresponding to a stellar age of 3.3 Myr with = 500 and (M9 represented by solid lines) and a model also corresponding to Myr with = 200 and (M15 represented by dash-dot lines). As the galaxy is more compact than the former ones it was reasonable to consider that the clouds with different correspond to the same starburst age. Interestingly, some data in the NIR are explained by black body radiation from stars with = 1 000 K (dotted line). This is justified by the assumption that there is strong silicate absorption at 10 m (S01).
In the bottom diagram of Fig. 11, the photometry in different apertures (filled squares: 4″; open squares: 1″) are explained by the same starburst model with = 500 . Notice that with a lower aperture the flux is reduced for all the data by about the same factor.
The images at 2.2 m and 12.5 m (S01) are similar because corresponding to the same distribution of dust emission.
4.6 NGC 6090

The results of Acosta-Pulido et al (1996) show that 84% of the NGC 6090 emission comes from the wavelength regime shortward of 120 m and argues for very efficient heating of the dust. It implies temperatures higher than about 25 K which cannot be accounted for by the interstellar radiation field alone.
The models are compared with observed emission-line ratios (Veilleux et al. 1995) in Tables 9 and 10 for the SW and NE regions respectively. With cross-checking considerations, the SED of the continuum which appears in Fig. 12 shows that model M17 (solid lines) with =500 and d/g=1.6 explains some significant data in the MIR from NED, in agreement with Keck data (S01) Reradiation by dust in clouds with = 200 and (M18) explains the IR data (dash-dot lines) and bremsstrahlung.
The fit of the summed optical line ratios shows that other models contribute. Clouds photoionized by a Myr starburst and with = 500, 200, and 100 explain the summed line ratios in the NE region, while the low velocity cloud contribution in region SW corresponds to a younger age ( Myr) and appears in the sum with a high relative weight (model M19). Notice, however that H absolute value is very low and is compensated by the high relative weight. Also for this galaxy, [NII]/H line ratio is underestimated and [OI]/H is overestimated in region NE.
In Fig. 13 the diagrams correspond to the different continuum SED in the regions indicated by S01 (fig. 6c). A is revealed in E(6), even if the flux is high. The fluxes decrease in EN and ES and mostly in W(4) and W(1.5).
The data point at 2.2 m corresponds always to bremsstrahlung emission, while the other data are associated with reradiation by dust in a relative high velocity regime. Consequently, the image at 2.2 m (S01) is complex and more complete. It seems that emission in the radio is bremsstrahlung by cool gas.


| line | obs (SW) | M17 | M18 | M14 | M19 | SUM(SW) |
|---|---|---|---|---|---|---|
| [OIII] 5007 | 1.5 | 2.76 | 0.76 | 0.84 | 2.24 | 1.7 |
| [OI] 6300 | 0.066 | 6.5(-5) | 2.62 | 0.002 | 0.0054 | 0.05 |
| [NII] 6584 | 1.3 | 0.008 | 10.8 | 0.0086 | 1.3 | 0.9 |
| [SII] 6716+6731 | 0.64 | 0.8 | 6.0 | 1.02 | 0.35 | 0.7 |
| H () | - | 0.317 | 0.007 | 0.44 | 0.0066 | |
| w | - | 0.004 | 0.032 | 0.012 | 1. |
| line | obs (NE) | M17 | M18 | M14 | M20 | M21 | SUM(NE) |
|---|---|---|---|---|---|---|---|
| [OIII] 5007 | 0.56 | 2.76 | 0.76 | 0.84 | 0.05 | 3.27 | 0.56 |
| [OI] 6300 | 0.063 | 6.5(-5) | 2.62 | 0.002 | 0.0 | 14.0 | 0.23 |
| [NII] 6584 | 1.2 | 0.008 | 10.8 | 0.0086 | 0.0 | 24.5 | 0.8 |
| [SII] 6716+6731 | 0.5 | 0.8 | 6.0 | 1.02 | 0.0 | 9.0 | 0.8 |
| H () | - | 0.317 | 0.007 | 0.44 | 0.83 | 0.44 | - |
| w | - | 0.025 | 1. | 0.125 | 0.087 | 0.05 | - |
4.7 Mrk 331


| line | obs | M22 | M18 | M3 | M23 | SUM |
|---|---|---|---|---|---|---|
| [OIII] 5007 | 0.43 | 2.21 | 0.76 | 2.21 | 0.12 | 0.5 |
| [OI] 6300 | 0.1 | 9.(-4) | 2.62 | 0.66 | 0.005 | 0.2 |
| [NII] 6584 | 2.0 | 0.037 | 10.8 | 2.64 | 0.34 | 1.0 |
| [SII] 6716+6731 | 0.77 | 0.84 | 6.0 | 3.5 | 0.13 | 0.7 |
| [SII] 6716/6731 | 1/0.98 | 0.47 | 1. | 1.06 | 0.5 | - |
| H () | - | 0.26 | 0.007 | 0.016 | 68.4 | - |
| w | - | 0.056 | 1. | 0.11 | 1.1(-3) | - |
The continuum SED of Mrk 331 which is shown in Fig. 14 shows that the data are well explained by model M22 (solid lines) with , = 500 and Myr. However, a model corresponding to and = 100 better fits the data in the optical range (M3). The corresponding is 10 times lower. As we found for the other galaxies, a model with = 200 is needed to fit the data in the IR (M18, represented by dash-dot lines). We use a starburst corresponding to Myr, because the one corresponding to Myr shows too high [OIII]/[OI] line ratios. Fig. 14 shows that bremsstrahlung emission is strongly absorbed at 5 GHz, as was found for NGC 1614 (sect. 4.2).
In Table 11 the optical line ratios observed by Veilleux et al. (1995) are compared with model calculations. To obtain an acceptable fit, the summed spectrum accounts for model M23 which corresponds to = 300 and to black body radiation from stars with = 10 000 K. The SED of Mrk 331 does not show the emission from old stars. A possible explanation comes from the presence of the ring. In Fig. 15 the flux from different regions are given. It can be noticed that the flux from the ring is higher than the flux from the nucleus. Then, radiation from the old stellar population is reprocessed by the gas and dust in the ring. Fig. 15 shows that nicely fits all of the diagrams out of region (4) which shows a reduced . All emission at wavelengths longer than 10 m comes from dust, at smaller values from gas.
5 Discussion and concluding remarks
| galaxy | |
|---|---|
| VV 114 N | 0.016 – 0.032 |
| VV 114 S | 0.008 |
| NGC 1614 | 0.001 – 0.024 |
| NGC 2326 | 4. (-4) |
| NGC 3690 | 0.004 – 0.024 |
| IC 883 | 4.(-4) – 8.(-4) |
| NGC 6090 (SW) | 1.6(-4) – 2.8(-4) |
| NGC 6090 (NE) | 1.6(-4)– 2.8(-4) |
| Mrk 331 | 4.(-4) – 0.0028 |
In previous sections we have modelled both the continuum SED and optical emission-line ratios of a representative sample of IR luminous starburst galaxies observed in the MIR by S01 using the Keck Telescope.
Some significant results, obtained by modelling the optical line spectra, are summarized in Fig. 16, where the distribution of the dust-to gas ratios, in units of 4, the age of the starburst in Myr, and the contribution in % to the [OIII] 5007+4959 line (P[OIII]) are given in clouds corresponding to different velocities. Notice that VV 114 S (Table 2) does not appear in Fig. 16 because all the clouds therein have the same velocity (=100 ), with ages between 0.0 and 2.5 Myr.
The diagrams show that generally lower velocities correspond to early ages (see Viegas et al. 1999), out of IC 883 and NGC 6090, which are dominated by relative old starbursts.
The d/g ratio peaks for clouds with = 200 . This is in agreement with the results of Fig. 1 (left panel) which shows that for shock velocities 300 dust grains are less sputtered. In high velocity environments d/g is partly reduced, although grains with a radius 0.2 m can survive in a small region downstream, close to the front of a = 500 shock. Moreover, IC 883, NGC 6090, and Mrk 331 show that d/g ratios are lower in older starbursts also when = 200 . Generally, low velocity clouds (=100 ) in young (and old, e.g. NGC 6090) starbursts are less dusty. Recall that d/g in the corresponding models are often upper limits (e.g. NGC 1614). In fact, these clouds are generally far from the starburst bulk, already merging with the ISM. Accordingly, IC 883 that is a compact object, does not show a low velocity component neither in the line spectrum nor in the continuum.
The relative contribution to the [OIII] lines from clouds corresponding to = 500 prevails in VV 114 N, NGC 3690, and NGC 6090 NE. Interestingly, in Mrk 331 the contribution increases smoothly with . We would expect a relatively large FWHM of the [OII] line profile.
Moreover, the comparison of model calculations with the emission-line ratios shows that sulphur is depleted. Generally, N/H abundance ratio higher than cosmic is indicated.
The main results regarding the IR domain of the continuum SED, are the following:
Emission from clouds in the neighbourhood of starbursts with Myr and with shock velocities of 500 explains both the bremsstrahlung and reradiation from dust in the MIR. Clouds with lower velocity (100 ) and corresponding to a lower age ( Myr) which contribute to the line spectra give a low contribution to the SED in the FIR, while clouds with = 200 are crucial to explain the FIR bump due to dust emission.
By fitting the continuum SED we found that dust-to-gas ratios change in the different regions of single galaxies. We found that d/g ranges between and (see Sect. 2). More specific results are given in Table 12.
An old stellar population with = 5 000 K is revealed by black body emission in the optical-NIR range of a few objects.
Finally, the data which correspond to the SED are not resolved enough to permit an analysis of absorption by ice and emission by PAH. However, small dust grains corresponding to PAH and graphite, and ice mantles are easily destroyed in a shock dominated regime close to the starburst, therefore, they are emitting from a farther extended region. The modelling shows that absorption by silicate at 9.7 m is strong for VV 114 E(4), MRK 331, and NGC 3690. Moreover, absorption by water ice at 3 m is suggested for VV 114.
In summary, the frequencies corresponding to the maxima of dust reradiation depend on the shock velocity. However, the radiation from the starburst affects gas bremsstrahlung emission in the optical range. Gas and dust are mutually heating and cooling, therefore, from the ratio between the intensity of dust emission and the bremsstrahlung it is possible to deduce the dust-to-gas ratio in each observed region of single galaxies.


Aknowledgments
We are very grateful to the referee for important comments. We thank Sueli M. Viegas for many helpful discussions.
Appendix A
Table A1
Models corresponding to CV01 ( cm)
| model | d/g | model | ||||
|---|---|---|---|---|---|---|
| Myr | 4 | (CV01) | ||||
| M1 | 500 | 300 | 3.3 | 1. | 0.1 | 11(10A) |
| M2 | 500 | 300 | 3.3 | 3.5 | 80 | 11(10A) |
| M3 | 100 | 100 | 0.0 | 0.01 | 0.1 | 1(6A) |
| M4 | 100 | 100 | 0.0 | 0.02 | 40 | 1(6A) |
| M5 | 200 | 100 | 0.0 | 0.01 | 60 | 1(6A) |
| M6 | 100 | 100 | 2.5 | 0.1 | 0.1 | 6(6A) |
| M7 | 100 | 100 | 2.5 | 1. | 0.1 | 7(6A) |
| M8 | 100 | 100 | 2.5 | 1. | 20 | 7(6A) |
| M9 | 500 | 300 | 3.3 | 0.1 | 0.1 | 10(10A) |
| M10 | 500 | 300 | 3.3 | 10. | 10. | 12(10A) |
| M11 | 500 | 300 | 3.3 | 1. | 1. | 11(10A) |
| M12 | 200 | 100 | 0.0 | 0.01 | 1. | 1(6A) |
| M13 | 500 | 300 | 3.3 | 0.01 | 10 | 9(10A) |
| M14 | 500 | 300 | 3.3 | 0.01 | 0.1 | 9(10A) |
| M15 | 200 | 100 | 3.3 | 0.01 | 2. | 9(10A) |
| M16 | 500 | 300 | 3.3 | 0.1 | 1. | 10(10A) |
| M17 | 500 | 300 | 3.3 | 0.01 | 4. | 9(10A) |
| M18 | 200 | 100 | 3.3 | 0.01 | 0.7 | 9(10A) |
| M191 | 100 | 100 | 2.5 | 0.01 | 0.1 | 5(5A) |
| M20 | 500 | 300 | 5.4 | 1. | 0.1 | 19(10B) |
| M21 | 100 | 100 | 3.3 | 0.01 | 0.1 | 9(6A) |
| M22 | 500 | 300 | 3.3 | 0.01 | 1. | 9(10A) |
| M23 | 300 | 300 | BB2 | 10. | 0.1 | 4(3) |
1 cm
2 corresponding to 10 000 K
In Table A1 the models are defined and referred to the models in CV01. The input parameters appear in columns 2-6. In the last column the number before the parenthesis refer to the number of the model in the tables (which appears inside the parenthesis) of CV01.
Appendix B
The data from NED come from:
Spinoglio et al. (1995), Moshir et al. (1990), Soifer et al. (1989), Griffith et al. (1994), Condon et al. (1998), Fabbiano, Kim, & Trinchieri (1992), Kinney et al. (1993), De Vaucouleurs et al. (1991), Huchra (1977), Doroshenko & Terebezh (1979), Balzano & Weedman (1981), Rieke & Low (1972), Lebofsky & Rieke (1979), Eales, Wynn-Williams, & Duncan (1989), Dunne et al. (2000), Griffith et al. (1995), Godwin et al. (1977), Gregory & Condon (1991), Becker, White, & Edwards (1991), Joyce & Simon (1976), Allen (1976), Carico et al. (1992), Odewanhn & Aldering (1995), Becker, White, & Helfand (1995).
References
- [1] Acosta-Pulido, J.A. et al. 1996, A&A, 315, L121
- [2] Allen, C.W., 1973, Astrophysical Quantities, London: University of London, Athlone Press, 3rd ed.
- [3] Allen, D.A. 1976, ApJ, 207, 367
- [4] Alonso-Herrero, A., Engelbracht, C.W., Rieke, M.J., Rieke, G.H., & Quillen, A.C., 2001, ApJ, 546, 952
- [5] Armus, L., Heckman, T.M., & Miley, G.K., 1989, ApJ, 347, 727
- [6] Arp, H., 1966, ApJS, 14, 1
- [7] Aussel, H., Cesarsky, C. J., Elbaz, D., & Starck, J. L., 1999, A&A, 342, 313
- [8] Balzano, V.A., & Weedman, D.W. 1981, ApJ, 243, 756
- [9] Barger, A. J., Cowie, L. L., & Sanders, D. B., 1999, ApJ, 518, L5
- [10] Barger, A.J., Cowie, L.L., Sanders, D.B., Fulton, E., Taniguchi, Y., Sato, Y., Kawara, K., & Okuda, H., 1998, Nature, 394, 248
- [11] Becker, R.H., White, R.W. & Edwards, A.L., 1991 ApJS, 75, 1
- [12] Becker, R.H., White, R.L., & Helfand, D.J., 1995, ApJ, 450, 559
- [13] Carico, D.P., Keene, J., Soifer, B.T., & Neugebauer, G. 1992, PASP, 104, 1086
- [14] Cid Fernandes, R., Dottori, H.A., Gruenwald, R.B., & Viegas, S.M. 1992, MNRAS 255, 165
- [15] Clements, D. L., Sutherland, W. J., McMahon, R. G., & Saunders, W., 1996, MNRAS, 279, 477
- [16] Condon, J.J., et al. 1998, AJ, 115, 1693
- [17] Contini, M. 1990, ApJ, 358, L41
- [18] Contini, M. 1992, ApSS, 198, 29
- [19] Contini, M. & Viegas, S.V. 2000, ApJ, 535, 721
- [20] Contini, M. & Viegas, S.M. 2001b, ApJS, 132, 211
- [21] Contini, M. & Viegas, S.M. 2001a, ApJS, 137, 75 (CV01)
- [22] Contini, M. , Prieto, M.A., & Viegas, S.M., 1998, ApJ, 505, 621
- [23] Contini, M. , Viegas, S. M., & Campos, P. E. 2002, submitted
- [24] Coziol, R., Reyes, R. E. C., Considère, S., Davoust, E., & Contini, T., 1999, A&A, 345, 733
- [25] Dale, D.A., Helou, G., Contursi, A.,Silberman, N.A., Kolhaktar, S., 2001, ApJ, 215, 227
- [26] De Vaucouleurs, G. et al., 1991, RC 3.9
- [27] Doroshenko, V.T. & Terebezh, V.Yu., 1979, SvAL, 5, 305
- [28] Doyon, R., et al., 1995, ApJ, 450, 111
- [29] Draine, B.T. & Li, A. 2001, ApJ, 551, 807
- [30] Draine, B.T. & Salpeter, E.E. 1979, ApJ, 231, 77
- [31] Dunne, L. et al., 2000, MNRAS, 315, 115
- [32] Eales, S., Lilly, S., Gear, W., Dunne, L., Bond, J. R., Hammer, F., Le Fèvre, O., & Crampton, D., 1999, ApJ, 515, 518
- [33] Eales, S.A., Wynn-Williams, C.G., & Duncan, W.D., 1989, ApJ, 339, 859
- [34] Efastathiou, A., Rowan-Robinson, M., & Siebenmorgen, R. 2000 MNRAS 313, 734
- [35] Fabbiano, G., Kim, D-W, & Trinchieri, G., 1992, ApJS, 80, 531
- [36] Frayer, D.T., Ivison, R.J., Smail, I., Yun, M.S., & Armus, L., 1999, AJ, 118, 139
- [37] Genzel, R. et al., 1998, ApJ, 498, 579
- [38] Godwin, J.G. et al., 1977 Obs., 97, 238
- [39] Gregory, P.C. & Condon, J.J., 1991, ApJS, 75, 1011
- [40] Griffith, M.R., Wright, A.E., Burke, B.F., & Ekers, R.D., 1994, ApJS, 90, 179
- [41] Griffith, M.R., Wright, A.E., Burke, B.F., & Ekers, R.D., 1995, ApJS, 97, 347
- [42] Helou, G. 1986 ApJ, 311, L33
- [43] Helou, G., Malhotra, S., Hollenbach, D.J., Dale, D.A., Contursi, A, 2001, ApJ, 548, L73
- [44] Hildebrand, R. H. 1983 Q. J. R. astr. Soc. 24, 267
- [45] Hughes, D. H. et al., 1998, Nature, 394, 241
- [46] Huchra, J.P., 1977, ApJS, 35, 171
- [47] Joyce, R.R. & Simon, M., 1976, PASP, 88, 870
- [48] Kawara, K., & Okuda, H., 1998, Nature, 394, 248
- [49] Kawara, K. et al., 1998, A&A, 336, L9
- [50] Kim, D.-C., Sanders, D.B., Veilleux, S., Mazzarella, J.M., & Soifer, B.T., 1995, ApJS, 98, 129
- [51] Kim, D.-C., Veilleux, S., & Sanders, D. B., 1998, ApJ, 508, 627
- [52] Kinney, A.L., et al., 1993, ApJS, 86, 5
- [53] Knop, R.A., et al., 1994, AJ, 107, 920
- [54] Kraemer, K.E., Jackson, J.M., Deutsch, L.K., Kassis, M., Hora, J.L., Fazio, G.G., Hoffmann, W.F., Dayal, A., 2001, ApJ, 561, 282
- [55] Lebofsky, M.J., & Rieke, G.H., 1979, ApJ, 229, 111
- [56] Le Floc’h, E. et al. 2002, A&A, 391, 417
- [57] Lutz, D., & Tacconi, L., 1999, proceedings of the Ringberg workshop “Ultraluminous Galaxies: Monster or Babies?”, Lutz & Tacconi eds.
- [58] Moshir, M. et al., 1990, IRAS Faint Source Catalogue, version 2.0
- [59] Odewahn, S.C. & Aldering, G., 1995, AJ, 110, 2009
- [60] Osterbrock, D.E., 1989, Astrophysics of Gaseous Nebulae and Active Galactic Nuclei (Mill Valley: University Science Books)
- [61] Puget, J. L. et al., 1999, A&A, 345, 29
- [62] Rieke, G.H. & Low, F.J., 1972, ApJ, 176, L95
- [63] Rowan-Robinson, M. & Crawford, J. 1989, MNRAS, 238, 523
- [64] Sanders, D. B., Soifer, B. T., Elias, J. H., Madore, B. F., Matthews, K., Neugebauer, G., & Scoville, N. Z., 1988, ApJ, 325, 74
- [65] Sanders, D. B., & Mirabel, I. F., 1996, ARA&A, 34, 749
- [66] Siebenmorgen, R., Krügel, E., Zota, V. 1999, A&A, 351, 140
- [67] Siebenmorgen, R., Krügel, E., Laureijs, R.J. 2001, A&A, 377, 735
- [68] Smail, I., Ivison, R. J., & Blain, A. W., 1997, ApJ, 490, L5
- [69] Soifer, B.T., 1986, New York Academy Sciences Annals, 470, 156
- [70] Soifer, B.T., Boehmer, L., Neugebauer, G., & Sanders, D.B., 1989, AJ, 98, 760
- [71] Soifer, B.T., Neugebauer, G., Matthews, K., Egami, E., Weinberger, A.J., Ressler, M., Scoville, N.Z., Stolovy, S.R., Condon, J.J., & Becklin, E.E., 2001, AJ, 122, 1213 (S01)
- [72] Soifer, B.T., Neugebauer, G., Matthews, K., Egami, E., & Weinberger, A.J., 2002, AJ, 124, 2989
- [73] Spinoglio,L., Matthew, A., Brian, R., Carrasco, L., & Recillas-Cruz, E., 1995, ApJ, 453, 616
- [74] Spoon, H.W.W. et al. 2002, A&A, 385, 1022
- [75] Sturm, E. et al. 2002, A&A, 393, 821
- [76] Taniguchi, Y. et al., 1997, A&A, 328, L9
- [77] Tielens, A.G.G.M., Seab, C.G., Hollenbach, D.J., & McKee, C.F. 1987, ApJ, 319, L109
- [78] Vacca, W. D. & Conti, P. S., 1992, ApJ, 401, 543
- [79] Vaceli, M.S., Viegas, S.M., Gruenwald, R., & De Souza, R.E., 1997, AJ, 114, 1345
- [80] Veilleux, S., Sanders, D. B., & Kim, D.-C., 1999, ApJ, 522, 139
- [81] Veilleux, S., Kim, D.-C., Sanders, D.B., Mazzarella, J.M., & Soifer, B.T., 1995, ApJS, 98, 171
- [82] Viegas, S.M. & Contini, M., 1994, ApJ, 428, 113
- [83] Viegas, S.M., Contini, M., & Contini, T., 1999, A&A,347, 112