The Vela Pulsar’s Radio Nebula
Abstract
We have discovered that the radio nebula surrounding the Vela pulsar covers a much wider extent than previously reported, with two lobes to the North and South of the pulsar. Indications of this object have been reported previously, but its symmetric morphology around the pulsar and other details had not been identified as they were hidden due to poor sensitivity to low spatial frequencies. The structure is highly polarised and the polarisation vectors, once corrected for Faraday rotation, reveal symmetry with respect to the spin axis of the pulsar. The X-ray emission found by Chandra lies at the centre of this structure, in a region which has no detectable excess of radio emission. We estimate total fluxes and regional fluxes from the Northern and Southern lobes, plus the X-ray region at four radio frequencies; 1.4, 2.4, 5 and 8.5 GHz. We present the corresponding images in both the total and polarised intensities, as well as those showing the derotated linear polarisation vectors.
keywords:
pulsars: individual B0833-45 supernova remnants: individual Vela SNR1 Introduction
The observations of the Vela pulsar wind nebula (PWN) made by Chandra X-ray Observatory (Pavlov et al., 2000; Helfand et al., 2001) lead us to examine the published high resolution results of the region (Bietenholz et al., 1991; Bock et al., 1998b; Bock et al., 1998a; Bock et al., 2002) and the archives of the Australia Telescope Compact Array (ATCA) to explore whether there was similar radio emission associated with the pulsar. Prompted by the revealing images obtained from the available (archival) data, we re-observed with four moderately compact configurations, and two closely spaced frequencies. Correlation data in each integration were folded and binned at the pulsar period (pulsar binning) at the highest possible rate (thirty two bins per period). Furthermore we reprocessed archived data at 1.4 and 2.4-GHz.
Previous high resolution observations of this region are reported in Bietenholz et al. (1991) using the VLA, Bock et al. (1998b) using Molonglo Observatory Synthesis Telescope (MOST) and Bock et al. (1998a); Bock et al. (2002) using the ATCA. These final two papers discuss results from the same data as we subsequently accessed from the archive.
Our observations show an extended radio nebula with symmetric morphology surrounding the pulsar and its X-ray nebula. We describe our results, compare them to those in the literature, and consider some of the consequences.
2 Observations and Data reduction
All the data were collected at the Australia Telescope Compact Array (ATCA) in Narrabri (latitude -30.3o) (Frater et al., 1992). Observations were made at 5.2-GHz with the Array in the standard configurations 0.375, 0.75D, 1.5D and 6D. The maximum and minimum baselines were 110 and 0.35 k (angular resolutions of to ) for a total of 42.7 hours. Observations at 8.5-GHz we used the 0.75D, 1.5D and EW352 configurations with a four pointing mosaic, to get full coverage of the extended source. The maximum and minimum baselines were 130 and 0.6 k ( to ) and data were collected over a total of 38.3 hours. In both cases we observed in two nearby frequencies, with bandwidths of 128 MHz, to ensure that there would be no ambiguities in the rotation measure (RM) and to maximise the independent uv coverage. We used the ATNF correlator mode that divides each integration data into separate phase bins spanning the pulsar period. This firstly allowed the highly variable pulsar flux to be excluded from the image and secondly allowed us to selfcalibrate (i.e. derive the antennae phases from the observations) on the strong signal from the pulsar (0.6 Jy at 8.5 GHz). Where the interstellar dispersion smeared the pulse arrival time across the band into several bins (significant only for observations below 2.4-GHz) we dedispersed across the multiple spectral channels. The correlator configuration used for our observations separated the received signal between thirty two pulsar bins. The archived data from 1996 was observed as part of a thirty five pointing mosaic with only one observation covering the pulsar. They were made with an eight-bin pulsar mode. The full details are shown in Table 1.
| Observations of the Vela Radio Nebula | ||||
| Configuration & date | Frequency/GHz | Hours | Max and Min baseline/m | |
| 0.375 | 01FEB24 | 4.85 & 5.65 | 8.5 | 5969 31 |
| 0.15D | 01MAR17 | 4.85 & 5.65 | 9.7 | 4439 107 |
| 6D | 01MAR30 | 4.85 & 5.65 | 12.1 | 5878 77 |
| 0.75D | 01APR18 | 4.85 & 5.65 | 12.4 | 4469 31 |
| 0.75D | 01SEP24 | 8.38 & 8.64 | 11.1 | 4469 31 |
| EW352 | 01OCT19 | 8.38 & 8.64 | 11.1 | 4439 31 |
| 1.5D | 01OCT29 | 8.38 & 8.64 | 8.4 | 4439 107 |
| 1.5D | 01NOV15 | 8.38 & 8.64 | 7.7 | 4439 107 |
| 0.75C | 96JAN09 | 1.38 & 2.37 | 0.2 | 5020 46 |
| 0.75B | 96JAN24 | 1.38 & 2.37 | 0.2 | 4500 61 |
| 0.75D | 96MAY21 | 1.38 & 2.37 | 0.2 | 4469 31 |
| 6C | 96JUL31 | 1.34 & 1.43 | 4.2 | 6000 153 |
| 0.75A | 96NOV22 | 1.38 & 2.37 | 0.2 | 3750 77 |
| Frequency | Max Resolution | Image resolution | ||
|---|---|---|---|---|
| (GHz) | (arcsec) | (Jy per beam) | (arcsec) | (Jy per beam) |
| 1.4 | 8.1 6.2 | 120 | 8.1 6.2 | 120 |
| 2.4 | 10.5 9.6 | 270 | 36 26 | 300 |
| 5.2 | 1.8 1.1 | 30 | 12.1 10.5 | 59 |
| 8.5 | 1.5 0.9 | 74 | 11.2 10.6 | 57 |
| Frequency | Pointing Centre |
| 1.4 | 08:35:20.67 -45:13:35.79 |
| 2.4 | 08:35:20.67 -45:13:35.79 |
| 5.2 | 08:35:20.68 -45:10:35.79 |
| 8.5 | 08:35:21.88 -45:10:08.80 |
| ” | 08:35:25.48 -45:11:47.80 |
| ” | 08:35:15.88 -45:11:47.80 |
| ” | 08:35:11.08 -45:13:35.80 |
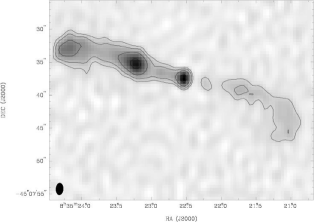
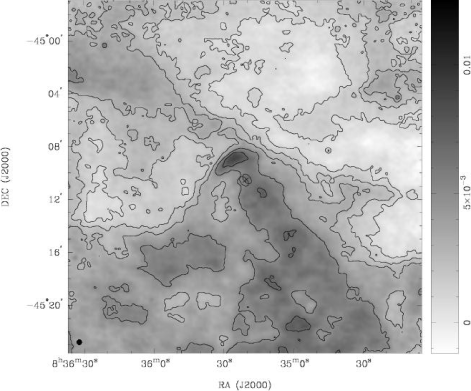
The data reduction was done following the standard procedures using the MIRIAD software package. The antenna gains were calibrated with regular observations of B0823-500. Absolute flux calibration was against B1934-638, observed at the end or the beginning of each observation. The bright FR-II galaxy to the North (centred at 08:35:22.6 -45:07:37.6) has been suppressed by modelling its structure at the highest resolution and subtracting its contribution from the uv visibilities. Details of this source are to be found in Table 2 and the image at 5 GHz in Figure 1. We selfcalibrated on the bin containing the maximum pulsar flux and transferred the phases to the off-pulse data. All images were then produced by grading the uv plane appropriately for an equivalent FWHM beamwidth of , except the 1.4-GHz and 2.4-GHz images, which were produced with uniform weighting. Deconvolution was done with the task PMOSMEM, a full polarisation version of the maximum entropy task MOSMEM, for mosaicked images.
3 Image analysis
A single pointing was used for the 5 GHz observations and radio emission was found over a region comparable to the primary beam (). The images are corrected for the primary beam taper and are cut off where the response falls below 25% of the maximum. The most obvious effect of this is the higher noise levels at the edge of the images. We have confirmed that we are producing an accurate representation of this wide field of view using the model from the mosaicked image in an equivalent uv data set. As that model was fully recovered we can be sure that the image produced is not truncated. The phase centre was south of the pulsar.
The next set of observations, at 8.5 GHz, was mosaicked and thus has a greater sky coverage than those for the 5 GHz observations, despite the narrower primary beam. These images are corrected for the combined primary beam taper and have a cutoff at 33% of the maximum.
A similar, pulsar binned, mosaicked observation of the entire Vela X region was made by Bock in 1996 (Bock et al., 1998a; Bock et al., 2002). He kindly made the calibrated 2.4-GHz data available. The 1.4-GHz data from six 128-MHz bands was recovered from the archives with the maximal number of spectral channels. We processed those pointings of these data that covered the pulsar in a similar fashion, with the added step of correction for the pulsar dedispersion across the frequency channels. In these data we suppressed the FR-II galaxy and three other point sources (30 mJy at 08:33:43.8 -45:17:58, 13 mJy at 08:34:52.8 -45:20:07 and 7 mJy at 08:35:29.2 -45:18:25) in the field. The 2.4-GHz data consist of three 128-MHz bands, with poor long baseline coverage. These data were imaged without the 6 km antenna, so it has the lowest resolution; .
The images for both of the lower frequencies also have corrections for the primary beam applied. These, however, are much less significant for the large primary beam at these frequencies. The phase centre for these observations was south of the pulsar.
One of the common problems is in comparing the absolute flux scales between different configurations responding to different sets of spatial frequencies. We have addressed this by making point to point comparisons of images smoothed to a beam size, and fitting a global slope and intercept to this intensity-intensity plot. These showed that the flux scales agreed with each other to within 1 mJy/beam, except for the 5-GHz observations, which suffered a shortfall of 3 mJy/beam (i.e. mJy). Given that the 5 GHz observations were not mosaicked, and therefore could not be expected to fully recover flux on the shortest baselines, this is not surprising. These offsets are corrected for in the spectral index images, and for the integrated flux density measurements.
4 Results
4.1 The background FR-II galaxy
We have derived the flux density from the background FR-II galaxy at each frequency. Low resolution images of the nebula will need to correct for this, so we provide the fluxes in Table 2 and the 5-GHz image (Figure 1). The galaxy was imaged and deconvolved at maximum resolution, and the deconvolution model subtracted from the uv data before imaging the region around the Vela pulsar.
| Frequency | Integrated Flux Density |
|---|---|
| (GHz) | (mJy) |
| 1.38 | 58 |
| 2.37 | 50 |
| 5.23 | 23 |
| 8.51 | 7 |
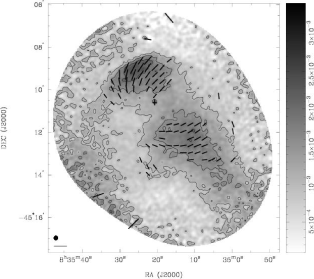
4.2 Images at 8.5 GHz
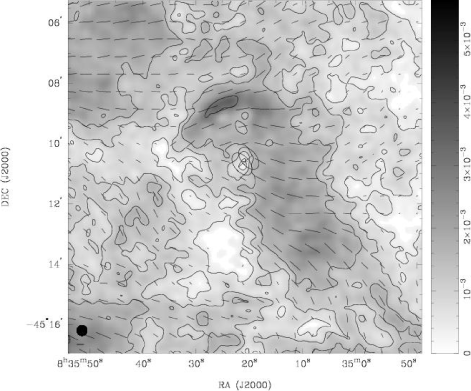
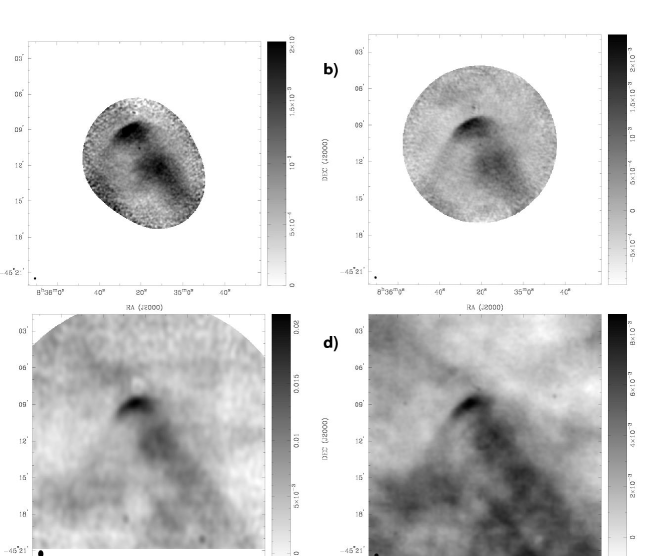
We find a highly polarised and roughly symmetric region of emission which is centred on the pulsar. The polarised fraction is 30% with a r.m.s. variation of 7% across the nebula. In Figure 2 the flux from the pulsar and the FR-II galaxy has been removed.
We have defined the northern lobe as the area with brightness greater than 1.25 mJy/beam that lies within north of the pulsar and east to west. This covers an area of 5.3 square arcminutes in which we find an integrated flux density of 230 mJy. Altering the cutoff flux by % gives variation of 40 mJy. For the more diffuse southern lobe, we define the region where flux density is greater than 1 mJy, and extending to south of the pulsar, within the band east to west. This we found to cover 18 square arcminutes and amount to 650 mJy. Errors in these estimates arise from uncertainty in the definition of the regions and the lack of low spatial frequency information. However, as we have corrected for the offset in the linear fit to flux against frequency, we believe these uncertainties are insignificant. The observed flux values, and those from the other observed bands are listed in Table 3.
The flux emitted in the region of the X-ray emission, which we define as the region where Chandra detected flux greater than 20 above the background (1 count per square arcsecond), is mJy. This is a well defined region covering 0.73 square arcminutes. Our error limits are those fluxes measured with a X-ray flux cutoff of and . We also estimated the flux from the region after the subtraction of a planar background. The residual flux found was within a few sigma of zero. We report both of the total flux and the residual values in table 3.
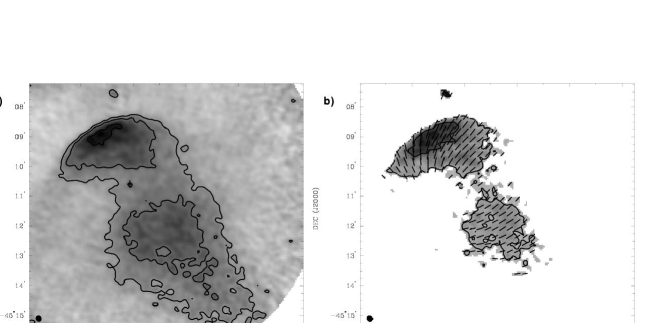
4.3 Images at 5 GHz
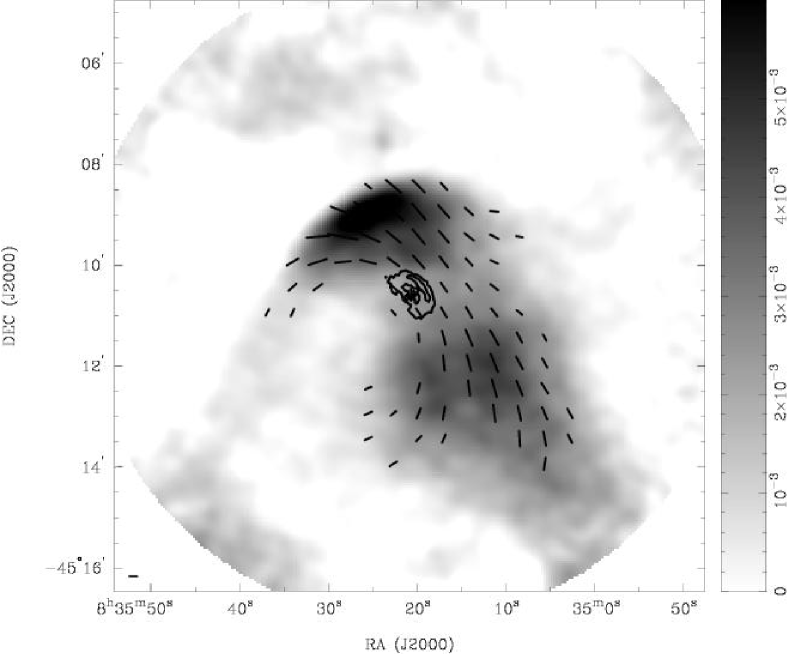
We find an even more highly polarised region of emission at this frequency. The mean polarised fraction is 60% with a r.m.s. of 10% across the nebula. Figure 3a shows the total intensity, and 3b the polarised intensity with position angles overlaid. We estimated the integrated flux densities by using the regions defined at 8.5 GHz and offsetting the flux scale as discussed in section 4.6. The results are in Table 3.
The region around Vela was observed previously with the VLA (Bietenholz et al., 1991) at 5 GHz, and their image of the region is Figure 1 in that paper. Their image does not go nearly as deep as ours (stopping at the contour). Therefore they reported only the sharp, bright, northern edge, and as a result had identified the symmetry axis (and the spin-axis projection) as that bisecting the length of the feature. Whilst the observations have similar resolution and point source sensitivity, our combined configurations have a greater concentration of the shorter baselines that are most sensitive to the low surface brightness structures we find here. The peak fluxes we find for the FR-II galaxy and the edge of the northern lobes are consistent with their observations.
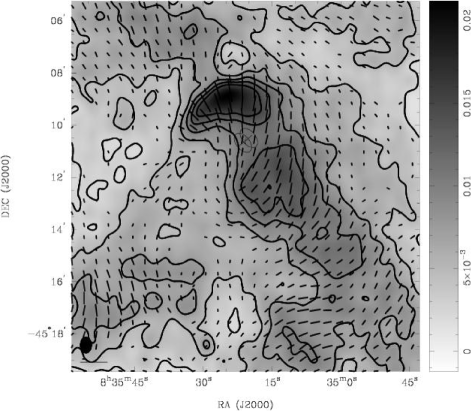
4.4 Images at 2.4 GHz
We found the same double lobed structure in these lower resolution observations. The Southern lobe is more nebulous than at 5 cm, but clearly does not connect to the bar of emission seen in radio and X-rays (Frail et al., 1997) in the Vela X region (Figure 4). The fluxes from the three regions defined are listed in Table 3.
4.5 Images at 1.4 GHz
The data presented here are a subset of the observations of the whole Vela SNR region, which are published by Bock et al. (1998a); Bock et al. (2002). The best of these images were made at resolution. Figure 3 in Bock et al. (1998a) covers a slightly larger region than our Figure 5. Our images were made at the maximum resolution and then smoothed to match the resolution of the other images (), but have the strong background sources removed.
Two sources were found (1.1 & 0.9 mJy) exactly one beam width away to the North and the South of the pulsar position. They are only found in the lowest or highest frequency channels of the pulsar bins after or before the pulsar signal. The pulsar is so strong at these frequencies that we are seeing the images from the bandpass sidelobes (i.e. about 128 MHz above and below our band edges) which of course have a phase change of . Excluding these the integrated flux from this region is 33 mJy. The spectral index calculations using the 1.4-GHz data have these point sources subtracted. The flux from within this region is 2.8 mJy if we fit and subtract a planar background. 1 mJy of this is at the position of the pulsar and probably is flux from the pulse unsuccessfully excluded in the bin selection.
These images are complicated by other strong steep spectrum emission. However the polarised total intensity images, Figure 6, do show a double lobed structure. We have confirmed that the variation of the polarised emission is not associated with bandwidth depolarisation by processing sub-bands separately then recombining them. In particular the measured RM at the edge of the southern lobe (less than 70 rad m-2) is too small to cause any significant losses in intensity and thus produce a false edge.
| Frequency | Integrated flux density/mJy | |||
| GHz | X-ray | less background | North | South |
| 8.51 | ||||
| 5.23 | ||||
| 2.37 | ||||
| 1.38 | ||||
4.6 Spectral Index and rotation measure
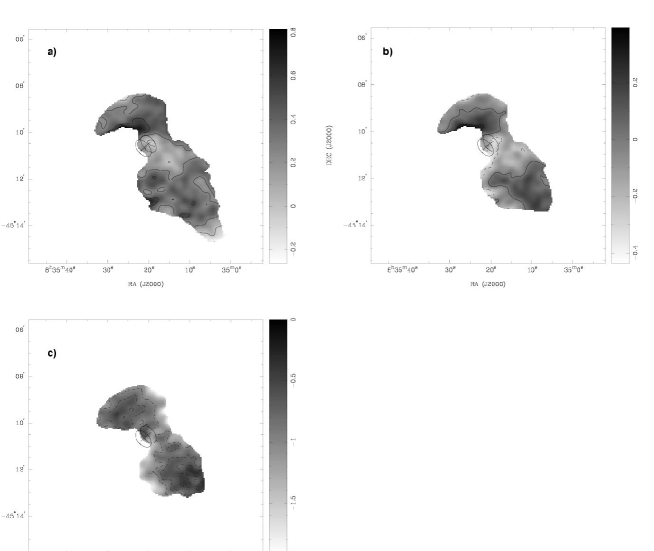
Comparisons between the images were done after smoothing them to . The lower resolution spectral index images made using the 2.4-GHz are not presented. The comparisons between the other three frequencies are shown in Figure 7. The mean spectral index was calculated across the whole region and is listed in Table 4. The errors are the one sigma variation across the image, not that of each independent point. The spectral index was calculated after comparing the data at different frequencies in an ‘intensity-intensity’ plot, to find the offset in the flux scales between the frequencies. This avoids the perennial problem in comparing interferometric images with different uv sampling. It was found that the dominant offset was for 5-GHz which was underestimated by 3 mJy/beam (at ). The formal errors are dominated by the error in the flux scale offset, and are not uniform. They are typically in regions with significant flux density.
| Frequencies (GHz) | ||
|---|---|---|
| 1.38/5.23 | 0.3 | 0.1 |
| 1.38/8.51 | 0.0 | 0.1 |
| 5.23/8.51 | -0.9 | 0.3 |
In most cases the spectral index is uncorrelated with known features, except for between 5-GHz and 1.4-GHz where (where ) across the image, but with a noticeable flattening around the X-ray region. Further observations to investigate this are required. The edges of the lobes in the 5/8-GHz spectral index are remarkably high, but have the poorest signal to noise.
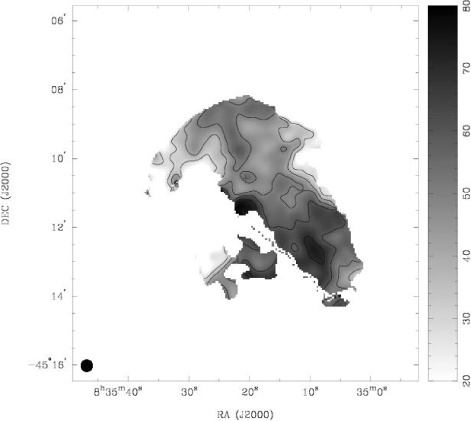
Faraday rotation along the sight line from the nebula has been deduced from the multi-frequency observations. Figure 8 shows its variation across the source. After correction for this propagation effect, the intrinsic orientation of the linearly polarised component (Figure 10) shows a symmetric pattern about the pulsar spin axis projection.
The above rotation measure values imply that there would be some bandwidth depolarisation (a differential Faraday rotation of ) across the 20 cm band. Averaging across the band, however, would only produce a 5% fall in the integrated polarised flux. This effect could be dealt with, but would add little to our results, and has not been attempted.
4.7 Polarised intensity
Polarisation fraction and angle provides one of the greatest diagnostics as to the underlying processes and conditions. We see in the 5 and 8-GHz observations that the polarisation fraction is high, and approaches the theoretical maximum for synchrotron emission. The polarisation position angles (associated with the electric field vectors) are first corrected for Faraday rotation, then are rotated further by 90 degrees to view (as shown in Figure 10) the corresponding magnetic field structure in the emission regions. A clear signature of toroidal magnetic field with respect to the spin axis of the pulsar is apparent.
A more detailed model of the emission, combining the X-ray and radio data, will be presented in the next paper.
4.8 Pulsar Wind Nebula surface brightness
Using the latest estimated distance of 0.3 kpc (Caraveo et al., 2001; Dodson et al., 2003) and using equation 4 from Frail & Scharringhausen (1997) we find the radio luminosity to be ergs/s, or of the spin down energy, . This is below the upper limit for twenty seven of the thirty one non-detections of PWN discussed in Gaensler et al. (2000). It may be that the lack of PWN is not due to their intrinsic rarity, but their inefficiency in converting the spin down power into detectable radio emission. Furthermore the assumption of a proper motion powered shock front clearly breaks down as the bright radio emission features are approximately parallel to the proper motion direction and there is no ‘wake-like’ feature that can be associated with the known proper motion direction (which is close to the projected spin axis of the star).
5 Conclusions
We believe we have observed the true extent and morphology of the radio wind nebula associated with the Vela pulsar. The toroidal magnetic field structure revealed by the polarisation data and the symmetric morphology around the projected spin axis of the star (as in the X-ray case) argue strongly for the nebula to be pulsar (rotation) driven, in terms of both, the recent and continued injection of particles and the (possibly wound-up) magnetic fields in the regions of radio emission. The extension towards the south, seen in the 2.4 and 1.4 GHz images, is unpolarised and thus has a different character from that of the nebula. The rotation measure along these sight-lines appears insufficient to cause significant depolarisation.
This allows the much more complex region, Vela X, to be unambiguously identified with the integrated history of Vela’s emission, but not driven by the current particle population. This affects all the estimates of expected PWN brightness based on the Vela-X region (e.g. Frail & Scharringhausen (1997)).
The most striking feature in comparing the X-ray and radio emissions is that the radio emission starts at a distance from the centre where X-ray emission stops. Given the remarkable similarity in the morphologies in the two bands, it is tempting to model the radio nebula on the lines of the available models for the X-ray data. Results of our preliminary attempts (Lewis et al., 2002) to extend the model of Radhakrishnan & Deshpande (2001) for the radio data have been very encouraging. A more detailed modelling of the radio data is in progress and will be reported later separately.
6 Acknowledgements
The Australia Telescope Compact Array is part of the Australia Telescope, funded by the Commonwealth of Australia for operation as a National Facility, and managed by CSIRO. The access of data from the archive was assisted by Robin Wark. Dr Bock made the calibrated 2.4-GHz data available. The pulsar binning mode required the timing observations made at Mount Pleasant. This research has made use of NASA’s Astrophysics Data System Abstract Service. The X-ray data for the Chandra observations were downloaded from the public access site, the Chandra Data Archive (CDA). This is part of the Chandra X-Ray Observatory Science Centre (CXC) which is operated for NASA by the Smithsonian Astrophysical Observatory.
The 1.4 GHz data was partially processed by Godfrey and See-Toh for their 3rd-year astronomy practical.
References
- Bietenholz et al. (1991) Bietenholz M. F., Frail D. A., Hankins T. H., 1991, ApJL, 376, L41
- Bock et al. (1998a) Bock D. C.-J., Frail D. A., Sault R. J., Green A. J., Milne D. K., 1998a, Memorie della Societa Astronomica Italiana, 69, 919
- Bock et al. (2002) Bock D. C.-J., Sault R. J., Milne D. K., Green A. J., 2002, in ”Neutron Stars in Supernova Remnants” (ASP Conference Proceedings), eds P. O. Slane and B. M. Gaensler High-resolution radio polarimetry of Vela X. p. 187
- Bock et al. (1998b) Bock D. C.-J., Turtle A. J., Green A. J., 1998b, AJ, 116, 1886
- Caraveo et al. (2001) Caraveo P. A., De Luca A., Mignani R. P., Bignami G. F., 2001, ApJ, 561, 930
- Dodson et al. (2003) Dodson R., Legge D., Reynolds J., McCulloch P., 2003, ApJ submitted
- Frail et al. (1997) Frail D. A., Bietenholz M. F., Markwardt C. B., Oegelman H., 1997, ApJ, 475, 224
- Frail & Scharringhausen (1997) Frail D. A., Scharringhausen B. R., 1997, ApJ, 480, 364
- Frater et al. (1992) Frater R. H., Brooks J. W., Whiteoak J. B., 1992, Journal of Electrical and Electronics Engineering Australia, 12, 103
- Gaensler et al. (2000) Gaensler B. M., Stappers B. W., Frail D. A., Moffett D. A., Johnston S., Chatterjee S., 2000, MNRAS, 318, 58
- Helfand et al. (2001) Helfand D. J., Gotthelf E. V., Halpern J. P., 2001, ApJ, 556, 380
- Lewis et al. (2002) Lewis D., Dodson R., McConnell D., Deshpande A., 2002, in ”Neutron Stars in Supernova Remnants” (ASP Conference Proceedings), eds P. O. Slane and B. M. Gaensler The Vela Pulsar Wind Nebula at 6 cm. pp 191
- Pavlov et al. (2000) Pavlov G. G., Sanwal D., Garmire G. P., Zavlin V. E., Burwitz V., Dodson R. G., 2000, American Astronomical Society Meeting, 196, 37.04
- Radhakrishnan & Deshpande (2001) Radhakrishnan V., Deshpande A. A., 2001, A&A, 379, 551