and XMM– observations of Tololo 0109-383
We present and discuss and XMM- observations of the Seyfert 2 galaxy and Compton–thick absorbed source, Tololo 0109-383. The hard X–ray emission (i.e. above 2 keV), is dominated by a spatially unresolved reflection component, as already discovered by previous ASCA and BeppoSAX observations. The soft X–ray emission is partly (15%) extended over about 1 kpc. Below 2 keV, the spectrum is very steep and two emission lines, probably due to recombination to He–like ions of oxygen and neon, are clearly present. Combining X–rays and optical information taken from the literature, we propose an overall scenario for the nuclear regions of this source.
Key Words.:
galaxies: individual: Tololo 0109–383 - galaxies: Seyfert - X-rays: galaxies1 Introduction
Tololo 0109–383 (a.k.a. NGC 424) is a remarkable obscured Seyfert galaxy. It was classified as a Seyfert 2 by Smith (1975). Boisson & Durret (1986) discovered weak broad H and H lines. Broad lines were also observed in polarized light (Moran et al. 2000), the polarization degree being, after correction for starlight, about 4%. Murayama et al. (1998) studied the optical spectrum in detail and, besides confirming the presence of broad H and H lines in direct light, also discovered Fe ii emission, and a partially extended (about 1 kpc) High Ionization Nuclear Emission Line Region (HINER), 70% of which was however unresolved (200 pc). HST/WFPC2 data showed the presence of a dust lane across the central part of the galaxy (Malkan et al. 1998), which may help to explain the observed 1.4 to the NLR (Murayama et al. 1998; it corresponds to N cm-2 for a dust–to–gas ratio equal to that of the Galactic ISM).
In X–rays, Collinge & Brandt (2000) analysed ASCA data and, based on the prominent iron line, the flat spectrum, and the large [O iii]/F(2-10 keV) ratio, argued that the nucleus of Tololo 0109–383 should, rather surprisingly given its optical appearance, be absorbed by Compton–thick matter. This result was fully confirmed by BeppoSAX (Matt et al. 2000; Iwasawa et al. 2001), which measured the absorbing column to be about 2 cm-2. The estimated nuclear 2–10 keV luminosity is about 1043 erg s-1. The IRAS colours are quite warm, suggesting that the IR emission is dominated by dust reprocessing of the nuclear radiation (Matt et al. 2000).
In this paper we present and XMM– observations of Tololo 0109–383. The superior perfomances of these satellites permit us to study the source spectrum down to 0.3 keV and to search for extended emission.
Assuming =70 km s-1 Mpc-1, the redshift of the source, =0.0117, corresponds to a distance of 48.5 Mpc. At this distance, 1″ corresponds to 235 pc.
2 Observations and Data Reduction
2.1 Chandra
observed Tololo 0109–383 on February 4, 2002, with ACIS–S in standard configuration and with a 0.8 s frame time, to reduce pile–up to negligible values. After data reduction, performed with CIAO v.2.2.1, the exposure time is 9181 s.
2.2 XMM–Newton
XMM– observed the source on December 12, 2001. Both EPIC cameras were operated in full–frame mode, as at the flux level expected for the source pile–up is negligible. The data were reduced with SAS 5.3.3, and using a Calibration Index File generated at the time of the analysis, August 15, 2002. Only events corresponding to patterns 0-4 and 0-12 were used for the p-n and MOS, respectively. Events from the two MOS cameras were merged to obtain a single event file. The background in both instruments remained constant during the observation. After data reduction, the exposure times are 4525 s for the p-n, and 7538 s for the MOS.
3 Data Analysis
The data were binned in order to have at least 25 counts per bin, to ensure applicability of statistics, and to oversample the energy resolution by a factor 3. They have been analyzed with xspec.v11.1. Errors correspond to the 90% confidence level for one interesting parameter (=2.7).
3.1 Chandra
3.1.1 Spatial analysis
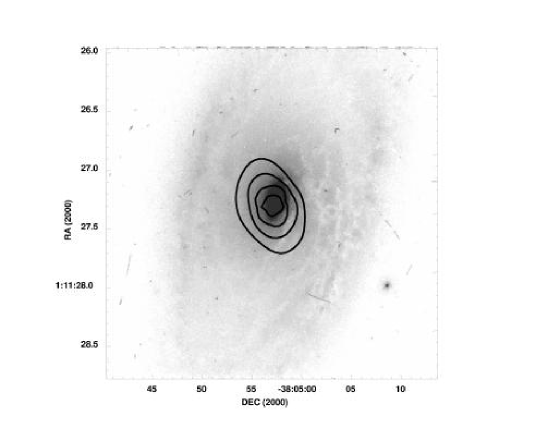
The image is dominated by a point–like source coincident, within the angular resolution, with the optical nucleus (see Fig. 1). However, emission extended over about 5″ is also apparent (Fig 2). This emission is about 13% (17%) of the total flux in the 0.3-10 (0.3-2) keV energy band, and it is somewhat asymmetric (Fig. 1).

3.1.2 Spectral analysis
The spectra were fitted in the 0.3-7 keV energy range (at higher energies no source emission is detected).
We first analysed the spectrum of the extended emission alone (taken from an annulus with inner and outer radii of 1″ and 5″ , respectively). The count rate of this region, over the adopted 0.3-7 keV energy range, is 0.017 cts/s. The spectrum is quite soft, and it is reasonably well fitted either by an absorbed power law with =3.0 and =1.4 cm-2 (=1.0/6 d.o.f.), or by a thermal plasma spectrum (model mekal; (=1.2/5 d.o.f.) with =1.2 keV; for the latter model, only upper limits of 0.19 solar and of 0.9 cm-2 can be put on the metal abundance and the absorber column density, respectively. Given the implausibly low metal abundance, in the following we will adopt the power law model (even if, of course, the low metal abundance may derive from a too simple thermal plasma model; however, statistics is not good enough to test more complex models). In this case, absorption in excess of the Galactic one (1.8 cm-2, Dickey & Lockman 1990) is required, and may be due to the dust lane observed by HST (Malkan et al. 1998). The value of the is broadly in agreement with the reddening to the NLR, which is =1.4 (Murayama et al. 1998).
We then analyzed the spectrum extracted from a circular cell with a radius of 5″ (count rate of 0.14 cts/s). (We choose to analyze the unresolved+extended spectrum, instead of the nuclear spectrum alone, to make easier the comparison with the XMM– spectrum, as well as with spectra from previous satellites. In any case, unresolved emission dominates at all energies.) Following Iwasawa et al. (2001) we adopted a model composed of: a nuclear power law absorbed by a cold screen of 2 cm-2; a cold reflection component (pexrav model; the illuminating power law index has been initially fixed to 2, given the limited statistics available); a 6.4 keV narrow iron line; a soft X-ray emission component, parameterized by a power law; and Galactic absorption. The fit is completely unacceptable (=4.4/36 d.o.f.; see Fig. 3), partly due to two emission features at about 0.55 and 0.9 keV (the latter was indeed already found by Iwasawa et al 2001 in the ASCA spectrum). The inclusion of these two lines improves the fit significantly; however, the is still unacceptable (=2.3/32 d.o.f.). Adding a thermal plasma component further improves the quality of the fit (=1.68/29 d.o.f.), which however remains poor. A much better, and fully acceptable, fit (=0.88/31 d.o.f.) is instead obtained by allowing the cold absorption, covering all components, to be larger than the Galactic value. Interestingly, the best fit value, cm-2, is what is expected from the optical extinction. No significant improvement is found after adding either a He–like or a H–like iron line. The best–fit values are summarized in Table 1, and the spectrum is shown in Fig. 4. As the power law index of the soft component is much larger than 2, the value we assumed for the hard X-ray component (both transmitted and reflected), we tried to link the two values to each other. The resulting value of is 2.9, but the fit is unacceptable (=1.96/31 d.o.f.). A fit with a thermal plasma model instead of the soft power law plus two lines also fails to give an acceptable fit (=1.8/34 d.o.f) mainly because the two lines remain unfitted. Adding instead either the thermal model or a black body to the best fit spectrum, no further improvement is found.
To understand whether the two soft X–ray lines can originate in the extended emission, we refitted its spectrum adding the two lines in turn (with the energies fixed to 0.57 and 0.92 keV, respectively; see Sect. 4). Neither line is required, the upper limits being 3010-5 and 10-5 ph cm-2 s-1, respectively. The latter is inconsistent with the value obtained from the total spectrum. Assuming that the two lines are emitted by the same material, we can conclude that at least a large part of them, and possibly all, is associated with the unresolved component.
The 2–10 (0.5–10) keV observed flux is 1.6(1.8) erg cm-2 s-1, corresponding to an observed luminosity at source of 4.8(5.4) erg s-1.


3.2 XMM–
At the spatial resolution of XMM–, the source is point like. The p-n (MOS) spectrum was extracted using a circular source cell with a radius of 40″ (45″ ) and fitted in the 0.5-10 (0.3-10) keV energy range, where the instrument calibration is reliable. The MOS spectra were combined together, once we verified that the spectral results from the individual units were consistent within the statistical uncertainties. In this energy range, the count rate is 0.27 (0.18) cts/s. The flux of the source and the exposure time are too low to give a significant detection in the RGS.
We fitted the XMM– EPIC spectra with the same model adopted for the Chandra spectrum. The fit is acceptable (=1.22/78 d.o.f.; see Fig. 5 and Table 1). Again, neither a He–like nor a H–like iron line is required by the data. Adding the iron K component at 7.06 keV, no significant improvement () is found. The best–fit value for its flux, however, is about 17% that of the K component, roughly as expected. The best–fit model is shown in Fig. 6. Again, substituting the soft power law plus lines with a thermal plasma model gives a significantly worse fit (=1.40/81), besides an unacceptably low (0.02) metal abundance. The addition of either a thermal plasma or black body component to the best fit model of Table 1 results in no statistical improvement.
In Fig. 5, some residuals around the iron K line are apparent. We therefore allowed both the line energy and width to vary. No significant improvement is however found (=0.8 with two less d.o.f.). The best fit line energy is 6.380.04 keV, and the upper limit to is 90 eV.
Finally, the 2–10 keV (0.5–10) observed flux is 1.6(1.9) erg cm-2 s-1, in agreement with the one (as well as with ASCA and BeppoSAX fluxes, Iwasawa et al. 2001).


| Parameter | XMM–Newton | |
|---|---|---|
| (1021 cm | 2.7 | 1.8 |
| 4.1 | 3.9 | |
| (keV) | 0.57 | 0.55 |
| (10-5 ph cm-2 s-1) | 30 | 18 |
| (eV) | 150 | 90 |
| (keV) | 0.89 | 0.90 |
| (10-5 ph cm-2 s-1) | 3.0 | 1.5 |
| (eV) | 100 | 50 |
| (keV) | 6.4 (fixed) | 6.4 (fixed) |
| (10-5 ph cm-2 s-1) | 2.4 | 1.5 |
| (eV) | 960 | 790 |
| 2 (fixed) | 2 (fixed) | |
| (1024 cm | 2 (fixed) | 2 (fixed) |
| /d.o.f | 0.82/31 | 1.22/78 |
4 Discussion
4.1 The soft X–ray emission
The soft X–ray emission of Tololo 0109-383 is partly (about 15%) extended over a scale of 5″ , interestingly similar to the scale over which part of the HINER is extended (Murayama et al. 1998). However, the ionization structure of the HINER is too low to reflect soft X–rays efficiently, and therefore the two regions are probably not associated with each other. The quality of the spectrum of the extended emission is not good enough to allow for a detailed spectral analysis. The spectrum is, in any case, consistent with that of the unresolved soft X–ray emission, suggesting a possible common origin as reflection of the nuclear radiation from ionized matter.
Two emission lines, partly if not entirely coming from the unresolved component, are also clearly present. One of them, at about 0.9 keV, was already observed by Iwasawa et al. (2001) in the ASCA spectrum. Its energy is consistent with either the O viii recombination continuum (0.87 keV) or with the Ne ix (0.92 keV) recombination line. A contribution from iron L lines is also possible. The other line, at 0.55 keV, is most naturally explained as a O vii recombination line (0.57 keV). If the two lines originate from the same material, the 0.9 keV line is therefore more likely due to Ne ix. It is worth noting that the emitting region cannot be associated with the HINER, as the ionization of the latter is much lower.
A possible site of origin for these two lines is the same reflector responsible for the iron K line, if it is mildly ionized, similar to what was found by Bianchi et al. (2001) for the Circinus Galaxy. They found that an ionization structure in which He–like ions of light elements may coexist with iron less than xvii is possible. We therefore fitted both the and XMM– spectra with the pexriv model for ionized reflection instead of the pexrav model, with the ionization parameter fixed to the same value found for the Circinus Galaxy (Bianchi et al. 2001). In both cases the fit is significantly worse (=1.02/31 d.o.f and 1.55/78 d.o.f. for and XMM–, respectively), and the soft power law is steeper than before (5). The equivalent widths of the two lines with respect to the mildly ionized reflector (3 and 0.9 keV, respectively) are however reasonable (e.g. Matt et al. 1996). Therefore, we consider this model as less favoured but still possible.
The power law photon index of the soft component is large, i.e. around 4. Assuming that this component is due to reflection of the nuclear radiation, and neglecting self-absorption effects, this would imply a soft (i.e. below about 2 keV) X–ray nuclear emission more typical of Narrow–Line Seyfert 1s (Boller et al. 1996) than of classical Seyferts. Indeed, Boisson & Durret (1986) measured for the broad lines a FWHM of 1800 km s-1, slightly lower than the value of 2000 km s-1 conventionally adopted as the boundary between Narrow–Line and classical Seyfert 1s. However, Murayama et al. (1998) measured a FWHM of about 3800 km s-1 for the broad H component (but only 1500 km s-1 for the H), and Moran et al. (2000) found even larger wings in the lines observed in polarized light. In this case, Tololo 0109-383 would probably be the most X–ray soft among classical Seyferts.
At least part of the soft excess may however be due to several unresolved emission lines from photoionized plasma, similarly to what found in NGC 1068 (Kinkhabwala et al. 2002), weakening the case for a very steep continuum. Unfortunately, the source is too faint for the RGS to be profitably used, and we cannot check directly this hypothesis.
4.2 The absorption structure
Combining previous ASCA and BeppoSAX results (Collinge & Brandt 2000; Iwasawa et al. 2001) with the and XMM– observations discussed here, we can conclude that at least two X–ray absorbers are present: one Compton–thick, obscuring the nucleus on a small scale, the other Compton–thin, obscuring the soft X–ray emission and possibly the extended emission. The latter may be associated with the dust lanes observed by HST to obscure the central part of the galaxy (Malkan et al. 1998). This provides one more piece of evidence in favour of the co–existence of both Compton–thin and Compton–thick matter in the circumnuclear regions of Seyfert galaxies (see e.g. Matt & Guainazzi 2002 and references therein).
The problem here is that the optical broad lines appears to be seen through the dust lane rather than the Compton–thick X-ray absorber. Recently, it has become clear that a fraction of type 1 nuclei are absorbed in X–rays (e.g. Maiolino et al. 2001a; Fiore et al. 2001) and, more generally, that X–ray absorption column densities are often much larger than would be expected from the amount of optical extinction (e.g. Granato et al. 1997). While a fraction of hard X-ray spectrum, type 1 AGN may be explained in terms of a temporary switching–off of the nucleus, which makes them for a while reflection–dominated and so apparently Compton–thick absorbed (Matt et al. 2002), this is certainly not the case for Tololo 0109-383, whose nucleus is definitely absorbed by Compton–thick matter (Iwasawa et al. 2001). Let us call this matter, for simplicity, the ‘torus’.
There are several possible solutions to this problem (see Maiolino et al. 2001b for a discussion).
First of all, the Broad Line Region (BLR) may be located outside the torus. However, the typical BLR size, from reverberation mapping studies, is usually of the order of light-days or of light-weeks, at least for a moderately luminous source as Tololo 0109-383, while the inner surface of the torus is expected to have a size of a fraction of a pc or more (e.g. Bianchi et al. 2001 and references therein). Moreover, the ratio between the fluxes of the broad and narrow components is very low (less than 1, Murayama et al. 1998). Therefore, even though we cannot exclude that the size of either the BLR or the torus, or both, are different than usual in this object (we do not have any direct measurement of them) this possibility seems unlikely.
Another possibility is that the dust–to–gas ratio of the absorber is very low, due to dust sublimation (Granato et al. 1997). However, the H/H ratio is similar for the narrow and broad components, suggesting that they are observed through the same absorber, which is probably the dust lane observed by HST. Therefore, dust sublimation must be almost complete, to avoid further extinction of the broad components, and the low fluxes of the broad components would remain unexplained. An alternative solution, proposed by Maiolino et al. (2001b), is that the sizes of the dust grains are much larger than that in the ISM of our own Galaxy, changing dramatically the extinction curves. This solution has the merit of explaining qualitatively the low fluxes of the broad line components, but the expected extinction, given the X–ray measured column density, would be too high to allow them to be observed at all (see the figures in Maiolino et al. 2001b).
All these problems can be avoided if the broad lines are actually seen in reflected, rather than direct, light. Indeed, the broad lines in this object are best seen in polarized light (Moran et al. 2000) and therefore at least part of them must be reflected. It is possible that the reflecting medium is the same responsible for the soft X–ray excess and the O vii and Ne ix lines we observe in the and XMM– spectra. One may wonder why in this source the reflected light would be so intense to permit the detection of broad lines in direct light, despite the fact that the polarization degree is by no means exceptional. This is possible if the covering factor and optical depth of the reflecting matter are large enough; it must be recalled that a large covering factor implies a low polarization degree, for obvious geometrical reasons. Unfortunately, this hypothesis cannot be readily tested in X–rays because the evidence of a spectral break in the nuclear spectrum makes it difficult to estimate the nuclear–to–scattered flux ratio.
5 Summary
To summarize, the and XMM– observations, together with previous X–ray and optical observations, suggest the following scenario for Tololo 0109-383. The nucleus is absorbed by Compton–thick material, the nuclear radiation being reflected by: a) cold material (probably the inner wall of the torus) giving rise to the Compton reflection component and the iron K line (and, by reprocessing, to the infrared emission, Matt et al. 2000 and Iwasawa et al. 2001); b) ionized matter, responsible for the soft X–ray excess, and the oxygen and neon He–like lines. This ionized matter may coincide with that reflecting and polarizing the otherwise obscured BLR. Further material, partly spatially resolved, is responsible for the HINER; the size of the spatially extended HINER emission (1 kpc) is similar to that of the extended soft X–ray emission, but probably the two regions are not associated with each other. Finally, all these components are seen through a dust lane, responsible for the Balmer decrement and the absorption of the soft X–ray emission.
Acknowledgements
GM and SB acknowledge ASI and MIUR (under grant cofin-00-02-36) for financial support. WNB acknowledges the Chandra X-ray Center grant GO2-3123X and the NASA LTSA grant NAG5-8107. This research has made use of the NASA/IPAC Extragalactic Database (NED) which is operated by the Jet Propulsion Laboratory, California Institute of Technology, under contract with the National Aeronautics and Space Administration. This paper is partly based on observations obtained with XMM-Newton, an ESA science mission with instruments and contributions directly funded by ESA Member States and the USA (NASA).
References
- (1) Bianchi S., Matt G., & Iwasawa K., 2001, MNRAS, 322, 669
- (2) Boisson C., & Durret F., 1986, A&A, 168, 32
- (3) Boller T., Brandt W.N., & Fink H., 1996, A&A, 305, 53
- (4) Collinge M.J., & Brandt W.N., 2000, MNRAS, 317, L35
- (5) Dickey J.M., & Lockman F.J, 1990, ARA&A, 28, 215
- (6) Fiore F., Giommi P., Vignali C., et al., 2001, MNRAS, 327, 771
- (7) Granato G.L., Danese L., & Franceschini A., 1997, ApJ, 486, 147
- (8) Iwasawa K., Matt G., Fabian A.C., et al., 2001, MNRAS, 326, 119
- (9) Kinkhabwala A., Sako M., Behar E., et al., 2002, ApJ, 575, 732
- (10) Maiolino R., Marconi A., Salvati, et al., 2001a, A&A, 365, 28
- (11) Maiolino R., Marconi A., & Oliva E., 2001b, A&A, 365, 37
- (12) Malkan M.A., Gorijan V., & Tam R., 1998, ApJS, 117, 25
- (13) Matt G., Brandt W.N., & Fabian A.C., 1996, MNRAS, 280, 823
- (14) Matt G., Fabian A.C., Guainazzi M., et al., 2000, MNRAS, 318, 173
- (15) Matt G., Guainazzi M., & Maiolino R., 2002, MNRAS, submitted
- (16) Moran E.C., Barth A.J., Kay L.E., & Filippenko A.V., 2000, ApJ, 540, L73
- (17) Murayama T., Taniguchi Y., & Iwasawa K., 1998, ApJ, 115, 460
- (18) Smith M.G., 1975, ApJ, 202, 591