Chapter 0 X-rays from Cataclysmic Variables
1 Introduction
Cataclysmic Variables111See Hack & La Dous (1993) and Warner (1995) for comprehensive overviews. (CVs) are a distinct class of interacting binaries, transferring mass from a donor star to a degenerate accretor, a white dwarf (WD). In all observational determinations, and as is required by theory for stable mass transfer, the donor star is of lower mass than the accretor.
The majority of CVs have orbital periods, , between 75 min and 8 h (see Ritter & Kolb 2003) and consist of Roche Lobe-filling main sequence donors and WDs. These are WD analogues of the low-mass X-ray binaries (LMXBs; see Chapter 1). In the period range 8 h–3 d the donors must have larger radii than dwarfs in order to fill their Roche Lobes and are therefore evolved subgiants. A few CVs are found with 200 d, which require giant donors for them to be Lobe-filling. The absence of evolved CVs with periods 3 to 200 d is connected with the dynamical instability that results from an initial donor that had a mass larger than about 67% of that of the WD; such binaries will have experienced rapid mass transfer and shortened their periods during a common envelope phase. Beyond 200 d, mass-transferring systems also exist. These constitute the symbiotic binaries (SBs) and are in general not Roche Lobe-filling, but instead consist of a WD orbiting in the wind of a supergiant, and are thus analogues of the high-mass X-ray binaries (see Chapter 1).
At the short end of the period range a different kind of CV exists, i.e., in which the mass losing donors are themselves WDs; they are entirely deficient in hydrogen. These helium-transferring CVs are known, after the type star, as AM CVn stars and are observed to have from 60 min down to at least as short as 10 min. They have evolved by passage through two common envelope phases, which leaves the cores of both of the component stars exposed.
The CVs are divided into subtypes. These were originally based entirely on the behaviour seen in long-term optical light curves, but to this are now added more subtle parameters such as the presence of polarisation. In essence, a CV’s gross behaviour is determined by the rate of mass transfer from the donor, , and the strength of the magnetic moment, , of the WD. Other parameters, such as , mass ratio, and chemical abundances, have less effect; but the brightness and spectral variations on an orbit time scale can depend strongly on the inclination.
For 1031 G cm-3 (corresponding to a magnetic field strength 104 G) the WD is essentially “non magnetic” (but see Sect. 1) and mass is transferred from donor to WD via an accretion stream and accretion disk without any significant magnetic influence on the fluid flow. Even for up to 1033.5 G cm-3 a stream and accretion disk can form, but the inner regions of the disk are removed by the magnetosphere of the WD, within which fluid flow is magnetically channelled. For larger no disk can form at all; the stream flow from the donor couples onto field lines from the WD before the stream can circle around the WD. These configurations, which apply for typical 10-10–10-8 M⊙ yr-1, are known as intermediate polars (IPs) for the systems with intermediate field strength222The name ‘intermediate polar’ was introduced by Warner (1983)., and polars (or AM Her stars, after the type star) for those with strong fields. The field in polars is so strong that it couples to the field of the donor and forces the WD to corotate with the binary; it also prevents the formation of an accretion disk. In IPs the WD does not corotate. The term DQ Her star is often used for IPs of rapid rotation, typically 250 s, but some use the term in place of IP, treating DQ Her as the type star.
Where disks exist there are two principal behaviours, resulting from the different viscosities (and hence ability to transport angular momentum) in cool disks and hot disks (see Chapter 13). For low through the disk, the disk is lower in temperature and the viscosity is too low to transport mass through the disk as fast as it arrives from the donor; this state is referred to as quiescence. The quiescent disk (which is not stationary) therefore acts as a reservoir of gas, and when a critical density is reached it becomes optically thick, heats up and increases in viscosity, and rapidly transfers gas onto the WD. The resultant release of the gravitational energy of the stored gas gives rise to dwarf nova (DN) outbursts. The DN class is subdivided into U Gem stars which have outbursts on time scales of weeks, and Z Cam stars where outbursts are occasionally interrupted by a standstill at a brightness intermediate between outburst and quiescence. In systems with short an additional phenomenon occurs – superoutbursts, which are typically brighter and five times as long as normal outbursts, during which humps in the light curves (so-called ‘superhumps’) are present with a period of a few % longer than . Superoutbursts are thought to be due to tidal stresses between the outer disk and donor, adding to the higher viscous stress in the outer disk; it may even result in additional mass transfer from the donor. This subtype of DN is known as SU UMa stars.
Outbursts, usually of lower amplitude and short duration, can arise in the truncated disks of IPs. On the other hand, if is high enough it can maintain the disk at high viscosity, producing an equilibrium state that does not undergo normal DN outbursts (though modified outbursts are sometimes seen). These systems are known, from the appearance of their spectra, as nova-like systems (NLs). Those showing absorption lines are called UX UMa stars, and those showing emission lines are RW Tri stars.
The strongly magnetic systems have no disks and therefore lack outbursts. But it is common for polars to show states of low luminosity caused by lowering of by as much as two or three orders of magnitude. Other types also show (occasional) low states, especially NLs with 3(h)4, which are known as VY Scl stars.
It is supposed that all CVs, with the exception of the helium-transferring AM CVn stars, undergo thermonuclear runaways at the base of the accreted hydrogen-rich layers on the WDs as soon as the layers are massive enough (typically 10-4 M⊙). These produce classical nova (CN) eruptions and are in some ways the equivalent of X-ray bursts in LMXBs (see Chapter 3). Systems which have shown nova eruptions more than once are referred to as recurrent novae (RNe), whereas SBs with nova eruptions are known as symbiotic novae (SBNe).
The X-ray behaviours are correlated with the above described CV subtypes, but not always in a positive fashion. During a DN outburst hard X-rays333With ‘soft’ and ‘hard’ X-rays we generally refer to X-rays with energies of order 10 eV and of order keV, respectively. have been seen to increase at the beginning (often with a delay of up to a day after the optical outburst begins), but then are suppressed until near the end of the outburst. Similarly, the high (and, therefore, high accretion luminosity) NLs have relatively low X-ray luminosities, . On the other hand, soft X-ray∗ fluxes are greatly enhanced during DN outbursts, again with a possible delay with respect to the optical, which is caused by the time taken for an outside-in outburst to travel from the cooler outer parts of the disk to the inner disk and the WD/disk boundary layer (BL).
The polars have high soft and the IPs have relatively high hard . All of these different X-ray behaviours are simply connected with the optical depth of the BL in the non-magnetic CVs and with the nature of the channelled accretion flow in the magnetic CVs. More details are given in subsequent Sections.
X-rays may also be generated in other parts of CV structures – e.g., in the shock waves where gas ejected by nova eruptions meets the interstellar medium; on the hot WD surface after a nova eruption; and in minor contributions from the magnetically active regions on the surface of the donor.
SS Cyg, one of the optically brightest DN (mV12–8), was the first CV to be detected in X-rays during a rocket flight when it was in outburst (Rappaport et al. 1974). The spectrum was soft with a black-body temperature, 130 eV. In its quiescent state it was first detected by ANS, both in soft and hard X-rays. In the soft band, its flux was only a few percent of that observed during outburst (Heise et al. 1978). Since then many more CVs have been detected in X-rays.
We here review X-ray observations of CVs, with some emphasis on what has been achieved in the last decade, up to 2003. For earlier, more general, reviews we refer the interested reader to, e.g., Córdova & Mason (1983), Hack & La Dous (1993), Córdova (1995) and Warner (1995). We note that a lot of CVs have recently been found in globular clusters; we refer to Chapter 8 for an overview of this subject.
2 X-ray emission from non-magnetic CVs
1 General properties
The collective X-ray properties of CVs have been the subject of several studies using observations from Einstein (Becker 1981; Córdova & Mason 1983, 1984; Patterson & Raymond 1985a; Eracleous et al. 1991a,b), ROSAT (Vrtilek et al. 1994; van Teeseling & Verbunt 1994; Richman 1996; van Teeseling et al. 1996; Verbunt et al. 1997), and EXOSAT/ME (Mukai & Shiokawa 1993). With a few exceptions all non-magnetic CVs444See, e.g., Verbunt (1996) and Mukai (2000) for earlier reviews of X-rays from non-magnetic CVs. radiate at X-ray flux levels 10-11 erg cm-2 s-1 (e.g., Patterson & Raymond 1985a [0.2–4 keV]; Eracleous et al. 1991a [0.1–3.5 keV; 2–10 keV]; Mukai & Shiokawa 1993 [2–10 keV]; Richman 1996 [0.1–2.4 keV]). This translates to, generally, 1029–1032 erg s-1. All the CVs below 1030 erg s-1 are short-period DNe or low-state magnetic CVs (Verbunt et al. 1997).
Among the non-magnetic CVs the ratio of the X-ray flux to optical and/or UV flux, /, decreases along the sequence SU UMa stars (/0.1) – U Gem stars – Z Cam stars (/0.01) – UX UMa stars (/10-3), due mainly to variations in the optical/UV flux (Verbunt et al. 1997; see also van Teeseling & Verbunt 1994; van Teeseling et al. 1996). Of the few exceptions are, e.g., the double degenerate AM CVn systems (Sect. 7). We note that for magnetic CVs / is comparable to that of the SU UMa stars (Verbunt et al. 1997). The general pattern is in agreement with Patterson & Raymond (1985a; see also Richman 1996) who find that non-magnetic CVs with high show low /, and in agreement with the fact that / is seen to decrease with increasing (van Teeseling & Verbunt 1994; van Teeseling et al. 1996; see also Córdova & Mason 1984)555We caution, however, that the measurements for CVs with short orbital periods are biased towards quiescent systems (i.e., CVs wit low ). X-ray observations of high short orbital period CVs could resolve the issue.. This latter correlation stems from the fact that the UV flux is a strongly increasing function of , which in turn is likely related to : a high apparently causes the disk to emit more UV flux, but not more X-ray flux (see, e.g., van Teeseling et al. 1996). This general pattern is somewhat perturbed, however, by the anti-correlation between the inclination, , and the observed X-ray flux (van Teeseling et al. 1996; see also Patterson & Raymond 1985a).
An empirical relation between the equivalent width, EW, of the optical H emission line and / exists (Patterson & Raymond 1985a; Richman 1996). This relation predicts / to within a factor of 3. The correlation of / with EW(H) is thought to reflect also an underlying correlation with , since EW(H) is known to correlate with the absolute visual magnitude of the disk, which in turn is correlated with (e.g, Patterson 1984; Warner 1995). Thus low systems produce strong H emission lines and a larger /.
The absorption column densities, , as derived from X-ray spectral fits are generally in the range 1020–1021 cm-2 (e.g., Eracleous et al. 1991a; Richman 1996). VW Hyi has one of the lowest values of for any CV (610-17 cm-2; Polidan et al. 1990), which makes it an ideal CV to study in the EUV and soft X-ray range. Comparison of the values with the colour excess derived from the 2200Å feature (Verbunt 1987), shows that is often higher than predicted on the basis of the average relation derived by Predehl & Schmitt (1995). The excess column may be related to absorbing gas in the CV itself, which can be responsible for some of the orbital variations seen, especially since the CVs displaying high absorbed spectra are known to have a high inclination (e.g., Eracleous et al. 1991a; Verbunt 1996; see also Sects. 3, 4).
The X-ray spectral flux distributions within the 0.5–2.5 keV band seem to be fairly similar for most CVs (Verbunt et al. 1997), although it appears that VY Scl stars in their high state and non-SU UMa stars have somewhat harder spectra than SU UMa and UX UMa stars (van Teeseling et al. 1996). Individual systems, however, may show significant epoch-to-epoch variability both in luminosity and temperature (e.g., Mukai & Shiokawa 1993). X-ray spectra of non-magnetic CVs generally show (bremsstrahlung) temperatures in the range 1–5 keV (e.g., Córdova et al. 1981; Córdova & Mason 1983, 1984; Eracleous et al. 1991a; Mukai & Shiokawa 1993). Quiescent DNe are hard X-ray sources with (bremsstrahlung) temperatures of a few keV (e.g., Patterson & Raymond 1985a; Vrtilek et al. 1994) up to 10 keV (e.g., Córdova & Mason 1983). Systematic residuals in the fitted X-ray spectra, however, already indicated that the X-ray emission is not well described by the single-temperature models, both for low and high CVs, but instead must be described by a range of temperatures (e.g. Eracleous et al. 1991a; Richman 1996; see Sect. 5).
The emission measure, EM666Defined as EM=, where is the electron density and the emitting volume., is not a strong function of (van Teeseling et al. 1996). It decreases, however, for CVs with higher . For CVs with 70∘ this cannot be due to obscuration of the X-ray source by matter in the outer parts of the disk or by the donor. The anti-correlation between EM and excludes models in which the X-rays are emitted in a relatively large optically thin volume. On the other hand, if the X-rays originate from the inner part of the disk and the scale height of the optically thin X-ray source is not much higher than the disk thickness (as eclipse observations of quiescent DN suggest, see Sect. 3), EM could depend on . Van Teeseling et al. (1996) come to the conclusion that in high-inclination systems most of the X-ray flux is absorbed by the disk.
So, what is the origin of the X-ray emission in non-magnetic CVs? In the next subsection we describe the major source of X-rays in these systems, the BL.
2 The boundary layer model
In non-magnetic CVs the accretion is governed by the disk. Basic theory predicts that half of the gravitational potential energy of the accreting material is liberated through the viscosity in the disk, while the other half is liberated in a boundary layer (BL) between the disk and the surface layer of the WD (e.g., Shakura & Sunyaev 1973; Lynden-Bell & Pringle 1974; Pringle 1981). Material in the BL moves with Keplerian speeds and collides with the WD which is presumably rotating more slowly than break-up velocity. This results in luminosities of the disk and BL of , where and are the mass and radius of the WD, respectively. For a WD with =1 M⊙, = cm and =10-10 M⊙ yr-1 this amounts to about 41032 erg s-1. With these modest luminosities the X-rays do not strongly influence the appearance of the disk, as they do in bright LMXBs. The disk is generally too cool (1 eV) to emit X-rays. It radiates mostly at optical and ultraviolet (UV) wavelengths, whereas the BL mostly radiates in the extreme ultraviolet (EUV) and in X-rays (e.g., Bath et al. 1974b).
When is low, such as in DNe in quiescence, the BL is observed to be optically thin. Shocks make the gas hot with a temperature of about the virial temperature, =20 keV. When is high, such as in DNe in outburst or in NLs, the BL is observed to be optically thick. Cooling of the BL is efficient and the X-ray spectrum is thermalised with an approximate black-body temperature of =10 eV and 1034 erg s-1 (e.g., Pringle 1977; Pringle & Savonije 1979; Tylenda 1981; Narayan & Popham 1993, Popham & Narayan 1995). The critical , , generally depends on and the viscosity in the disk, and is about 10-10 M⊙ yr-1.
Although X-ray observations of CVs are often interpreted within the above described framework of the standard BL model (e.g., many quiescent DNe were found to be modest hard X-ray sources), evidence that BLs really exist in CVs is generally indirect. In the next subsections we provide the observational efforts to find this BL, both in quiescence and outburst of DNe, as well as in other high- CVs.
3 Quiescent dwarf novae
For CVs with Patterson & Raymond (1985a) show that the hard X-ray data from Einstein were generally consistent with hot optically thin emission from the BL. The observed temperatures are in the range expected. However, most of these CVs show less BL radiation than predicted (e.g., Pringle et al. 1987; Belloni et al. 1991; van Teeseling & Verbunt 1994; Vrtilek et al. 1994). This also holds for high systems (see Sect. 4), and it is referred to as ‘the mystery of the missing BL’ (see Ferland et al. 1982). Different explanations for this lack in quiescence have been suggested: disruptions of the inner disk by magnetic fields (Livio & Pringle 1992; Lasota et al. 1995; Warner et al. 1996), coronal siphon flows (Meyer & Meyer-Hofmeister 1994; Lasota et al. 1995), or irradiation by the (relatively) hot WD (King 1997); a rapidly rotating WD (e.g., Ponman et al. 1995); a rapidly spinning accretion belt (Sion et al. 1996); reflection effects and cooling flows (Done & Osborne 1997). Alternatively, the BL largely radiates an additional very soft component (10 eV) which would remain undetectable due to interstellar absorption (e.g., Patterson & Raymond 1985b).
High-inclination CVs provide an opportunity to locate the X-ray emitting regions. When the X-ray source is eclipsed one can constrain its size and location using the orbital phase, , and the duration of ingress and egress. One factor complicating such observations, however, is that eclipsing CVs tend to be fainter in X-rays than low-inclination CVs, so eclipse studies have been rather count-rate limited (e.g., van Teeseling et al. 1996).
X-ray eclipses have been seen during quiescence of the DNe HT Cas (Mukai et al. 1997; 81∘), Z Cha (van Teeseling 1997a; 82∘) and OY Car (Pratt et al. 1999a; Ramsay et al. 2001a; Wheatley & West 2002; 83∘), as well as during a low state in quiescence of HT Cas (Wood et al. 1995a). They all occur at the time of the optical WD eclipse. The X-ray ingress and egress are rapid; in OY Car their duration is significantly shorter than in the optical (303 s vs. 432 s; Wheatley & West 2002). This is consistent with the indication that the total X-ray eclipse in HT Cas has a slightly shorter duration than the optical one (by about 27 sec; Mukai et al. 1997). If one assumes that the optical contact points represent the contact points of the WD, then the X-ray emitting region must be smaller than the WD, possibly originating from a broad equatorial belt of which the lower half is absorbed (Mukai et al. 1997; van Teeseling 1997a; Ramsey et al. 2000a; Wheatley & West 2002). This also explains the observed anti-correlation between and the EM (van Teeseling et al. 1996; see Sect. 1). Since the WD is too cool to produce X-rays, a BL must be responsible for the out-of-eclipse X-ray emission (see Mukai et al. 1997).
In eclipse there is residual X-ray emission at about 1% of the out-of-eclipse flux, with 31028 erg s-1 and a soft spectrum (1 keV). The fact that this emission in eclipse is softer than that seen out of eclipse seems to rule out the possibility that the residual flux is BL emission scattered into our line of sight by circumstellar material (Wheatley & West 2002). The luminosity (e.g., Rosner et al. 1985; Hempelmann et al. 1995), as well as the temperature (e.g., Schmitt et al. 1990), are consistent with coronal emission from a cool main-sequence donor. Ramsay et al. (2001a), however, argue that the residual emission may come from a weak remnant of a large corona, which is more prominent during outburst (see Sect. 4).
Apart from eclipses, dips in the X-ray light curves have been observed, up to 50% deep, during quiescence in U Gem (at 0.3 and 0.8: Szkody et al. 1996, 2000a; 65∘), Z Cha (0.7–0.8: van Teeseling 1997a), WZ Sge (0.7: Patterson et al. 1998; 75∘), and OY Car (0.2–0.5: Ramsay et al. 2001a). They are only apparent at low X-ray energies, which indicates absorption effects. Similar kinds of dips have also been found during outburst (see Sect. 4).
In order for the dips to be visible at inclinations such as in U Gem the material must be located far from the orbital plane (e.g., Mason et al. 1988; Naylor & La Dous 1997). Note that in quiescence the X-ray dips in U Gem were less deep than during outburst. This means that the X-ray emitting region must be only slightly larger than the outburst BL and that the absorbing material that was present at outburst must maintain a similar location in quiescence. The small residual X-ray flux seen may be scattered into the line of sight from high above the plane (by a disk corona or a wind; e.g., Naylor & La Dous 1997; Mason et al. 1997; see also Sect. 5) or may possibly originate from a hot corona of the donor (Wood et al. 1995b). HST observations of OY Car in quiescence show that the UV emission from the WD surroundings is also absorbed by matter above the disk, which is referred to as an ‘iron curtain’ (see Horne et al. 1994). However, this curtain does not always seem to exist (Pratt et al. 1999a). Note that no dips were found in the quiescent UV light curves of OY Car (Ramsay et al. 2001a).
Similar kinds of absorption dips have also been seen in IPs (see Sect. 4), as well as in LMXBs (e.g., Mason 1986; Parmar & White 1988; White et al. 1995; Kuulkers et al. 1998, and references therein). Note that column densities of 1019 cm-2 to 1022 cm-2 in CVs (e.g., Naylor & La Dous 1997) are sufficient to extinguish soft X-ray emission during the dips, whereas maximum column densities of 1023 cm-2 are typically recorded in LMXBs.
A popular model for the dips is the one outlined by Frank et al. (1987). They explain the dips as the interaction of the accretion stream with the disk, which splashes material out of the plane to form cool clouds that obscure the radiation produced close to the compact object (see also Armitage & Livio 1996, 1998; Kunze et al. 2001). For CVs they predict a single broad dip between phases 0.6 and 0.8, exactly as observed in, e.g., U Gem.
4 Outbursting dwarf novae and other high- CVs
For most CVs in quiescence onto the WD is of the order of 10-12–10-11 M⊙ yr-1 (e.g., Patterson 1984; Warner 1995). During an outburst increases by 2 orders of magnitude, so the disk is likely to cross . The CV is then expected to change from a hard to a soft X-ray emitter. However, the situation appears to be not that simple, as we will show below.
Soft X-rays have been detected during outbursts of SS Cyg (e.g., Rappaport et al. 1974; Mason et al. 1978; Córdova et al. 1980b; Jones & Watson 1992; Ponman et al. 1995), U Gem (e.g., Córdova et al. 1984), VW Hyi (van der Woerd et al. 1986; Mauche et al. 1991; van Teeseling et al. 1993; Wheatley et al. 1996b), SW UMa (Szkody et al. 1988), and Z Cam (Wheatley et al. 1996a). Other high- CVs generally do not show the soft component (e.g., Silber et al. 1994; van Teeseling et al. 1995). When a soft component is present the X-ray spectra show 5–30 eV; these temperatures are similar to the BL temperatures derived from high resolution EUV and X-ray spectra (Mauche et al. 1995: SS Cyg; Long et al. 1996: U Gem; Mauche 1996b: VW Hyi; Mauche & Raymond 2000: OY Car; see also Sect. 5). Note that not all of the soft component is optically thick (Mauche et al. 1995; Long et al. 1996). The soft X-ray fluxes increase by a factor of 100 from quiescence to outburst. However, they are still too low compared to the simple BL models (e.g., Mauche et al. 1991; van Teeseling et al. 1993; van Teeseling & Verbunt 1994; Ponman et al. 1995; Wheatley et al. 1996b), similar to the discrepancy seen in quiescence (see Sect. 3). A study of the ionization states inferred from the P Cygni lines arising in winds from high CVs led to a similar conclusion (Drew & Verbunt 1985; Hoare & Drew 1991). Various explanations for the discrepancy (or absence) of soft X-ray flux during outburst have been put forward: differences in to different systems (e.g., Patterson & Raymond 1985b; Long et al. 1996); differences in and the WD rotation (see below); absorption in the disk wind (Jensen 1984; Kallman & Jensen 1985); energy loss in the form of a wind (e.g., Silber et al. 1994; Ponman et al. 1995). Moreover, changes in the BL temperature can shift most of the flux out of the soft X-ray bandpass (e.g., Córdova et al. 1980a; Patterson & Raymond 1985b).
Our knowledge of the evolution of the spectral flux distribution during outbursts of DNe at various wavelengths is mainly based on fragmented (nearly) simultaneous observations. A few dedicated campaigns do exist, however (see, e.g., Pringle et al. 1987; Wheatley et al. 1996b; Szkody 1999, and references therein). One of the most complete coverages to date of a DN outburst, is that of SS Cyg (Mauche & Robinson 2001; Wheatley et al. 2000; see Fig. 1). We here describe the general behaviour seen at EUV and X-ray wavelengths.

The soft X-rays lag the optical outburst light curve by about 12–36 h during the rise (e.g., Jones & Watson 1992; Mauche & Robinson 2001). This is comparable to that measured in the far-UV (10 eV; Polidan & Holberg 1984). Wheatley et al. (2000) found that the X-ray outburst of SS Cyg started 18 h before the EUV one. The start of the X-ray outburst is marked by a sudden softening of the X-ray spectrum; the rise to soft X-ray maximum is rapid (e.g., Wheatley et al. 2000). After reaching maximum early in the outburst, it rapidly decreases again (but less fast than the rise). The decrease is more rapid towards shorter wavelengths. The soft X-rays lead the optical light curve during the decline, and disappear before the end of the optical outburst (e.g., van der Woerd et al. 1986; Mauche & Robinson 2001). The soft X-ray rise and decay times are shorter with respect to the optical (e.g., van der Woerd et al. 1986; Jones & Watson 1992).
The initial soft X-ray rise could be the arrival of the heating wave through the disk at the BL, and the sudden spectral softening is as expected in the BL models. The rapid rise time may represent the time scale of the transition between optically thin and thick emission; the less rapid drop at the end may represent the time scale of the inverse process (e.g., Jones & Watson 1992; Wheatley et al. 2000).
At the time the soft X-rays appear, the hard X-ray flux is suppressed (e.g., Wheatley et al. 2000; Baskill et al. 2001). They do not disappear, however. They stay present during the outburst, with somewhat lower temperature and flux than in quiescence. This may be attributed to a density gradient in the optically thick BL, such that there is always a hot optically thin layer which emits hard X-rays (e.g., Patterson & Raymond 1985a; Done & Osborne 1997). The anti-correlation between the soft and hard X-ray flux suggests that we see two physically distinct emission components. The coincidence in the timing show that they are related, however, and possibly mark the time at which the BL becomes optically thick. The hard X-ray flux during outburst is considerably smaller than the soft X-ray flux (e.g., 0.1% during a superoutburst of VW Hyi; van der Woerd et al. 1986) and it declines throughout the outburst (e.g. Verbunt et al. 1999). The temperature of the hard X-ray component increases from outburst to quiescence (e.g., Hartmann et al. 1999). The decline in flux and increase in temperature probably reflects the (slowly) decreasing on the WD (e.g., Jones & Watson 1992; Hartmann et al. 1999).
The hard X-ray flux recovers to quiescent levels just at the very end of the optical outburst (Wheatley et al. 1996b, 2000; see also Yoshida et al. 1992; van Teeseling & Verbunt 1994; Ponman et al. 1995). The recovery time scale is slightly longer than that of the optical decline (e.g., Jones & Watson 1992). The hard X-ray flux varies on a time scale of hundredths of seconds with an amplitude of 100% at the start of the recovery to 50% at the end of that observation, with the hardness ratio staying constant. As the end of the optical outburst is thought to correspond to the cooling of the disk region immediately surrounding the WD, this observation indicates that the hard X-rays originate from an area of the disk very close to the WD (e.g., Wheatley et al. 1996b; Verbunt 1996). Note that at the time of the hard X-ray recovery the EUV light curve of SS Cyg exhibited a secondary maximum, which emission is consistent with the soft tail of the hard X-ray emission (Mauche & Robinson 2001; Wheatley et al. 2000, 2002).
The situation is different for the outbursts of U Gem, where both soft and hard X-ray fluxes are higher during outburst than in quiescence (by a factor of 10–100). The largest increase occurs at EUV wavelengths. This corresponds to the expected increase in an optically thick BL radiating at temperatures near 10 eV at outburst (e.g., Szkody et al. 1999). While the optical flux stays constant near maximum, the EUV flux drops (Long et al. 1996). Assuming the EUV flux originates from near the WD, this suggests that in the innermost regions of the disk decreases compared to the outer regions (which presumably are still optically thick). During the outburst decline, both the soft and hard X-rays decrease faster than the optical flux (Mason et al. 1978; Swank et al. 1978; Córdova & Mason 1984; see also Szkody et al. 1999). Values derived for / are 0.5 during quiescence (Szkody et al. 1999), which is among the highest for DNe, and 1 during outburst (Long et al. 1996). So, in quiescence, as at outburst, U Gem comes closest to the standard BL model.
There are several reasons why may be larger in U Gem than in systems like VW Hyi (see Long et al. 1996, and references therein). Studies (Pringle 1977; Popham & Narayan 1995) have shown that, when is held fixed, the BL temperature and increase substantially with WD mass. On the other hand, rotation of the WD decreases both the amount of energy released and the effective temperature of the BL. The WD in U Gem is more massive (1.0–1.2 M⊙) than WDs in most DNe and VW Hyi in particular ( 0.6 M⊙). It appears to be at most slowly rotating (100 km s-1), while the WD in VW Hyi rotates with a 400 km s-1 (e.g., Sion et al. 2002), which corresponds to 20% of the break-up velocity.
In contrast to quiescence, there are no eclipses in the X-ray and EUV light curves of OY Car during outburst (Naylor et al. 1988; Pratt et al. 1999b; Mauche & Raymond 2000), as well as in the NL UX UMa (Wood et al. 1995b). This suggests that the prime X-ray source, probably the BL, is obscured at all orbital phases. From contemporaneous observations at other wavelengths (Naylor et al. 1987, 1988), extensive azimuthal structures on the outer disk had been inferred, which may block our view of the BL region. The observed dips in various other CVs (see Sect. 3 and below) are also explained this way. The X-rays we see are thought to be emitted or scattered by a more extended source (e.g., Verbunt 1996); e.g., due to a disk corona (Naylor et al. 1988) or scattering from a photo-ionised disk wind (Raymond & Mauche 1991; Mauche & Raymond 2000; see also Sect. 5).
Dips in the EUV and X-ray light curves during outburst have been seen in U Gem during a normal outburst (at 0.8; Long et al. 1996), as well as during an anomalously long (45 days) outburst (Mason et al. 1988). As in quiescence (Sect. 3), the dips only occur at low energies, indicating absorption effects. The morphology of the dips changes from cycle to cycle, related to changes in the absorbing material. The dips are deeper at shorter wavelengths, suggesting that the hot central area around the WD is being obscured by cooler material further out. During one dip observed by Mason et al. (1988) the X-ray source was completely extinguished in 15 s, putting the absorbing material near the outer edge of the disk.
5 X-ray spectral features
Most of the surveys done so far showed that single and sometimes two-temperature bremsstrahlung models were sufficient to describe the CV X-ray spectra (see Sect. 1), except for the occasional inclusion of a Gaussian to represent a line near 6.7 keV (see below). This is mainly due either to rather poor energy resolution and/or poor statistics. The use of more realistic models was generally not warranted. With the advent of better resolution, larger collecting area, better photon-counting devices, broader band passes, it became clear that the spectra are far more complicated. The X-ray spectra of DNe and NLs can probably be best decribed as somewhere between a pure bremsstrahlung model and a pure coronal model (e.g., van Teeseling & Verbunt 1994). Generally, X-ray spectra from non-magnetic CVs are due to hot thermal plasma in the BL, even at high (e.g., Mukai 2000). This is because the shock-heated plasma in the BL must cool from a temperature near 10 keV indicated by the X-ray spectra to the photospheric temperature of the WD (2.5 eV). The situation may be further complicated since X-rays from the hottest gas can photoionize cooler gas, altering both the energy balance and the ionization state at intermediate temperatures.
Many CVs, either in quiescence or in outburst, show an emission line near 6.7 keV from the K transition of highly ionised Fe, with EW0.8–1.0 (e.g., Szkody et al. 1990); it is associated with the hard X-ray emitting, optically thin plasma. Line emission near 7.9 keV has been reported just after an outburst of SS Cyg (Jones & Watson 1992) and OY Car (Ramsay et al. 2001b). This may be interpreted as thermal Fe-K emission, confirming the origin of line emission from a hot optically thin region. The presence of an absorption edge near 8.3 keV in the Ginga spectrum of SS Cyg implies substantial covering of the hard X-ray emission by the highly ionised gas (possibly a wind). Note that this is hard to reconcile with the picture in which the hard X-rays arise from a hot corona (Yoshida et al. 1992). SS Cyg also shows a reflection component both in quiescence and outburst (Done & Osborne 1997). Its contribution is larger in the softer X-ray spectra seen in outburst than in quiescence. This supports models in which the quiescent inner disk is not present or not optically thick, so that the only reflector is the WD surface rather than the WD plus disk. The amount of reflection in outburst is also more consistent with the hard X-rays forming a corona over the WD surface rather than just an equatorial belt as seen in quiescence. Note that a reflection component is absent in OY Car; this possibly is due to the high inclination, so that it may be obscured by the disk (Ramsay et al. 2001b).
Although ASCA showed complex structures in the X-ray spectra, the spectral resolution was still not high enough to resolve individual lines, especially in regions where a lot of lines are expected (e.g., Fe L complex around 1 keV). First EUVE, and now Chandra and XMM-Newton provide the opportunity to perform detailed temperature diagnostics from individually resolved lines and line ratios. Line ratios can be used to constrain the electron density, electron temperature, and ionization balance (see, e.g., Mauche et al. 2001; Szkody et al. 2002a, and references therein). They also provide enough velocity resolution to begin to study the effects of velocity broadening, which gives important clues to whether the emitting region is located in a rapidly rotating BL or is close to the more slowly rotating WD.
High resolution X-ray spectra of U Gem in quiescence (Szkody et al. 2002a) revealed prominent narrow emission lines of O, Ne, Mg, Si, S, and Fe. The line fluxes, ratios, and widths indicate that the X-ray emission lines arise from a range of temperatures in a high density (1014 cm-3) gas, moving at low (300 km s-1) velocity, with a small (107 cm) scale height compared to the WD radius. This is consistent with a BL, as was also inferred from the eclipse light curves (see Sect. 3).

The EUV/soft X-ray spectra of U Gem in outburst (0.6–0.8, Long et al. 1996), and OY Car (Mauche & Raymond 2000) and WZ Sge (Kuulkers et al. 2002; Fig. 2) in superoutburst resemble each other markedly, and are unlike that seen in other DNe, which is attributed to their high inclination. Below 0.2 keV (65Å) they show a ‘forest’ of broad (FWHM800–1200 km s-1) emission lines of intermediate ionization stages of N, O, Ne, Mg and Fe, on top of a continuum (which is weak in OY Car and WZ Sge, and appears to be line-free in U Gem). The phase resolved spectra of U Gem show that the eclipses affect the continuum more strongly than the lines, implying that the lines are produced in a region of larger extent than that of the continuum, which is presumably formed in the BL. The line identifications alone significantly constrain the physical nature of the emitting plasma. Because all of the above strong lines are resonance lines, good spectral fits are obtained with a model wherein the radiation from the BL and disk is scattered into the line of sight by the system’s photo-ionised disk wind (Mauche & Raymond 2000). Note that the absence of X-ray eclipses in OY Car during superoutburst (Naylor et al. 1988) can be understood if much of the X-ray emission we see is light scattered in such an extended wind.
The EUV lines arise from the dominant ionization states of the wind, and their strengths suggest that the wind mass-loss rate in U Gem is a substantial fraction of the WD accretion rate (Long et al. 1996). The lines are effectively the emission peaks of P Cygni profiles. This requires the scattering region to be of order 1010 cm, similar to the size of the region inferred from studies of the UV P Cygni lines in other DNe and NLs. These P Cygni profiles have been shown to arise in strong winds with terminal velocities of order 3000 km s-1 (e.g., Drew & Verbunt 1985; Mauche & Raymond 1987; Woods et al. 1990).
WZ Sge’s spectrum at higher energies, 0.2 keV (65Å), shows weaker lines of highly ionised ions, with O VIII (0.66 keV; 18.9Å) standing out. A strong emission line was also seen near 2.4 keV, probably associated with He-like S XV, which cannot be accounted for using an optically thin thermal plasma model (Kuulkers et al. 2002).
Because of the recent access to high quality X-ray spectra, ‘new’ interpretations are also emerging. This is demonstrated by, e.g., Mukai et al. (2003), who show that the Chandra data of the DNe SS Cyg and U Gem and the old nova V603 Aql are well described by a simple cooling-flow model. This in contrast to three IPs which are better described by a photo-ionization model.
6 VY Scl stars
During optical high states NLs generally have similar X-ray spectral characteristics, with temperatures between 0.25–0.5 keV and 1031–1032 erg s-1. Since VY Scl stars are thought to have a high during the high state their X-ray spectra should be rather similar to DNe in outburst. However, this seems not to be the case. Distinct differences at other wavelengths exist as well; see Greiner (1999) for an extensive comparison between VY Scl stars and DNe in outburst.
A very soft component (19 eV) was found in V751 Cyg during an optical low state, at which time the bolometric X-ray luminosity was around 20 times higher (51036 erg s-1) than in the high state (Greiner et al. 1999; but see Patterson et al. 2001). V Sge showed a similar behaviour: it is a faint hard X-ray source during optical bright states, while during optical low states it shows X-ray luminosities similar to V751 Cyg (Greiner & van Teeseling 1998). is clearly higher than generally observed from CVs (see Sect. 1), and compatible with the lower end of the luminosity distribution of supersoft sources (SSS; see Chapter 11). It was therefore suggested that VY Scl stars in their low states may have a link with SSS (Greiner et al. 1999). Not all VY Scl stars in their low state show high values of , however. Examples are KR Aur with 1031 erg s-1 (Eracleous et al. 1991a; Schlegel & Singh 1995) and MV Lyr with 51029 erg s-1 (Greiner 1999) during a low state.
The X-ray spectra during a high (KR Aur) and intermediate (TT Ari) optical state were shown, however, to be poorly described by black-body radiation; a thermal plasma model described the data better. It was concluded, therefore, that the X-ray spectra of VY Scl stars should be interpreted using the latter model, both in the high and low state (Mauche & Mukai 2002). This may have an impact on the suggested SSS connection (see also Patterson et al. 2001).
7 AM CVn stars
The luminosities of the few AM CVn stars that have been detected in X-rays range from 1028–51030 erg s-1 (Ulla 1995, and references therein; but see Verbunt et al. 1997). The maximum of the overall flux distribution in AM CVn itself peaks around EUV wavelengths; there is no detectable hard X-ray emission (Ulla 1995). The X-ray luminosities of AM CVn stars agree with the coronal luminosities for single stars (e.g., Rosner et al. 1985; Hempelmann et al. 1995), and possibly with emission from single DB WDs (e.g., Fontaine et al. 1982).
Of the few exceptions to the / versus relation (Sect. 1), is AM CVn. With 0.29 h it has an unexpectedly small ratio of 0.002. This small ratio might be explained by a high , comparable to UX UMa stars (van Teeseling et al. 1996). On the other hand, the AM CVn system GP Com has a ratio near unity (van Teeseling & Verbunt 1994). This may be due to the fact that the entire disk in GP Com is in a (low) steady state, in which it will always be optically thin, and will not undergo outbursts similar to that seen in DNe (Marsh 1999).
V407 Vul, a CV related to the AM CVn stars, was recently suggested to be a new type of double-degenerate CV (Marsh & Steeghs 2002). In this CV the mass transfer stream may hit a non-magnetic WD directly due to a very compact orbit of 9.5 min. This results in pulsations in the X-ray flux every 9.5 min, with no X-ray emission in between pulses (suggestive for it being a polar [see Sect. 3], however, neither polarization nor line emission is seen). Its X-ray spectrum is soft (40–55 eV; Motch et al. 1996; Wu et al. 2002). This is explained by the stream breaking into dense blobs which are able to penetrate the photosphere of the WD and therefore become thermalised, giving rise to the soft X-ray emission (Marsh & Steeghs 2002).
3 X-ray emission from polars
1 Introduction
In polars, the originally free-falling matter couples to magnetic field lines somewhere between the two stars and is guided to one or two accretion regions in the vicinity of the magnetic poles. These are the sources of intensive X-ray radiation, mainly in the soft X-ray regime, and of cyclotron radiation from IR to UV wavelengths. The observation of pulsed polarised radiation from the cyclotron source led to their nick-names as polars (Krzemiński & Serkowski 1977).
There is no recent review of the X-ray properties of polars in broad generality; the main satellite-related aspects were reviewed (ROSAT: Beuermann & Thomas 1993; Beuermann & Burwitz 1995; EUVE: Sirk & Howell 1998; Mauche 1999; ASCA: Mukai 1995). Emission from post-shock flows in magnetic CVs is described by Cropper (1990).
Just two polars were known as variable stars before the era of X-ray astronomy began (AM Her, VV Pup) and a very few were detected in optical spectroscopic surveys before 1999 (AN UMa, CE Gru, MR Ser = PG1550+191). To date about 70 polars are known, the vast majority of them identified as counterparts of serendipitous X-ray sources. Only recently, much deeper optical spectroscopic surveys (Hamburg Schmidt telescope, SDSS) have uncovered new systems in apparently permanent low states of accretion (Reimers & Hagen 1999; Reimers et al. 2000; Szkody et al. 2002b). They were not or just marginally detected in X-rays, and, due to their low accretion rates, display intriguing cyclotron spectra.
Polars are in the first place emitters of soft X-rays. Therefore, the all-sky surveys conducted with ROSAT (XRT and WFC) in combination with optical identification programmes permitted for the first time a synoptic view of the CV sky with high sensitivity. Most polars are found below the 2–3 h CV period gap. The gap itself is significantly filled in, possibly due to reduced braking by trapping of the wind from the donor within the magnetosphere of the WD (Webbink & Wickramasinghe 2002). The space density is of the order of 1–210-6 pc-3 of short-period systems and a factor of 10 lower for long-period systems (Beuermann & Schwope 1994).
As shown in Fig. 3, polars emit from the IR to the hard X-ray regime. Most of the radiation is accretion-induced. A complete picture therefore requires multi-wavelength observations, preferably obtained contemporaneously because of the inherent high variability on many time scales (from seconds to years). X-ray observations are essential in order to determine the accretion scenarios (which requires a deconvolution of the X-ray spectra), the accretion geometries (which requires a deconvolution of the X-ray light curves), and the accretion history (which requires long-term monitoring in the X-ray domain).


2 Accretion-induced emission
Matter in the accretion stream is accreted almost vertically on to the magnetic poles of the WD. The accretion process is, therefore, almost always modeled in a one-dimensional quasi-radially symmetric approximation. The presence of, e.g., accretion arcs with corresponding variety of accretion rates and deviations from the radial symmetry due to inclined magnetic field lines is evident from observations but neglected in the modeling for tractability.
Accretion is governed by three parameters, , the accretion rate per unit area, , and . The balance between those parameters determines, whether the acretion region is heated via a strong hydrodynamic stand-off shock or by particle bombardment, and whether the cooling function is dominated by plasma emission or by cyclotron radiation.
With appropriate boundary conditions, the equations of conservation of mass, momentum and energy can be used to calculate the temperature and density as a function of height, as well as the emerging spectra. Only the one-dimensional non-magnetic case could be solved analytically (Aizu 1973). Present numerical models include cooling by cyclotron emission by solving the fully frequency and angle-dependent radiative transfer and treat the accretion plasma in a 2-fluid approximation (Fischer & Beuermann 2001; see Fig. 3); they include gravity, account for its variation within the flow and use up-to-date plasma emission codes (Cropper et al. 1998). They take into account pre-shock heating and ionization, which influences the size of the shock jump and the formation of the emerging spectra. However, current models are still one-dimensional and stationary, which limits their direct applicability to observational data.
Multi-temperature plasma emission models were fitted to the hard X-ray spectra of polars with the aim (among others) to estimate . A Compton reflection component from the irradiated WD surface, complex absorption (partial covering cold or warm absorbers) in the pre-shock flow or surrounding matter, fluorescent K emission and cold interstellar absorption were taken into account (e.g., Done & Magdziarz 1998; Matt et al. 2000). Such models give satisfactory fits to the data but tend to predict too high values of compared with dynamical mass estimates or parallaxes (Cropper et al. 2000). Van Teeseling et al. (1999) question the validity of coronal models for the post-shock emission. High accretion-rate systems may be very optically thick in the resonance lines, the corresponding asymmetric line emission may serve as a diagnostic tool to probe the very inner accretion geometry. X-ray line spectroscopy was used to infer sub-solar abundances of the accreted matter (Done & Magdziarz 1998; Ishida & Ezuka 1999), in unresolved contrast to UV-line spectroscopy (Bonnet-Bidaud & Mouchet 1987).
In the ‘standard accretion model’ (King & Lasota 1979; Lamb & Masters 1979) about half of the X-rays and of the cyclotron radiation are intercepted by the WD surface and are reprocessed as soft X-rays. This simple model predicts about equal luminosities in the bremsstrahlung and cyclotron components on the one hand and the soft emission on the other. Details of this balance depend on the hard X-ray albedo, the irradiation geometry and, observationally, on the viewing geometry. However, since the early days (EXOSAT and Einstein era), a moderate to strong soft X-ray excess over the other components was observed, creating what was referred to as the ‘soft X-ray puzzle’. The size of the soft excess was difficult to assess exactly but X-ray flux ratios up to 100 were reported. Difficulties to quantify the soft excess often arise from non-simultaneous observations in the soft and hard spectral bands and from incomplete spectral coverage of the soft component. At temperatures 15–30 eV it has its peak emission in the EUV where most instruments have low sensitivity and interstellar absorption is severe. Apart from a few exceptions which indicate the presence of Ne VI absorption edges or Ne VII and Ne VIII absorption lines, the soft spectra can be well described with a simple black body (Mauche 1999). The application of more physical models, e.g., pure-H or solar abundance stellar atmospheres, does not improve the fits due to the incompleteness of the models and the low signal-to-noise of the data.
Two ways were proposed to cure the soft X-ray problem (Kuijpers & Pringle 1982). The first invokes shredding of the stream into diamagnetic blobs in the magnetospheric interaction region. Subsequent confinement and compression of the blobs leads to highly inhomogeneous accretion of filaments with partly or wholly buried shocks (Frank et al. 1988). The primary hard radiation cannot escape freely and the photosphere will be heated from below. Apart from hydrostatic computations of the temperature structure of a one-blob impact (Litchfield & King 1990), this model is not worked out in quantitative detail.
An alternative scenario applies to the low and high case. In such an environment cyclotron cooling becomes so efficient that it cools the plasma over a mean free path of the infalling particles, i.e., the shock is resolved and bremsstrahlung is suppressed (bombardment solution, Woelk & Beuermann 1996). ROSAT observations of a large number of polars showed a clear relation between the size of the soft excess and the magnetic field strength in the accretion region (Beuermann & Schwope 1994; Ramsay et al. 1994)777Meanwhile, the field strength of about 45 systems have been measured. Some measurements are based on Zeeman-split Balmer-lines from the photosphere or from an accretion halo (Schwope 1996), but most of these measurements are based on the identification of cyclotron harmonic emission lines in low-resolution optical and/or IR spectra, originating from the accretion plasma at one or two accretion regions (for a review see Wickramasinghe & Ferrario 2000).. This correlation was explained either by enhanced fragmentation of the stream in the magnetosphere, i.e., by enhanced blobby accretion, or by enhanced cyclotron cooling, thus supporting either of the two alternatives to the ‘standard’ model. The decomposition of light curves in eclipsing systems (e.g., Bailey 1995) and the analysis of soft-to-hard X-ray cross-correlation functions (e.g., Beuermann et al. 1991) suggest that regions with low and high co-exist. Consequently, the accretion region cannot be described in terms of just one of the scenarios. Further modification to the ‘standard’ model arises from the fact, that in AM Her the reprocessed component is observed with the right energy content and is observed in the UV instead of the soft X-ray regime, suggesting that the soft X-rays are completely decoupled from the other radiation processes (Gänsicke et al. 1995). Similar multi-band investigations which include particularly the UV spectral regime are missing for other polars.
3 X-ray light curves
Polars display a rich phenomenology of X-ray light curves despite their rather simple accretion geometry. The light curves offer large diagnostic potential, since they are modulated by the location and the three-dimensional extent of one or several accretion spots, by stellar eclipses (11 out of 70 systems display stellar eclipses), by nonstationary accretion processes, and by absorption of X-rays within the binary. The long-term light curves are affected by shifts of the accretion regions in longitudinal and/or lateral directions, by changes between one- and two-pole accretion modes (which gives those systems a completely different appearance) and by large-scale variations of . These long-time dependencies occur at unpredictable moments and for unpredictable duration. It is a common assumption that long-term changes of the accretion rate are related to star spots on the donor at the (King & Cannizzo 1998) and an attempt has been made to reconstruct a possible pattern of star spots from the accretion history of AM Her (Hessman et al. 2000). While irradiation-induced structure is obvious in Doppler tomograms of the donors, these experiments have failed so far to make star spots visible (Schwope 2001).
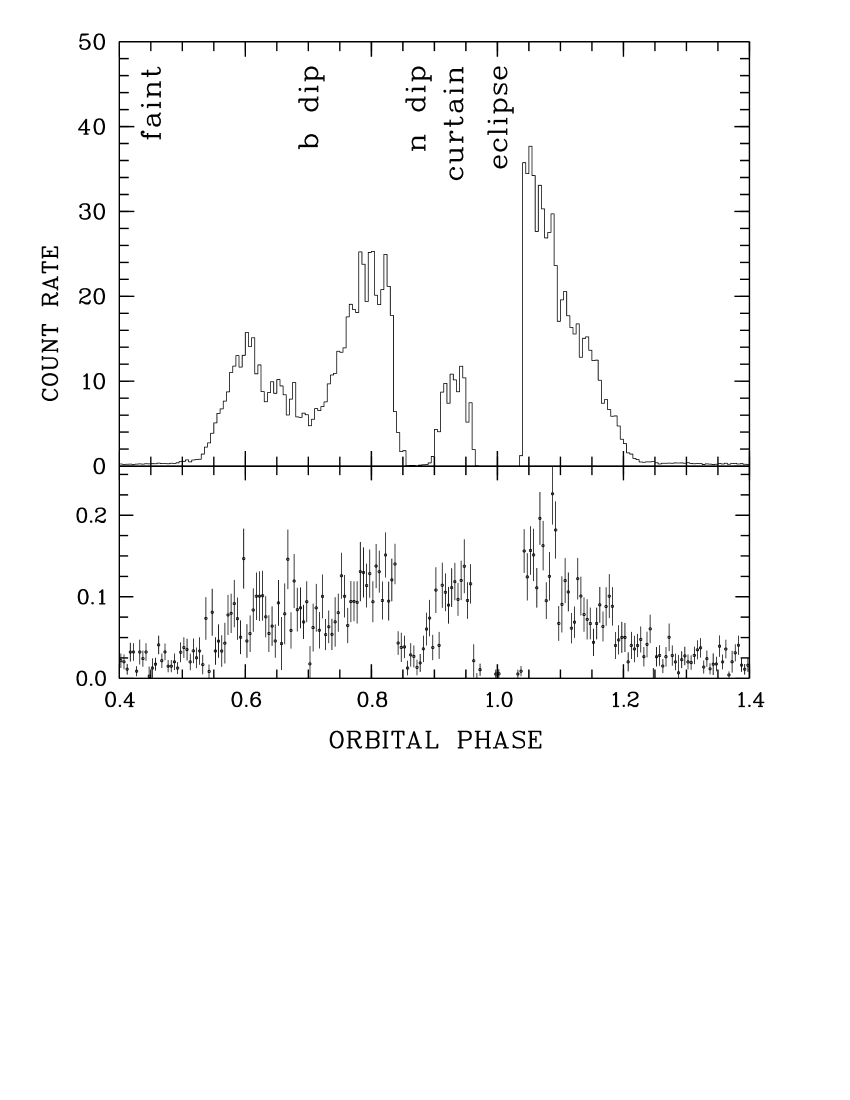
The main features of the X-ray light curve of a polar in a one-pole accretion geometry are exemplified in Fig. 4, the ROSAT light curve of HU Aqr (Schwope et al. 2001). While interpreting these light curves one should bear in mind that the spin of the WD is synchronously locked with , typically to a degree better than . The light curve displays several pronounced features, labeled as broad dip (‘b dip’), narrow dip (‘n dip’) and eclipse. The light curve also shows a pronounced on-off pattern due to self-occultation of the accretion region behind the WD. In the faint phase some residual X-ray emission is present, which is probably of scattering origin. The length and phasing of the bright phase allows clues to be drawn on the latitude and longitude of the accretion spot. Most polars have the main accretion spot in the quadrant of the ballistic stream (seen by a hypothetical observer on the WD), i.e., on the leading side of the WD. However, a few systems have their spots on the trailing side of the WD or even on the opposite from the donor. This implies complex motions of matter in the magnetosphere and it is by no means clear to what extent the simple picture of accretion via Roche-lobe overflow at is applicable. Recent Doppler tomograms show that even the putative ballistic, freely falling stream in the vicinity of the might be influenced by the magnetic fields in the binary (Schwarz et al. 2002). The spots do not show any preferred latitude, i.e., the spin axis of the WD seems not to be aligned with the rotation axis.
While the hard X-rays are assumed to be formed by (mainly) optically thin plasma radiation the X-ray brightness should be constant throughout the bright phase. Instead, large fluctuations are seen which are assigned to nonstationary accretion and occultations. The soft X-rays originate from optically thick surfaces and orbital modulations are expected (and observed) to be more marked. The bright phase in general is far from being compatible with a flat accretion spot and heating by accretion blobs rather than irradiation plays an important role. The depth-dependent temperature structure in the vicinity of an accretion filament was computed by Litchfield & King (1990) using similarity to a heat conduction problem. The photosphere is then assumed to be shaped like a mound, but its height proved not to be sufficient to reproduce soft X-ray light curves of, e.g., the anomalous state of AM Her (Heise et al. 1985), suggesting that hydrodynamic splashes rather than a hydrostatic atmosphere are more likely responsible for the soft X-ray light curves.
The bright phase may undergo shifts with respect to binary phase zero. In some cases this reflects the accretion rate dependent penetration of the magnetosphere by the ballistic stream before it gets threaded onto magnetic field lines. In other cases it indicates a small asynchronism of and (Schwope et al. 2001, 2002).
There are 11 eclipsing systems; two of them, UZ For and HU Aqr, were found bright enough to resolve the ingress into or the egress from the eclipse in soft X-rays. Detailed modeling shows, that the soft X-ray accretion spots have an angular lateral extent of less than (Warren et al. 1995; Schwope et al. 2001) and a vertical extent of less than 0.05 RWD. Hence the soft X-ray accretion region is pillbox-shaped rather than pencil-shaped.
The narrow dip is due to absorption in the transient accretion stream, which becomes X-rayed when it has just left the orbital plane. It can be observed in systems in which the orbital inclination exceeds the co-latitude of the accretion spot. Its phase indicates the azimuth and its width the size of the threading region in the magnetosphere. To a first order, the coupling region is located where the magnetic pressure overcomes the ram pressure of the ballistic stream. A simultaneous hard X-ray and near-IR study of the dips in EF Eri (Watson et al. 1989) demonstrates the presence of substantial structure in the dips, implying significant density fluctuations in the stream, either spatial or temporal. The origin of the broad dip centred at an earlier phase remains unclear so far. Its width and X-ray colour suggest an origin in warm absorbing matter in close vicinity to the hot accretion spot. Its diagnostic potential needs to be explored.
4 X-ray emission from intermediate polars
1 Introduction
The first of the asynchronous magnetic CVs to be discovered was the remnant of Nova Herculis 1934 – DQ Her – in 1954. Walker (1956) found a highly stable 71.1 s optical modulation with amplitude of a few hundredths of a magnitude, which disappeared during eclipse. In analogy with the models for X-ray pulsars (Pringle & Rees 1972; see Chapter 7) an accreting oblique dipole rotator was eventually suggested (Bath et al. 1974a). The correctness of this model was demonstrated by the discovery of a phase shift in the 71 s signal during eclipse that could be matched to the eclipse of a beam of high energy radiation, emitted by the rotating WD, as it swept over the accretion disk and was reprocessed into optical wavelengths (Warner et al. 1972; Patterson et al. 1978).
The evident success of this accreting magnetic model led to its adoption when the first X-ray CVs to have two simultaneous periodic modulations were found. For example, AO Psc was observed to have a strong 14.3 min optical periodicity (Warner 1980; Patterson & Price 1980) but a 13.4 min modulation in hard X-rays (White & Marshall 1980). The realisation that the frequency difference of these two modulations is equal to the orbital frequency showed that the X-ray period arises from rotation of the WD, but the optical modulation must be caused by the rotating beam being reprocessed from some structure fixed in the rotating frame of the binary (e.g., the donor or the thickening of the disk where the stream impacts). It was therefore recognised that only two ‘clocks’ are really present, i.e., and the spin period of the WD, .
Because of amplitude modulation, caused largely by geometrical projection effects, a suite of modulations is sometimes seen in optical observations. Denoting =2 and =2, the frequencies , 2, + and are predicted to occur (Warner 1986). The importance of these sidebands is that they act as proxies for X-rays in those cases where no X-ray modulation has been observed; there are no models other than IPs that explain the presence of orbital sidebands.
Direct observation of an X-ray modulation, usually denoting , accompanied by , usually obtained from optical photometric or spectroscopic observations, is required to give full conviction to classification as an IP. But an optical periodicity of proven stability (to distinguish from the quasi-periodic oscillations discussed in Sect. 5), and the presence of one or more orbital sidebands, even without any X-ray detection at all, give an irresistible urge for inclusion in the IP lists. The parameter space occupied by the IPs is illustrated in Fig. 5.
2 Modes of accretion
Most IPs are expected to accrete via some form of truncated accretion disk whose inner edge is at the magnetospheric radius. From here, material will attach onto field lines and flow towards the magnetic poles, forming ‘accretion curtains’ above each pole (Rosen et al. 1988). Unlike the polars, the accretion flow impacting the WD in IPs will therefore be more extended, occurring over a greater fraction of the WD surface. At some point in the flow, the material will experience a strong shock before settling and cooling mainly by thermal bremsstrahlung. This region is thus the origin of the observed X-ray emission. Modulation at the WD spin period is produced by a combination of self occultation and varying photo-electric absorption towards the X-ray emission sites.
Some IPs are also believed to accrete (at least in part) directly via a stream, in a similar manner to polars. This stream may overflow a disk (disk-overflow accretion; e.g., Hellier et al. 1989; King & Lasota 1991; Armitage & Livio 1996) or replace a disk entirely (stream-fed accretion; Hameury et al. 1986). As the stream flips from pole to pole, this will naturally give rise to an X-ray modulation at the sideband frequency (Hellier 1991; Wynn & King 1992; Norton 1993). In disk-fed accretion it is likely that the footprints of the field lines onto which the flow attaches are semi-circular X-ray emitting arcs around each magnetic pole, and are fixed on the surface of the WD. By contrast, the field lines to which the stream-fed or disk-overflow accretion attaches are likely to have smaller footprints at each magnetic pole and these will ‘migrate’ around the pole to follow the incoming stream, as a function of the sideband phase (Norton et al. 1997).
3 X-ray lightcurves
In early X-ray observations, the light curves of IPs folded at the WD spin period were seen to be roughly sinusoidal and interpreted as largely due to self occultation of the emission area by the WD (King & Shaviv 1984). First hints that this was not the case came with EXOSAT observations (Mason 1985; Watson 1986; Norton & Watson 1989) which showed that the modulation depth tended to increase with increasing X-ray energy over the range 1–10 keV, indicating that photo-electric absorption made some contribution to the observed modulation.
The now widely accepted ‘accretion curtain’ model was proposed to explain the data from EX Hya (Rosen et al. 1988, 1991). In this model, the emission region is a tall, thin, arc-shaped curtain and the largest X-ray flux is seen when the curtains are viewed from the side (i.e., when a given pole is pointing away from the observer). Although EX Hya is an atypical IP, such a model was also successfully applied to the other IPs (e.g., Hellier et al. 1991).
Ginga, ROSAT, ASCA and RXTE each observed many IPs, producing lightcurves with extremely high signal-to-noise in many cases. Whilst the pulse profiles of some sources (e.g., EX Hya; Rosen et al. 1991) still appear roughly sinusoidal, there are indications that additional structure may be present in others. For example, the combined ROSAT and Ginga pulse profiles of AO Psc and V1223 Sgr show evidence for a small notch superimposed on the peak of the pulse (Taylor et al. 1997). Several objects, including GK Per (Ishida et al. 1992), XY Ari (Kamata & Koyama 1993), V405 Aur (Allan et al. 1996), YY Dra and V709 Cas (Norton et al. 1999) show pulse profiles that are double peaked (at least on some occasions they are observed). Some of the most complex pulse profiles are those seen from FO Aqr (Norton et al. 1992a; see Fig. 6), BG CMi (Norton et al. 1992b) and PQ Gem (Duck et al. 1994) which show narrow notches superimposed on broader modulations and pulse profiles that change significantly with . Many of these X-ray pulse profiles also vary dramatically on time scales of months or years. For instance, those of GK Per and XY Ari are single peaked in outburst (Watson et al. 1985; Hellier et al. 1997) but double peaked in quiescence; in other cases, such as V709 Cas, the contributions of various harmonics of the spin frequency are seen to vary (de Martino et al. 2001).
It has been noted (e.g., Norton et al. 1999) that the IPs exhibiting double-peaked X-ray pulse profiles are mostly those with short . The WDs in these objects therefore probably have weak magnetic fields, so the magnetospheric radius is relatively small. Consequently the footprints of the disk-fed accretion curtains on the WD surface are relatively large. In contrast to a conventional accretion curtain, the optical depths to X-ray emission are therefore lowest in the direction along the magnetic field lines, and highest in the direction parallel to the WD surface, such that the emission from the two poles conspires to produce double-peaked X-ray pulse profiles (Allan et al. 1996; Hellier 1996; Norton et al. 1999). Such a pulse profile is therefore not a unique indicator of two-pole accretion. Indeed, two-pole accretion onto smaller regions of the WD surface may be considered the ‘normal’ mode of behaviour in a disk-fed IP with a longer (and therefore a higher field strength), resulting in a single-peaked pulse profile. Indications of the size of the X-ray emitting region in IPs have come from a study of the deeply eclipsing IP XY Ari. The 2 s egress from eclipse seen in RXTE data limits the accretion region to 0.002 of the WD surface area (Hellier 1997).
Whereas fast rotators with relatively weak fields show double-peaked pulse profiles, several slower rotators with larger fields (and therefore larger magnetospheres) have been seen to exhibit an X-ray sideband modulation (i.e., at a frequency ) at some time. A strong sideband signal is seen in TX Col (Buckley & Tuohy 1989), and FO Aqr (Norton et al. 1992a), and weaker signals in AO Psc and V1223 Sgr (Hellier 1992). A dominant sideband period may exist in BG CMi (Norton et al. 1992b). Observations of V2400 Oph subsequently confirmed this system as the first truly diskless IP by revealing that its X-ray signal varies only at the 1003 s sideband period (Buckley et al. 1997; Hellier & Beardmore 2002).
The relative strengths of the X-ray sideband and spin modulation in FO Aqr have been seen to vary on time scales of years (Beardmore et al. 1998) and those in TX Col on time scales as short as months (Norton et al. 1997). The interpretation is that the relative amounts of accretion occurring via a stream and via a disk vary, possibly due to changes in or other activity on the donor near to the point.
IPs sometimes show strong orbital modulations in their X-ray light curves. The compilation by Hellier et al. (1993) showed that FO Aqr, EX Hya, BG CMi and AO Psc all have orbital dips characterised by increased photo-electric absorption around 0.8. Such orbital modulations have been confirmed by subsequent observations (e.g., Norton et al. 1992a,b; Taylor et al. 1997; Allan et al. 1998). Hellier et al. (1993) concluded that the cause was likely to be similar to that in DNe and LMXBs and due to material thrown out of the orbital plane by the stream impact with the disk or the magnetosphere (see Sect. 3). Alternatively, or additionally, a spin pulse profile that varies with (such as will arise naturally in a stream-fed or disk-overflow model) will naturally give rise to an orbital modulation. It is likely that this effect contributes to the observed orbital modulation, at least in some systems.
4 X-ray spectra
The relatively low signal-to-noise and low resolution X-ray spectra of IPs obtained with EXOSAT were adequately fitted with single temperature (10’s of keV) bremsstrahlung continua passing through a partial absorber which varied with phase (see the compilation by Norton & Watson 1989). Fluorescent Fe K lines were also seen in most IPs (Norton et al. 1991). Ginga observations largely confirmed these results but showed that both thermal and fluorescent contributions to the Fe lines were present (Ishida 1991). The higher spectral resolution of ASCA allowed more emission lines to be detected in the X-ray spectra of EX Hya (Ishida & Fujimoto 1995) and AO Psc (Fujimoto & Ishida 1995; Hellier et al. 1996), for example, and also showed that V405 Aur, PQ Gem, AO Psc, BG CMi, V2400 Oph, TV Col and V1025 Cen have thermal Fe K lines that are broadened by 200 eV (Hellier et al. 1998). In each case, up to three Gaussian lines were required, corresponding to cold, H-like and He-like Fe.
A significant advance in the modelling of IP X-ray spectra came with models that used a multi-temperature emission region, including effects such as reflection from the surface of the WD and partially ionised absorbers (e.g., Cropper et al. 1998; Beardmore et al. 2000). Using this technique, Cropper et al. (1998) fitted the Ginga spectra of 9 IPs and determined WD masses for them.
ROSAT discovered a sub-class of IPs, e.g., V405 Aur, PQ Gem and UU Col, characterised by soft X-ray spectra, with black-body components at of 10’s of eV (Mason et al. 1992; Haberl et al. 1994; Haberl & Motch 1995; Burwitz et al. 1996). The soft X-rays from these objects probably originate, as in polars, from the heated WD surface around the accreting poles. The black-body fluxes indicate fractional areas of only 10-5 of the WD surface for the soft X-ray emission region (Haberl & Motch 1995).
At the time of writing, Chandra and XMM-Newton spectra of IPs are just becoming available and will probably revolutionize our understanding of IP X-ray spectra. For example, Mauche (2002b) shows that line ratios from the Chandra spectrum of EX Hya may be used to determine a plasma temperature which spans the range 0.5 to 10 keV and a plasma density 21014 cm-3. Mukai et al. (2003) demonstrate that EX Hya’s Chandra spectrum is well fit by a simple cooling-flow model, as are those of the DNe U Gem and SS Cyg, and the old nova V603 Aql. In contrast, the Chandra spectra of the IPs V1223 Sgr, AO Psc and GK Per are inconsistent with such a model, but conform with the expectations for line emission from a photo-ionised plasma.
5 Rapid oscillations
1 Dwarf nova oscillations
Introduction
The rapid oscillations seen in DQ Her (see Sect. 1) and AE Aqr are of very high stability (=/1012). In contrast, optical oscillations of low stability (104-6) were discovered in some high CVs (namely, DNe in outburst and NLs) by Warner & Robinson (1972). These are known as dwarf nova oscillations (DNOs) and are usually of very low amplitude (typically less than 0.01 mag) and span the range 5–100 s, with a concentration near 25 s. In a given CV they always appear at similar periods. Their short periods indicate a source near to the WD, and there was early expectation that they would be found at short wavelengths. They were indeed later found in the soft X-ray, EUV and UV regions. Only recently, however, have simultaneous EUV and optical observations of DNOs shown that, again as expected, the same phenomenon is being observed in all wavelength regions (Mauche & Robinson 2001) – but frequently the optical modulated flux is merely reprocessed X-ray and EUV radiation.
Before discussing observations of X-ray DNOs we describe a physical model that is gaining acceptance as an explanation of the DNOs. In its essence it is an IP model, but the magnetic field lines are connected to the accreted material near the equator of the WD, and not rooted in its interior. Paczyński (1978) pointed out that if the intrinsic field of the WD is low enough (105 G: Katz 1975) the accreted material will be able to circulate around the equator of the WD. (The high of DQ Her shows that in that CV the field is strong enough to lock the exterior layers to the interior, so the accretion torque is applied to the entire WD.) The shear in the accreting equatorial belt may generate a field strong enough to control the gas flow near the surface of the WD – but of the belt is determined by magnetic coupling to the inner edge of the disk. As waxes and wanes during a DN outburst the inner radius (and Keplerian period) of the disk is first reduced and then increased. The result is a low inertia magnetic accretor (Warner & Woudt 2002), which explains the large range of a DNO period during a DN outburst, and why it is observed to reach a minimum value at the maximum of . There is direct spectroscopic evidence for rapidly spinning equatorial belts in DNe during outburst (e.g., Sion et al. 1996).
Soft X-ray DNOs
Our knowledge of the oscillations in soft X-rays (0.1–0.5 keV) during outbursts of DNe is dominated by observations made of SS Cyg, U Gem and VW Hyi; all relatively nearby and optically bright objects. The first detections were in SS Cyg (Córdova et al. 1980b, 1984), U Gem (Córdova et al. 1984) and VW Hyi (van der Woerd et al. 1987). Modulated soft X-ray emission appears in all of the observed SS Cyg outbursts, but in only one of three observed U Gem outbursts. The hard X-ray emission in SS Cyg is not modulated (Swank 1979). The soft X-ray modulation amplitudes are much greater than in the optical; generally 25%, but as much as 100% for individual cycles. This shows that much of the accretion luminosity is involved in the modulation process. Other DNOs have been detected, i.e., in the DN HT Cas and the NLs YZ Cnc, RW Sex and AB Dra (Córdova and Mason 1984), but the last three are more probably of the quasi-periodic type discussed in Sect. 2. Table 1 lists the published studies of the three bright DNe.
| Star | (h) | Period (s) | References |
| SS Cyg | 6.60 | 9 | Córdova et al. (1980b) |
| 10.7 | Córdova et al. (1984) | ||
| 9.6–10.1 | Watson et al. (1985) | ||
| 7.4–10.4 | Jones & Watson (1992) | ||
| 7.2–9.3 | Mauche (1996a) | ||
| 2.8∗ | van Teeseling (1997b) | ||
| 2.9–8.2 | Mauche & Robinson (2001) | ||
| 9.1 | Mauche (2002a) | ||
| U Gem | 4.25 | 25–29 | Córdova et al. (1984) |
| 25 | Long et al. (1996) | ||
| VW Hyi | 1.78 | 14.06–14.4 | van der Woerd et al. (1987) |
| ∗A frequency doubling had occurred. | |||
The SS Cyg observations by Córdova et al. (1980b, 1984) provided the first means of analysing the short-term temporal variations of the DNOs; in the X-ray region individual cycles can be seen, whereas in optical observations the DNOs are only seen in Fourier transforms (FTs). However, later observations of rare large amplitude optical DNOs, especially those in the DN TY PsA (Warner et al. 1989), showed behaviour similar to that in X-rays, namely that the DNOs maintain relatively high coherence for a time and then jump suddenly (100 s) to a period typically 0.02 s different. These jumps in period can be in either direction and are superimposed on the steady increase or decrease in period associated with, respectively, decreasing or increasing luminosity. When the luminosity is not changing rapidly, i.e., in NLs or in DNe near maximum light, can be in excess of an hour; but late in an outburst decreases to hundreds of seconds and the DNOs become incoherent and difficult or impossible to detect with FT techniques.
In the past five years considerable progress has been made in two areas: the observation of DNOs in the EUV flux (which may be assumed to be a proxy for X-ray modulation) and the extension of studies in the optical. Mauche (1996a, 1997) and Mauche & Robinson (2001) have studied the EUV during outbursts of SS Cyg and discovered several new phenomena, including a frequency doubling of DNOs near maximum of outburst. This shows as a reduction of DNO period from 6 s to 3 s; X-ray observations made near maximum of a different outburst of SS Cyg also showed the 3 s modulation (van Teeseling 1997b). It is possible that the effect is in essence geometrical, with emission from two accretion poles being seen when the inner edge of the disk is very close to the WD surface (Warner & Woudt 2002).
Optical studies of VW Hyi (Woudt & Warner 2002; Warner & Woudt 2002) show the correlation of DNO period with luminosity, including for the first time detecting oscillations at 14 s near maximum, which were previously only seen in X-rays (van der Woerd et al. 1987). A rapid slowdown of the DNOs, from a period 20 s to 40 s over about 6 h, coincides with the epoch when the EUV flux plummets almost to zero, and is interpreted as a propeller phase in which accretion is prevented by the magnetic field attached to the rapidly spinning equatorial belt. Following the propeller phase a frequency doubling occurs, which may be a change (at least in visibility) from single pole to two-pole accretion.
X-ray modulations at 27.87 s in WZ Sge in quiescence (Patterson et al. 1998) supports the magnetic accretion model for their origin (see, e.g., Warner & Woudt 2002, and references therein). Their behaviour in the UV during superoutburst (Knigge et al. 2002), for example the lack of coherence and the occurrence of harmonics, also resembles DNO behaviour.
2 Quasi-Periodic Oscillations
In 1977 a second class of unstable optical oscillations was found during dwarf nova outbursts; these have 5, which means that (as they are spread over a wide range of frequency) they are hard to detect in FTs and were only noticed because of large amplitude in the light curve (Patterson et al. 1977). Their low coherence gives them the name ‘quasi-periodic oscillations’ (QPOs). They have time scales typically an order of magnitude longer than the DNOs, can be present or absent during outbursts, and are independent of whether DNOs are active. They have been commonly seen in DN outbursts and in NLs, and even occasionally in DNe at quiescence (Warner 1995; Woudt & Warner 2002).
Very few observations of CV QPOs in X-rays have been made. In soft X-rays a very low amplitude signal at 83 s in SS Cyg during one outburst was found, and 111 s in another (Mauche 1997, 2002a); Córdova & Mason (1984) found a 12% amplitude modulation at 585 s in U Gem during outburst and Ramsay et al. (2001a) found a modulation at 2240 s at low energies in OY Car just after the end of an outburst. At higher energies (2–10 keV) large amplitude 500 s modulations in VW Hyi in the final stages of decline from an outburst were found (Wheatley et al. 1996b).
A third class of optical oscillations has recently been recognised (Warner et al. 2003), which are present during outburst and even very occasionally in quiescence, and change very little in period throughout the outburst of a DN. They are represented by the 88 s oscillations in VW Hyi (Haefner et al. 1979), the 33 s oscillations in SS Cyg (Patterson 1981) and the 92 s oscillations in the NL EC 211754 (Warner et al. 2003). They are typically a factor 4 longer in period than the standard DNOs. They may be represented in X-rays by the 130 s periodicities seen in U Gem during outburst (Córdova et al. 1984; Córdova & Mason 1984).
From the rich phenomenology of optical DNOs and QPOs in dwarf nova outbursts (especially VW Hyi) it has been suggested that the QPOs are caused by slow progradely travelling waves in the inner disk; probably close to the inner radius where magnetic channelling begins (Warner & Woudt 2002). Then the optical QPOs are caused by ‘reflection’ and obscuration of radiation from the central regions of the disk and WD.
In the X-ray region quasi-periodic obscuration would account for the modulations listed above. In all of those cases the X-ray QPOs are similar in time scale to the optical QPOs in the same stars; no simultaneous observations in optical and X-rays have yet been made. The newly recognised longer period DNOs probably arise from magnetically controlled accretion onto the body of the WD itself (rather than just its equatorial belt).

3 The CV Two-QPO Diagram
The optical DNOs and QPOs in CVs behave in a fashion similar to what is seen in the high and low frequency QPOs in LMXBs (Psaltis et al. 1999), namely that 15 (Warner & Woudt 2002; Mauche 2002a; Fig. 7). The X-ray DNOs and QPOs in SS Cyg agree with this relationship (Mauche 2002a), and the optical modulations in VW Hyi follow such a relationship over a range of a factor of two as the star decreases in brightness at the end of outburst (Woudt & Warner 2002). Furthermore, the CV ‘two-QPO diagram’ (i.e., treating the DNOs as higher frequency QPOs) is an extension of that in X-rays to frequencies three orders of magnitude lower (Warner & Woudt 2002; Warner et al. 2003; Fig. 7).
6 X-ray emission from novae
1 X-ray emission mechanisms
In novae888For earlier X-ray reviews see, e.g., Ögelman & Orio (1995), Orio (1999), and Krautter (2002)., after the thermo-nuclear runaway in a H-burning shell at the bottom of the accreted layer on the WD, a shock wave may appear and/or a strong radiation driven wind develops (e.g., Webbink et al. 1987; Gallagher & Starrfield 1978; Starrfield 1989; Shara 1989; Starrfield et al. 1990; Kato & Hachisu 1994). Calculations show that not all the accreted material is ejected, but a substantial fraction (10–90%, depending on the system parameters) can remain on the WD (e.g., Starrfield et al. 1972). Residual H burning of the remaining material in a shell on the WD can thus take place which gives rise to radiation at a constant luminosity, (referred to as the ‘constant bolometric luminosity’, CBL, phase). If not all of the accreted material is burned and blown away, the WD mass may increase towards the Chandrasekhar mass after a large number of outbursts in RNe, eventually leading to a type Ia supernova event or to the formation of a neutron star by accretion induced collapse (e.g., Della-Valle & Livio 1996; Orio & Greiner 1999; but see González-Riestra et al. 1998).
A short-lived X-ray emission phase (1 day) is predicted when the energy of the burning shell first reaches the surface of the WD (Starrfield et al. 1990). The energy is then put into the envelope, which leads to a rapid expansion of the WD photosphere up to 100 ; this leads to a drop in . As the WD photosphere subsequently shrinks back through the ejected material to the equilibrium radius of the WD during the CBL phase, of the photosphere increases again and the peak of the emitted spectrum shifts from visual to UV and finally to the X-ray band (Ögelman et al. 1987, 1993; Shore et al. 1994; MacDonald 1996; Balman et al. 1998, and references therein). At this stage the object is expected to radiate at 1038 erg s-1 with 20–85 eV (e.g., Starrfield 1979; Prialnik 1986), very much like a SSS (see Chapter 11). The duration of the CBL phase is expected to last a few years or less, and is proportional to the left-over envelope mass, which in turn is predicted to be inversely proportional to (e.g., Prialnik 1986; Starrfield 1989; Kato & Hachisu 1989, 1994; Kato 1997; see also González-Riestra et al. 1998, and references therein). Some novae do not show X-rays during the early stages of outburst. This may be attributed to a large column density of the ejecta and argues in favour of high masses for the expelled gas (e.g., Shore et al. 1996). Note that during the first part of the CBL phase the observed soft X-ray flux may still increase, due to the clearing of the ejected material as it expands and its density decreases (Krautter et al. 1996). Once the H burning ceases, the WD photosphere is expected to cool at a constant radius, and drops gradually. Finally, when novae return to quiescence, accretion may resume again, and they then appear as an ordinary CV. The total energy emitted during all stages is 1044–1046 erg.
In addition to the soft component due to H-burning, shocks in the hot circumstellar material can produce hard X-ray emission999Although we here refer to emission typically 0.1 keV, we call it hard X-ray emission in order to distinguish it from the soft component due to H-burning. (e.g., Brecher et al. 1977; Willson et al. 1984; Ögelman et al. 1987; O’Brien et al. 1994; Balman et al. 1998, and references therein). Even if there is no shock wave in the outburst, shocks may originate in interacting winds, or they may be due to interaction between ejecta and pre-existing material. E.g., in RNe and SBNe the donor is a giant star (often a Mira-type object in SBNe; see also Sect. 7), which has lost a significant amount of material through a wind. Note that CNe typically have main-sequence dwarf donors, which will not have significant stellar winds. Alternatively, shocks may occur in the ejected shells during the different phases of the nova outburst. The expected hard X-ray spectrum is thermal, with 0.2–15 keV, depending on how much time has elapsed since the shock, and how efficient the cooling is, and with 1033–1034 erg s-1 (e.g., Lloyd et al. 1992; O’Brien et al. 1994). Additionally a collection of emission lines are expected. Compton scattering of -rays produced in the decay of 22Na and 26Al to X-ray energies are expected to also give rise to hard X-ray emission (Starrfield et al. 1992; Livio et al. 1992; Pistinner et al. 1994). However, this may only become important at 6 keV (Livio et al. 1992); moreover, they are probably not the main source of hard X-rays (Starrfield et al. 1992).
2 Super-soft X-ray emission
The CN GQ Mus (Nova Mus 1983) was the first nova to show supersoft emission similar to SSS (Ögelman et al. 1993). Subsequently, more novae were found to exhibit such a phase, i.e., the CNe V1974 Cyg (Nova Cyg 1992; Krautter et al. 1996; Balman et al. 1998), Nova LMC 1995 (Orio & Greiner 1999), V2487 Oph (Nova Oph 1998; Hernanz & Sala 2002), V382 Vel (Nova Vel 1999; Orio et al. 2002), and V1494 Aql (Nova Aql 1999 No. 2; e.g., Starrfield et al. 2001), and the RN U Sco (Kahabka et al. 1999). The soft component has best-fit temperatures of 30–80 eV with 1037–1038 erg s-1. About 20% of the observed novae have shown a supersoft phase (although not all novae have been followed closely enough to exclude such a phase). One of the reasons put forward why not all novae show a supersoft phase is, that in most novae all the H might be depleted soon after the outburst, therefore providing no time for a CBL phase (Orio et al. 2001a). Simple X-ray fits such as a black-body do not describe the soft component well (see, e.g., Kahabka et al. 1999; Balman & Krautter 2001; Orio et al. 2002). This is because the spectral energy distribution of a hot WD differs considerably from a black-body (e.g., MacDonald & Vennes 1991; Jordan et al. 1994; Hartmann & Heise 1997).
The X-ray turn-off times for most CNe are generally 3–7 years (e.g., Szkody & Hoard 1994; Orio et al. 1996; Hernanz & Sala 2002; see also González-Riestra et al. 1998), suggesting that most of the CNe run out of nuclear fuel in the course of a few years after outburst. V1974 Cyg (see Sect. 4) turned off only 18 months after outburst (Krautter et al. 1996). The turn-off times are much shorter than the nuclear burning times, and imply that the WD has ejected most of its envelope during or soon after the outburst. Note that GQ Mus turned off 9–10 years after outburst (Shanley et al. 1995); at that time the temperature of the cooling remnant was 10 eV. This is somewhat longer than most novae, and it is argued that either more mass was left on the WD than generally inferred, or that the short , 85.5 min, of GQ Mus and the small donor mass had enhanced the effects of irradiation of the donor (e.g., Diaz & Steiner 1994). This in turn may have induced continued accretion on the WD and prolonged the CBL phase (Ögelman et al. 1993; Shanley et al. 1995).
The RN CI Aql showed faint (1033 erg s-1) and very soft (40–50 eV) X-ray emission, 14 and 16 months after the outburst. However, this is not due to H-burning; that phase had already ceased before that time. The observed X-ray emission is suggested to be either due to ionization of the circumstellar material or due to shocks within the wind and/or with the surrounding medium (Greiner & Di Stefano 2002).
In SBNe most of the accreted mass onto the WD is burned quietly for decades, instead of being ejected away quickly as in most CNe. Two SBNe showed supersoft X-ray spectra and luminosities (RR Tel: Jordan et al. 1994; Mürset & Nussbaumer 1994; SMC3/RX J0048.47332: Kahabka et al. 1994; Jordan et al. 1996).
3 Hard X-ray emission
Hard X-ray emission attributed to shocked gas was first detected from the SBN RS Oph in its 1985 outburst. The shocked gas is due to the expanding nova shell colliding with the red giant wind (e.g., Bode & Kahn 1985). Most CNe and RNe emit hard X-rays in the first months of the outburst with peaking at 1033–1034 erg s-1 and bremsstrahlung temperatures in the range 0.5–20 keV (e.g., Orio et al. 2001a, and references therein). The eclipsing, fast (3 days101010 is the time it takes for the nova to decrease by 3 visual magnitudes.) CN V838 Her (Nova Her 1991) was detected in hard X-rays 5 days after the outburst, with a 10 keV bremsstrahlung spectrum (Lloyd et al. 1992). The hard emission generally lasts for at least 2 years and even much longer under special circumstances like pre-existing circumstellar material, or a prolonged wind phase (e.g., Orio et al. 2001a).
SBNe show generally hard X-ray emission with 1030–31033 erg s-1. When plotted as time since outburst, there seems to be a general decay law for the X-ray flux in SBNe following outburst (Allen 1981; Kwok & Leahy 1984; Hoard et al. 1996; Mürset et al. 1997). This is consistent with the decay times of SBNe after the outburst of the order of decades.
4 V1974 Cyg and V382 Vel
Two CNe, V1974 Cyg and V382 Vel, have been monitored quite frequently in X-rays during the decline from their outburst.


V1974 Cyg was optically a bright nova (Fig. 8). It was the first nova to be observed at all wavelengths from -rays to radio. It was a moderately fast nova (35 days) and it was followed from the early rise of the X-ray flux through the time of maximum to the turnoff (Krautter et al. 1996; Fig. 8). The initial observations showed a hard component with a peak around 1 keV. Subsequently, during the X-ray rise, a much softer component appeared that dominated the spectrum at maximum. This soft component decayed more rapidly (by a factor of 35) than the hard component. During the early rise decreased and then leveled off. The rise in the soft component flux and the decrease in is consistent with the clearance of the nova ejecta. The X-ray spectra were best fitted by a WD atmosphere emission model (soft component; 1 keV) and a Raymond-Smith model of thermal plasma (hard component; 1 keV), see Balman et al. (1998). The duration of the CBL is inferred to be 511 days (Krautter et al. 1996).
The hard component spectrum evolved independently of the soft component. The maximum of the hard X-ray emission was reached 150 days after the outburst with 0.8–21034 erg s-1. The time evolution of the hard X-ray flux and the fact that the plasma temperatures decreased from 10 keV to 1 keV suggest emission from shock-heated gas (Balman et al. 1998). This component arose from the interaction of the expanding nova wind with density inhomogeneities, as is also indicated by HST images within the shell (Paresce et al. 1995).
UV observations showed that 500 days after the outburst, the ejecta reached maximum ionization and then started to recombine (Shore et al. 1996). This is coincident with the start of the X-ray turn off observed in X-rays. The decrease in the ionization fraction of the ejecta can be interpreted as a change in the photo-ionization rate from the central source and is due to a decrease in luminosity and after the cessation of nuclear burning. Two years after the X-ray turn-off a 2 eV (20 000 K) for the WD was inferred (Shore et al. 1997). It is possible that the initial X-ray decline in V1974 Cyg was the result of a cooling WD in which most of the energy was radiated outside the X-ray band pass, rather than representing a return to final quiescence. This implies a longer cooling time, hence a larger amount of mass remaining on the WD (Shore et al. 1997).
V382 Vel was a relatively fast nova (10 d). A short RXTE observation was performed 3 days after the peak of the optical outburst, but no X-rays were seen. Hard X-rays were detected 15–17 days after the peak of the optical outburst with 6–10 keV (Orio et al. 2001b; Mukai & Ishida 2001). In the first two months after the outburst it cooled rapidly to 2.4 keV (Mukai & Ishida 2001). LX was 51034 erg s-1 for about 3–5 weeks. As the initially strong intrinsic absorption (21023 cm-2; Orio et al. 2001b) of the ejected nebula was thinning out, the equivalent decreased to 21022 cm-2 (Mukai & Ishida 2001). Four months later the hard component had cooled to a plasma temperature of 1 keV and the absorption column was close to the interstellar value of 1021 cm-2 (Orio et al. 2001b). The hard X-ray emission is interpreted as the result of a shock internal to the nova ejecta. The initial ejecta provide the absorbing column; a layer of later and faster moving ejecta plough into the initial ejecta. Note that in the first X-ray observations a weak Fe K line at 6.6 keV, with EW130 eV, was seen. The weakness of the Fe K line is consistent with the shock model, provided that the shocked plasma is not in ionization equilibrium (Mukai & Ishida 2001).
About six months after the outburst peak V382 Vel appeared as a bright SSS (Orio et al. 2002). The supersoft X-rays were variable by a factor of 2 on a time scale of minutes, which are energy independent. The hard component did not show such variability. Note that variability was also seen in soft X-rays from V1494 Aql, about 10 months after the outburst: it showed a flare which lasted for 15 min; additionally a periodicity near 42 min was found (Drake et al. 2003).
Four months later, the continuum emission from V382 Vel was gone; instead an emission line spectrum, from highly ionised ions, in the supersoft range was inferred. These emission lines presumably have their origin from ionization within the ejected nebula. Note that some of the spectra taken with relatively low resolution may appear softer, if there is a strong superimposed nebular emission. The WD then appears to be cooler than obtained from the spectral fits (Orio et al. 2002).
V382 Vel was followed for a further period of 8 months, starting 7 months after the outburst. Within a period of less than 6 weeks the flux had dropped by a factor 200. Thereafter this component continued to decline more slowly, but still somewhat faster than the hard X-rays. The spectra during this period show a wealth of emission lines, which mainly come from H and He-like transitions of Mg, Ne, O, N and C, as well as some Si and Na lines. Most of the lines are broadened with FWHM2000 km s-1, which is compatible with the velocity of the expanding shell. The He-like triplets of O VII and N VI constrain the plasma temperature to 39–43 eV (Burwitz et al. 2002b). One possibility is that during the late phase of the nova, when the shell has become transparent, the medium around the system is ionised by the still UV/EUV bright WD. Alternatively, the line dominated spectrum could result from the interaction of the expanding shell with the circumstellar material, shocks within the expanding shell, or from shocks due to collisions of a fast wind with the interstellar matter (Greiner & Di Stefano 2002).
5 Quiescent, old novae
Novae in quiescence are often referred to as ‘old’ novae. Sample studies of old novae show X-ray emission with typically 1030–1033 erg s-1 and 1 keV, when detected (e.g., Becker 1981, 1989; Becker & Marshall 1981; Córdova & Mason 1983; Orio et al. 1993, 2001; Balman et al. 1995; Ögelman & Orio 1995). This is comparable to that found for quiescent DNe (see Sect. 1), although the optical quiescent novae are at least 10 times brighter. Fast novae appear to be brighter than slow novae in quiescence (Becker & Marshall 1981; Orio et al. 2001a). Note that V2487 Oph is the first nova to be detected in quiescence both before and after the outburst, with similar fluxes (Hernanz & Sala 2002). The mass transfer rates derived from are much lower than those inferred from other wavelengths, similar to that found for DNe (see Sects. 3, 4). In this case it might be that the BL radiation is emitted entirely in the EUV. The ratio of (0.2–2.4 keV) to varies from 0.005 (DQ Her/Nova Her 1934) to 4.8 (e.g., CP Pup/Nova Pup 1942); for the majority of the systems the value is less than 0.01 (Orio et al. 2001a).
GK Per (Nova Per 1901) is the first nova for which a CN shell was detected in X-rays (Balman & Ögelman 1999; Balman 2002). The X-ray nebula is asymmetric and composed of knots/clumps. The temperature and ionization structures do not vary much across the nebula. Its X-ray spectrum is thermal with at least two temperature components, i.e., 0.2 keV with 21031 erg s-1 and 30 keV with 31031 erg s-1. Distinct Ne IX emission is seen. The knots/clumps are thought to be the result of fragmentation and condensation in the post-shock material. The existence of the X-ray shell in contrast to other CNe is attributed to the high ambient density.
An outlier among the old novae is T Pyx. This RN showed 5 outbursts between 1890 and 1966. Its outbursts are like those of slow novae, whereas all other RNe show fast nova outbursts. Its luminosity in quiescence is higher than other quiescent novae, 1–31036 erg s-1. This has been attributed to steady nuclear burning on the WD (e.g., Webbink et al. 1987).
7 X-ray emission from symbiotic binaries
SBs are divided into two subcategories based on their IR colours. S-type (‘stellar’) systems have IR colours like those if isolated field red giants, whereas D-type (‘dusty’) systems have IR colours which are redder, indicative of dust. D-type systems generally contain Mira variables with very high mass-loss rates. The wind is ionised by the WD giving rise to the symbiotic nebula.
SBs show small ‘outbursts’ where the optical increases by 1–2 mag on time scales of years. The origin of these outbursts is still rather unclear. They may be related to quasi-steady burning of matter on the WD, shell flashes, or unstable accretion. Symbiotic Novae (SBNe) are a small subgroup of the SBs. They undergo large amplitude (7 mag increase) outbursts with durations on the order of decades. These outbursts are thought to be due to thermonuclear runaway events on the surface of the WD. SBNe are discussed in Sect. 6.
Many of the SBs are detected in X-rays. The most X-ray luminous are the D-types, whereas the S-types are typically two order of magnitudes fainter. Also, SBNe are generally brighter in X-rays compared to the other SBs. This is probably because the average luminosities of SBNe are higher than for the other SBs. SBs have been shown to emit either supersoft X-ray emission, and/or hard X-ray emission from an optically thin plasma with 0.25–1.3 keV with 1030–1033 erg s-1, or even harder X-ray emission, as from an accreting neutron star (see, e.g., Mürset et al. 1997, and references therein).
The hard X-ray emission may be due to the colliding winds of the red giant and the WD (e.g., Willson et al. 1984; Kwok & Leahy 1984), jets, if they exist (e.g., Viotti et al. 1987; Leahy & Volk 1995), jets colliding with the interstellar material (e.g., Viotti et al. 1987; Ezuka et al. 1998), X-ray emission from the red giant (see, e.g., Ezuka et al. 1998), or accretion onto the WD (e.g., Leahy & Taylor 1987; Jordan et al. 1994). The hard X-ray spectra can be interpreted as being composed of two components (e.g., Leahy & Volk 1995; Ezuka et al. 1998). However, Wheatley (2001) showed that the hard X-ray emission can be solely due to emission from the WD which is strongly absorbed by a partionally ionised wind from the red giant.
In SBs, Bondi-Hoyle capture of the red giant wind gives 10-8 yr-1 onto the WD, which could produce nuclear burning in some systems (Sion & Starrfield 1994). This might give rise to supersoft X-ray emission, similar to that seen in CNe and RNe (see Sect. 6) and other SSS (see Chapter 11). Depending on how much matter the WD receives and steadily burns, it may be able increase its mass. SBs have therefore been also put forward as candidates for Type Ia supernovae (e.g., Munari & Renzini 1992). It has been noted, however, that either not enough mass can be accreted from the donor, or a mass outflow from the WD may inhibit such a phase (Mürset & Nussbaumer 1994; Mürset et al. 1997).
Apart from two SBNe (RR Tel and SMC3, see Sect. 2), among the SBs only AG Dra has shown supersoft X-ray emission. This system is also one of the brightest X-ray sources among the SBs (e.g., Anderson et al. 1981). During quiescence X-ray spectra show a soft component with a temperature of 14–15 eV (Greiner et al. 1997; see also Piro et al. 1985; Kenyon 1988). The X-ray luminosity remained constant during quiescence at a level of 1037 erg s-1 (Greiner et al. 1997).
AG Dra is also the first SB to be observed during outburst in X-rays (Viotti et al. 1995). During the minor (1 mag increase) and major (2 mag increase) outbursts AG Dra displays different behaviour. Although during both outbursts the X-ray flux dropped, decreased by a few eV during the major outbursts, while it increased by a few eV during the minor outbursts. The behaviour during the major outbursts is explained by expansion (factor 2–6) and cooling of the WD atmosphere, which also explains the anti-correlation between optical/UV and X-ray fluxes (Greiner et al. 1997; González-Riestra et al. 1999). The cooling could be the result of an increased onto the compact object causing it to expand slowly (Greiner et al. 1997). The minimum X-ray flux during ‘hot’ outbursts might be attributed to the increased absorbing layer between the X-ray source and observer (Friedjung 1988).
8 Concluding remarks
During the last decade there has been a staggering flow of new information, not only in X-rays, but also from other wavelengths. Nowadays, substantial progress in understanding the behaviour of CVs is generally made through multi-wavelength efforts. Unfortunately, the space available in this Chapter has not allowed us to fully discuss observations across the whole electro-magnetic spectrum. Nevertheless, we have shown that our somewhat ‘restricted’ view at EUV and X-ray wavelengths has revealed a great variety of rich phenomena taking place in the environment of an accreting white dwarf.
Substantial improvements in our understanding of CVs at high energies are already coming from the instruments on board Chandra and XMM-Newton and further advances are inevitable over the next few years. These instruments provide the necessary spectral resolution to perform sensible temperature and velocity diagnostics from individually resolved lines and line ratios; something we have previously been used to at optical wavelengths. These exquisite instruments and those which are yet to come will provide us with even more information, and will leave us enough work for many years to come.
Acknowledgements
We acknowledge discussions with K. Beuermann, J.-P. Lasota, C. Mauche, M. Orio, S. Starrfield and P. Wheatley. AS is supported by the German Bundesministerium für Bildung und Forschung through the Deutsches Zentrum für Luft- und Raumfahrt e.V. (DLR) under grant number 50 OR 9706 8. BW is supported by research funds from the University of Cape Town.
References
- [1] Allan, A., Hellier, C., Beardmore, A. (1998), MNRAS 295, 167
- [2] Allan, A., et al. (1996), MNRAS 279, 1345
- [3] Allen, D.A. (1981), MNRAS 197, 739
- [4] Anderson, C.M., Cassinelli, J.P., Sanders, W.T. (1981), ApJ 247, L127
- [5] Armitage, P.J., Livio, M. (1996), ApJ 470, 1024
- [6] Armitage, P.J., Livio, M. (1998), ApJ 493, 898
- [7] Aizu, K. (1973), Prog. Theor. Phys. 49, 1184
- [8] Bailey, J. (1995), ASP Conf. Ser. 85, p. 10
- [9] Balman, S. (2002), ASP Conf. Ser. 261, p. 617
- [10] Balman, S., Krautter, J. (2001), MNRAS 326, 1441
- [11] Balman, S., Ögelman, H.B. (1999), ApJ 518, L111
- [12] Balman, S., Orio, M., Ögelman, H. (1995), ApJ 449, L47
- [13] Balman, S., Krautter, J., Ögelman, H. (1998), ApJ 499, 395
- [14] Baskill, D.S., Wheatley, P.J., Osborne, J.P. (2001), MNRAS 328, 71
- [15] Bath, G.T., Evans, W.D. & Pringle, J.E. (1974a), MNRAS 166, 113
- [16] Bath, G.T., et al. (1974b), MNRAS 169, 447
- [17] Beardmore, A.P., Osborne, J.P., Hellier, C. (2000), MNRAS 315, 307
- [18] Beardmore, A.P., et al. (1998), MNRAS 297, 337
- [19] Becker, R.H. (1981), ApJ 251, 626
- [20] Becker, R.H. (1989), in Classical Novae, eds. M.F. Bode, & A. Evans, Wiley, New York, p. 215
- [21] Becker, R.H., Marshall, F.E. (1981), ApJ 244, L93
- [22] Belloni, T., Psaltis, D., van der Klis, M. (2002), ApJ 572, 392
- [23] Belloni, T., et al. (1991), A&A 246, L44
- [24] Beuermann, K. (1999), MPE Report 272, p. 410
- [25] Beuermann, K., Burwitz, V. (1995), ASP Conf. Ser. 85, p. 99
- [26] Beuermann, K., Schwope A. (1994), ASP Conf. Ser. 56, p. 119
- [27] Beuermann, K., Thomas, H.-C. (1993), AdSpR 13, 115
- [28] Beuermann, K., Thomas, H.-C., Pietsch, W. (1991), A&A 246, L36
- [29] Bode, M.F., Kahn, F.D. (1985), MNRAS 217, 205
- [30] Bonnet-Bidaud, J.M., Mouchet, M. (1987), A&A 188, 89
- [31] Brecher, K., Ingham, W.H., Morrison, P. (1977), ApJ 213, 492
- [32] Buckley, D.A.H., Tuohy, I.R. (1989), ApJ 344, 376
- [33] Buckley, D.A.H., et al. (1997), MNRAS 287, 117
- [34] Burwitz, V., et al. (1996), A&A 310, 25
- [35] Burwitz, V., et al. (2002a), ASP Conf. Ser. 261, p. 137
- [36] Burwitz, V., et al. (2002b), AIP Conf. Proc. 637, p. 377
- [37] Córdova, F.A., 1995, in X-ray Binaries, eds. W.H.G. Lewin, J. van Paradijs, & E.P.J. van den Heuvel, CUP, p. 331
- [38] Córdova, F.A., Mason, K.O. (1983), in Accretion driven Stellar X-ray sources, eds. W.H.G. Lewin, & E.P.J. van den Heuvel, CUP, p. 147
- [39] Córdova, F.A., Mason, K.O. (1984), MNRAS 206, 879
- [40] Córdova, F.A., Mason, K.O., Nelson, J.E. (1981), ApJ 245, 609
- [41] Córdova, F.A., et al. (1980a), MNRAS 190, 87
- [42] Córdova, F.A., et al. (1980b), ApJ 235, 163
- [43] Córdova, F.A., et al. (1984), ApJ 278, 739
- [44] Cropper, M. (1990), SSRv 54, 195
- [45] Cropper, M., Ramsay G., Wu., K. (1998), MNRAS 293, 222
- [46] Cropper, M., Wu, K., Ramsay G. (2000), NewAR 44, 57
- [47] de Martino, D., et al. (2001), A&A 377, 499
- [48] Della-Valle, M., Livio, M. (1996), ApJ 473, 240
- [49] Diaz, M.P., Steiner, J.E. (1994), ApJ 425, 252
- [50] Done C., Magdziarz, P. (1998), MNRAS 298, 737
- [51] Done, C., Osborne, J.P. (1997), MNRAS 288, 649
- [52] Drake, J.J., et al. (2003), ApJ 584, 448
- [53] Drew, J., Verbunt, F. (1985), MNRAS 213, 191
- [54] Duck, S.R., et al. (1994) MNRAS 271, 372
- [55] Eracleous, M., Halpern, J., Patterson, J. (1991a), ApJ 382, 290
- [56] Eracleous, M., Patterson, J., Halpern, J. (1991b), ApJ 370, 330
- [57] Ezuka, H., Ishida, M., Makino, F. (1998), ApJ 499, 388
- [58] Ferland, G.J., et al. (1982), ApJ 262, L53
- [59] Fischer A., Beuermann K. (2001), A&A 373, 211
- [60] Fontaine, G., Montmerle, T., Michaud, G. (1982), ApJ 257, 695
- [61] Frank, J., King, A.R., Lasota, J.-P. (1987), A&A 178, 137
- [62] Frank, J., King, A.R., Lasota, J.-P. (1988), A&A 193, 113
- [63] Friedjung, M. (1988), Proc. IAU Coll. 103, p. 199
- [64] Fujimoto, R., Ishida, M. (1995), ASP Conf. Ser. 85, p. 136
- [65] Gallagher, J.S., Starrfield, S. (1978), ARA&A 16, 171
- [66] Gänsicke, B.T., Beuermann, K., de Martino, D. (1995), A&A 303, 127
- [67] González-Riestra, R., Orio, M., Gallagher, J. (1998), A&ASS 129, 23
- [68] González-Riestra, R., et al. (1999), A&A 347, 478
- [69] Greiner, J. (1999), A&A 336, 626
- [70] Greiner, J., Di Stefano, R. (2002), ApJ 578, L59
- [71] Greiner, J., van Teeseling, A. (1998), A&A 339, L21
- [72] Greiner, J., et al. (1997), A&A 322, 576
- [73] Greiner, J., et al. (1999), A&A 343, 183
- [74] Haberl, F., Motch, C. (1995), A&A 297, L37
- [75] Haberl, F., et al. (1994), A&A 291, 171
- [76] Hack, M., La Dous, C. (1993), Cataclysmic Variables and Related Objects, NASA SP-507
- [77] Haefner, R, Schoembs, R., Vogt, N. (1979), A&A 77, 7
- [78] Hameury, J.-M., King, A.R., Lasota, J.-P. (1986), MNRAS 218, 695
- [79] Hartmann, H.W., Heise, J. (1997), A&A 322, 591
- [80] Hartmann, H.W., et al. (1999), A&A 349, 588
- [81] Heise, J., et al. (1985), A&A 148, L14
- [82] Heise, J., et al. (1978), A&A 63, L1
- [83] Hellier, C. (1991), MNRAS 251, 693
- [84] Hellier, C. (1992), MNRAS 258, 578
- [85] Hellier, C. (1996), Proc. IAU Coll. 158, p. 143
- [86] Hellier, C. (1997), MNRAS 291, 71
- [87] Hellier, C., Beardmore, A.P. (2002), MNRAS 331, 407
- [88] Hellier, C., Cropper, M., Mason, K.O. (1991), MNRAS 248, 233
- [89] Hellier, C., Garlick, M.A., Mason, K.O. (1993), MNRAS 260, 299
- [90] Hellier, C., Mukai, K., Beardmore, A.P. (1997), MNRAS 292, 397
- [91] Hellier, C., Mukai, K., Osborne, J.P. (1998), MNRAS 297, 526
- [92] Hellier, C., et al. (1989), MNRAS 238, 1107
- [93] Hellier, C., et al. (1996), MNRAS 280, 877
- [94] Hempelmann, A., et al. (1995), A&A 294, 515
- [95] Hernanz, M., Sala, G. (2002), Science 298, 393
- [96] Hessman, F.V., Gänsicke, B.T., Mattei, J.A. (2000), A&A 361, 952
- [97] Hoare, M.G., Drew, J.E. (1991), MNRAS 249, 452
- [98] Hoard, D.W., Wallerstein, G., Willson, L.A. (1996), PASP 108, 81
- [99] Horne, K., et al. (1994), ApJ 426, 294
- [100] Ishida, M. (1991), PhD thesis, University of Tokyo
- [101] Ishida, M., Ezuka, H. (1999), ASP Conf. Ser. 157, p. 333
- [102] Ishida, M., Fujimoto, R. (1995), ASP Conf. Ser. 85, p. 132
- [103] Ishida, M., et al. (1992), MNRAS 254, 647
- [104] Jensen, K.A. (1984), ApJ 278, 278
- [105] Jones, M.H., Watson, M.G. (1992), MNRAS 257, 633
- [106] Jordan, S., Mürset, U., Werner, K. (1994), A&A 283, 475
- [107] Jordan, S., et al. (1996), A&A 312, 897
- [108] Kahabka, P., Pietsch, W., Hasinger, G. (1994), A&A 288, 538
- [109] Kahabka, P., et al. (1999), A&A 347, L43
- [110] Kallman, T.R., Jensen, K.A. (1985), ApJ 299, 277
- [111] Kamata, Y., Koyama K. (1993), ApJ 405, 307
- [112] Kato, M. (1997), ApJS 113, 121
- [113] Kato, M., Hachisu, I. (1989), ApJ 346, 424
- [114] Kato, M., Hachisu, I. (1994), ApJ 437, 802
- [115] Katz, J.I. (1975), ApJ 200, 298
- [116] Kenyon, S.J. (1988), Proc. IAU Coll. 103, p. 11
- [117] King, A.R. (1997), MNRAS 288, L16
- [118] King, A.R., Cannizzo, J.K. (1998), ApJ 499, 348
- [119] King, A.R., Lasota, J.-P. (1979) MNRAS 188, 653
- [120] King, A.R., Lasota, J.-P. (1991) ApJ 378, 674
- [121] King, A.R., Shaviv, G. (1984), MNRAS 211, 883
- [122] Knigge, C., et al. (2002), ApJ 580, L151
- [123] Krautter, J. (2002), AIP Conf. Proc. 637, p. 345
- [124] Krautter, J., et al. (1996), ApJ 456, 788
- [125] Krzemiński, W., Serkowski, K. (1977), ApJ 216, L45
- [126] Kuijpers, J., Pringle, J.E. (1982), A&A 114, L4
- [127] Kunze, S., Speith, R., Hessman, F.V. (2001), MNRAS 322, 499
- [128] Kuulkers, E., et al. (1998), ApJ 494, 753
- [129] Kuulkers, E., et al. (2002), ASP Conf. Proc. 261, p. 443
- [130] Kwok, S., Leahy, D.A. (1984), ApJ 283, 675
- [131] Lamb, D.Q., Masters, A.R. (1979), ApJ 234, L117
- [132] Lasota, J.P., Hameury, J.M., Huré, J.M. (1995), A&A 302, L29
- [133] Leahy, D.A., Taylor, A.R. (1987), A&A 176, 262
- [134] Leahy, D.A., Volk, K. (1995), ApJ 440, 847
- [135] Litchfield, S.J., King, A.R. (1990), MNRAS 247, 200
- [136] Livio, M., Pringle, J.E. (1992), MNRAS 259, 23P
- [137] Livio, M., et al. (1992), ApJ 394, 217
- [138] Lloyd, H.M., et al. (1992), Nat 356, 222
- [139] Long, K.S., et al. (1996), ApJ 469, 841
- [140] Lynden-Bell, D., Pringle, J.E. (1974), MNRAS 168, 603
- [141] MacDonald, J. (1996), Proc. IAU Coll. 158, p. 281
- [142] MacDonald, J., Vennes, S. (1991), ApJ 371, 719
- [143] Marsh, T.R. (1999), MNRAS 304, 443
- [144] Marsh, T.R., Steeghs, D. (2002), MNRAS 331, L7
- [145] Mason, K.O. (1985), SSRv 40, 99
- [146] Mason, K.O. (1986), Lecture Notes in Physics 266, p. 29
- [147] Mason, K.O., Drew, J.E., Knigge, C. (1997), MNRAS 290, L23
- [148] Mason, K.O., et al. (1978), ApJ 226, L129
- [149] Mason, K.O., et al. (1988), MNRAS 232, 779
- [150] Mason, K.O., et al. (1992), MNRAS 258, 749
- [151] Matt, G., et al. (2000), A&A 358, 177
- [152] Mauche, C.W. (1996a), ApJ 463, L87
- [153] Mauche, C.W. (1996b), Proc. IAU Coll. 158, p. 243
- [154] Mauche, C.W. (1997), ApJ 476, L85
- [155] Mauche, C.W. (1999), ASP Conf. Ser. 157, p. 157
- [156] Mauche, C.W. (2002a), ApJ 580, 423
- [157] Mauche, C.W. (2002b), ASP Conf. Ser. 261, p. 113
- [158] Mauche, C.W., Mukai, K. (2002), ApJ 566, L33
- [159] Mauche, C.W., Raymond, J.C. (1987), ApJ 323, 690
- [160] Mauche, C.W., Raymond, J.C. (2000), ApJ 541, 924
- [161] Mauche, C.W., Robinson, E.L. (2001), ApJ 562, 508
- [162] Mauche, C.W., Liedahl, D.A., Fournier, K.B. (2001), ApJ 560, 992
- [163] Mauche, C.W., Raymond, J.C., Mattei, J.A. (1995), ApJ 446, 842
- [164] Mauche, C.W., et al. (1991), ApJ 372, 659
- [165] Meyer, F., Meyer-Hofmeister, E. (1994), A&A 288, 175
- [166] Motch, C., et al. (1996), A&A 307, 459
- [167] Mukai, K. (1995), ASP Conf. Ser. 85, p. 119
- [168] Mukai, K. (2000), NewAR 44, 9
- [169] Mukai, K., Ishida, M. (2001), ApJ 551, 1024
- [170] Mukai, K., Shiokawa, K. (1993), ApJ 418, 863
- [171] Mukai, K., et al. (1997), ApJ 475, 812
- [172] Mukai, K., et al. (2003), ApJ 586, L77
- [173] Munari, U., Renzini, A. (1992), ApJ 397, L87
- [174] Mürset, U., Nussbaumer, H. (1994), A&A 282, 586
- [175] Mürset, U., Wolff, B., Jordan, S. (1997), A&A 319, 201
- [176] Narayan, R., Popham, R. (1993), Nat 362, 820
- [177] Naylor, T., La Dous, C. (1997), MNRAS 290, 160
- [178] Naylor, T., et al. (1987), MNRAS 229, 183
- [179] Naylor, T., et al. (1988), MNRAS 231, 237
- [180] Norton, A.J. (1993), MNRAS 265, 316
- [181] Norton, A.J., Watson, M.G. (1989), MNRAS 237, 853
- [182] Norton, A.J., Watson, M.G., King, A.R. (1991), Lecture Notes in Physics 385, p. 155
- [183] Norton, A.J., et al. (1992a), MNRAS 254, 705
- [184] Norton, A.J., et al. (1992b), MNRAS 258, 697
- [185] Norton, A.J., et al. (1997), MNRAS 289, 362
- [186] Norton, A.J., et al. (1999), A&A 347, 203
- [187] O’Brien, T.J., Lloyd, H.M., Bode, M.F. (1994), MNRAS 271, 155
- [188] Ögelman, H., Orio, M. (1995), in Cataclysmic Variables, eds. A. Bianchini, M. Della Valle, & M. Orio, Dordrecht, Kluwer, p. 11
- [189] Ögelman, H., Krautter, J., Beuermann, K. (1987), A&A 177, 110
- [190] Ögelman, H., et al. (1993), Nat 361, 331
- [191] Orio, M. (1999), Physics Reports 311, 419
- [192] Orio, M., Greiner, J. (1999), A&A 344, L13
- [193] Orio, M., Covington, J., Ögelman, H. (2001a), A&A 373, 542
- [194] Orio, M., et al. (1993), AdSpR 13, 351
- [195] Orio, M., et al. (1996), ApJ 466, 410
- [196] Orio, M., et al. (2001b), MNRAS 326, L13
- [197] Orio, M., et al. (2002), MNRAS 333, L11
- [198] Paczyński, B. (1978), in Nonstationary Evolution in Close Binaries, ed. A. Żytkow, Polish Sci. Publ., Warsaw, p. 89
- [199] Paresce, F., et al. (1995), A&A 299, 823
- [200] Parmar, A.N., White, N.E. (1988), Mem. Soc. Astr. It. 59, 147
- [201] Patterson, J. (1981), ApJS 45, 517
- [202] Patterson, J. (1984), ApJS 54, 443
- [203] Patterson, J., Price, C. (1980), IAU Circ. 3511
- [204] Patterson, J., Raymond, J.C. (1985a), ApJ 292, 535
- [205] Patterson, J., Raymond, J.C. (1985b), ApJ 292, 550
- [206] Patterson, J., Robinson, E.L., Nather, R.E. (1977), ApJ 214, 144
- [207] Patterson, J., Robinson, E.L., Nather, R.E. (1978), ApJ 224, 570
- [208] Patterson, J., et al. (1998), PASP 110, 403
- [209] Patterson, J., et al. (2001), PASP 113, 72
- [210] Piro, L., et al. (1985), IAU Circ. 4082
- [211] Pistinner, S., Shaviv, G., Starrfield, S. (1994), ApJ 437, 794
- [212] Polidan, R.S., Holberg, J.B. (1984), Nat 309, 528
- [213] Polidan, R.S., Mauche, C.W., Wade, R.A. (1990), ApJ 356, 211
- [214] Ponman, T.J., et al. (1995), MNRAS 276, 495
- [215] Popham, R., Narayan, R. (1995), ApJ 442, 337
- [216] Pratt, G.W., et al. (1999a), MNRAS 307, 413
- [217] Pratt, G.W., et al. (1999b), MNRAS 309, 847
- [218] Predehl, P., Schmitt, J.H.M.M. (1995), A&A 293, 889
- [219] Prialnik, D. (1986), ApJ 310, 222
- [220] Pringle, J.E. (1977), MNRAS 178, 195
- [221] Pringle, J.E. (1981), ARA&A 19, 137
- [222] Pringle, J.E., Rees, M.J. (1972), A&A 21, 1
- [223] Pringle, J.E., Savonije, G.J. (1979), MNRAS 187, 777
- [224] Pringle, J.E., et al. (1987), MNRAS 225, 73
- [225] Psaltis, D., Belloni, T., van der Klis, M. (1999), ApJ 520, 262
- [226] Rappaport, S., et al. (1974), ApJ 187, L5
- [227] Ramsay, G., et al. (1994,) MNRAS 270, 692
- [228] Ramsay, G., et al. (2001a), A&A 365, L288
- [229] Ramsay, G., et al. (2001b), A&A 365, L294
- [230] Raymond, J.C., Mauche, C.W. (1991), in Extreme Ultraviolet Astronomy, ed. R.F. Malina & S. Bowyer, Pergamon, New York, p. 163
- [231] Reimers, D., Hagen, H.-J. (2000), A&A 358, L45
- [232] Reimers, D., Hagen, H.-J., Hopp, U. (1999), A&A 343, 157
- [233] Richman, H.R. (1996), ApJ 462, 404
- [234] Ritter, H., Kolb, U. (2003), A&A 404, 301
- [235] Rosen, S.R., Mason, K.O., Córdova, F.A. (1988), MNRAS 231, 549
- [236] Rosen, S.R., et al. (1991), MNRAS 249, 417
- [237] Rosner, R., Golub, L., Vaiana, G.S. (1985), ARA&A 23, 413
- [238] Schlegel, E.M., Singh, J. (1995), MNRAS 276, 1365
- [239] Schmitt, J.H.M.M., et al., (1990), ApJ 365, 704
- [240] Schwarz, R., et al. (2002), ASP Conf. Ser. 261, p. 167
- [241] Schwope, A.D. (1996), Proc. IAU Coll. 158, p. 189
- [242] Schwope, A.D. (2001), Lecture Notes in Physics 573, p. 127
- [243] Schwope, A.D., et al. (2001), A&A 375, 419
- [244] Schwope, A.D., et al. (2002), A&A 392, 541
- [245] Shakura, N.I., Sunyaev, R.A. (1973), A&A 24, 337
- [246] Shanley, L., et al. (1995), ApJ 438, L95
- [247] Shara, M.M. (1989), PASP 101, 5
- [248] Shore, S.N., Starrfield, S., Sonneborn, G. (1996), ApJ 463, L21
- [249] Shore, S.N., et al. (1994), ApJ 421, 344
- [250] Shore, S.N., et al. (1997), ApJ 490, 393
- [251] Silber, A., Vrtilek, S.D., Raymond, J.C. (1994), ApJ 425, 829
- [252] Sion, E.M., Starrfield, S.G. (1994), ApJ 421, 261
- [253] Sion, E.M., et al. (1996), ApJ 471, L41
- [254] Sion, E.M., et al. (2002), ASP Conf. Proc. 261, p. 69
- [255] Sirk, M.M., Howell, S.B. (1998), ApJ 506, 824
- [256] Starrfield, S. (1979), Proc. IAU Coll. 53, p. 274
- [257] Starrfield, S. (1989), in Classical Novae, eds. M. Bode & A. Evans, Wiley, New York, p. 39
- [258] Starrfield, S., et al. (1972), ApJ 176, 169
- [259] Starrfield, S., et al. (1990), Proc. IAU Coll. 122, p. 306
- [260] Starrfield, S., et al. (1992), ApJ 391, L71
- [261] Starrfield, S., et al. (2001), Bull. AAS 198, 11.09
- [262] Swank, J.H. (1979), Proc. IAU Coll. 53, p. 135
- [263] Swank, J.H., et al. (1978), ApJ 226, L133
- [264] Szkody, P. (1999), Frontiers Science Ser. 26, p. 53
- [265] Szkody, P., Hoard, D.W. (1994), ApJ 429, 857
- [266] Szkody, P., Kii, T., Osaki, Y. (1990), AJ 100, 546
- [267] Szkody, P., Osborne, J., Hassall, B.J.M. (1988), ApJ 328, 243
- [268] Szkody, P., et al. (1996), ApJ 469, 834
- [269] Szkody, P., et al. (1999), ApJ 521, 362
- [270] Szkody, P., et al. (2002a), ApJ 574, 942
- [271] Szkody. P., et al. (2002b), AJ 123, 413
- [272] Taylor, P., et al. (1997), MNRAS 289, 349
- [273] Tylenda, R. (1981), Acta Astronomica 31, 127
- [274] Ulla, A. (1995), A&A 301, 469
- [275] van der Woerd, H., Heise, J., Bateson, F. (1986), A&A 156, 252
- [276] van der Woerd, H., et al. (1987), A&A 182, 219
- [277] van Teeseling, A. (1997a), A&A 319, L25
- [278] van Teeseling, A. (1997b), A&A 324, L73
- [279] van Teeseling, A., Verbunt, F. (1994), A&A 292, 519
- [280] van Teeseling, A., Beuermann, K., Verbunt, F. (1996), A&A 315, 467
- [281] van Teeseling, A., Fischer, A., Beuermann, K. (1999), ASP Conf. Ser. 157, p. 309
- [282] van Teeseling, A., Verbunt, F., Heise, J. (1993), A&A 270, 159
- [283] van Teeseling, A. et al. (1995), A&A 300, 808
- [284] Verbunt, F. (1987), A&AS 71, 339
- [285] Verbunt, F. (1996), MPE Report 263, p. 93
- [286] Verbunt, F., Wheatley, P.J., Mattei, J.A. (1999), A&A 346, 146
- [287] Verbunt, F., et al. (1997), A&A 327, 602
- [288] Viotti, R., et al. (1987), ApJ 319, L7
- [289] Viotti, R., et al. (1995), in Cataclysmic Variables, eds. A. Bianchini, M. Della Valle, & M. Orio, Kluwer, Dordrecht, p. 195
- [290] Vrtilek, S.D., et al. (1994), ApJ 425, 787
- [291] Walker, M.F. (1956), ApJ 123, 68
- [292] Warner, B. (1980), IAU Circ. 3511
- [293] Warner, B. (1983), Proc. IAU Coll. 72, p. 155
- [294] Warner, B. (1986), MNRAS 219, 347
- [295] Warner, B. (1995), Cataclysmic Variable Stars, CUP
- [296] Warner, B., Robinson, E.L. (1972), Nature Phys. Sci. 239, 2
- [297] Warner, B., Woudt, P.A. (2002), MNRAS 335, 84
- [298] Warner, B., O’Donoghue, D., Wargau, W. (1989), MNRAS 238, 73
- [299] Warner, B., Livio, M., Tout, C.A. (1996), MNRAS 282, 735
- [300] Warner, B., Woudt, P.A., Pretorius, R. (2003), MNRAS, in press [astro-ph/0306085]
- [301] Warner, B., et al. (1972), MNRAS 159, 321
- [302] Warren, J.K., Sirk, M.M., Vallerga, J.V. (1995), ApJ 445, 909
- [303] Watson, M.G. (1986), Lecture Notes in Physics 266, p. 97
- [304] Watson, M.G., King, A.R., Heise, J. (1985), SSRv 40, 127
- [305] Watson, M.G., et al. (1989), MNRAS 237, 299
- [306] Webbink, R.F., et al. (1987), ApJ 314, 653
- [307] Webbink, R., Wickramasinghe, D.T. (2002), MNRAS 335, 1
- [308] Wheatley, P.J. (2001), AIP Conf. Ser. 599, p. 1007
- [309] Wheatley, P.J., West, R.G. (2002), ASP Conf. Proc. 261, p. 433
- [310] Wheatley, P.J., et al. (1996a), MNRAS 283, 101
- [311] Wheatley, P.J., et al. (1996b), A&A 307, 137
- [312] Wheatley, P.J., et al. (2000), NewAR 44, P33
- [313] Wheatley, P.J., et al. (2003), MNRAS, in press [astro-ph/0306471]
- [314] White, N.E., Marshall, F.E. (1980), IAU Circ. 3514
- [315] White, N.E., Nagase, F., Parmar, A.N. (1995), in X-ray Binaries, eds. W.H.G. Lewin, J. van Paradijs, & E.P.J. van den Heuvel, CUP, p. 1
- [316] Wickramasinghe, D.T., Ferrario, L. (2000), PASP 112, 873
- [317] Willson, L.A., et al. (1984), A&A 133, 137
- [318] Woelk, U., Beuermann, K. (1996), A&A 306, 232
- [319] Wood, J.H., Naylor, T., Marsh, T.R. (1995b), MNRAS 274, 31
- [320] Wood, J.H., et al. (1995a), MNRAS 273, 772
- [321] Woods, A.J., Drew, J.E., Verbunt, F. (1990), MNRAS 245, 323
- [322] Woudt, P.A., Warner, B. (2002), MNRAS 333, 411
- [323] Wu, K., et al. (2002), MNRAS 331, 221
- [324] Wynn, G.A., King, A.R. (1992), MNRAS 255, 83
- [325] Yoshida, K., Inoue, H., Osaki, Y. (1992), PASJ 44, 537