email: wreich@mpifr-bonn.mpg.de
G0.0870.087, a highly polarized flat spectrum filament
near the Galactic Centre
Arc††thanks: Based on observations with the Effelsberg 100-m telescope
operated by the Max-Planck-Institut für Radioastronomie (MPIfR), Bonn,
Germany
32 GHz observations with the Effelsberg 100-m telescope revealed a highly polarized Galactic Centre filament: G0.0870.087, running parallel to the well-known Arc structure. It has a similar flat spectrum, but it is an order of magnitude weaker. G0.0870.087 is about or 6.2 pc long and located at the western boundary of the expanding molecular cloud G0.110.11. This unusual cloud is also visible in X-rays and known to interact on its eastern periphery with the Arc. Acceleration of highly relativistic particles at the surface of G0.110.11 seems necessary to explain the properties of both structures. The new filament supports previous findings on the existence of a strong poloidal magnetic field throughout the Galactic Centre region.
Key Words.:
Galaxy: center – radiation mechanisms: non-thermal – techniques: polarimetric1 Introduction
The Galactic Centre (GC) Arc is one of the most unusual radio structures in the Galaxy. It is located at a projected distance of about 30 pc from the Sgr A complex and consists of long, thin, almost straight filaments, running nearly perpendicular to the Galactic plane, embedded in diffuse emission. The spectrum of the Arc is flat or inverted up to 43 GHz (Reich et al. rei88 (1988)) and compatible with a quasi-monoenergetic particle spectrum. This holds for its most intense section of about 40 pc in length within the Galactic disk. Its spectrum steepens drastically away from the plane, where the Arc can be followed up to about 400 pc distance (Reich rei90 (1990); Pohl et al. pohl92 (1992)). High-frequency observations beyond 10 GHz are required to directly trace the magnetic field structure of the Arc, since large rotation measures (RMs) exceeding several thousands are observed, and in addition strong depolarization is present.
Early Effelsberg 32 GHz measurements including linear polarization (Reich rei90 (1990); Lesch & Reich lesch92 (1992)) revealed percentage polarizations of about 50% close to its intrinsic value of about 60% with the magnetic field running almost parallel to the Arc. Its narrow filaments disappear at 43 GHz, while the flux density dominating diffuse component is still visible (Sofue et al. sof92 (1992)). These observations agree with a magnetic field strength in the milli–Gauss range for the filaments as proposed by Yusef-Zadeh & Morris (1987a ) to resist the pressure by interstellar clouds. However, such strong magnetic fields limit the synchrotron lifetime to a few hundred years, which is significantly below that of the diffuse Arc component where the magnetic field strength is of the order of Gauss assuming equipartition (Reich rei90 (1990)). Several particle acceleration scenarios have been proposed to explain the unusual properties of the Arc. The detection of excessive 150 GHz emission (Reich et al. rei99 (2000)) at the boundary of a massive expanding molecular cloud (Tsuboi et al. tsu97 (1997); Oka et al. Oka97 (1997)) has strengthened the idea of particle acceleration by magnetic reconnection at the surface of that cloud.
The Arc is a unique structure, although deep low-frequency observations revealed a number of similar although much fainter and shorter nonthermal filaments (NTFs) in the GC area (LaRosa et al. la00 (2000)). The NTFs have in general steep spectra. Some of them show a spectral steepening with frequency (Lang et al. la99 (1999)) or a spectral index gradient along their length (LaRosa et al. la01 (2001)). Like the Arc many NTFs are located close to molecular clouds. The NTFs may represent fading relics of structures similar to the Arc, where particle acceleration stopped or became inefficient. Strong magnetic fields then quickly steepen the spectra.
In the course of a larger 32 GHz GC survey a weak filament, G0.0870.087, with properties like the Arc was identified, which is described in this paper.
2 Observations and data reduction
The GC region was observed at 32 GHz with the Effelsberg 100-m telescope in several clear nights between 2000 and 2002. Details of the performance of the telescope at that frequency are listed in Table 1. 3C286 served as the primary calibrator at 32 GHz (Table 1). A particular problem is the low elevation of the GC region at Effelsberg, which limits observations within elevations between and about . This results in an observing time of about three hours a day. To guarantee pointing and flux density calibration at these low elevations all measurements were tied to the peak flux density of Sgr A (including Sgr A* and Sgr A West), which is only partly resolved by the beam. Its peak flux density for the Effelsberg beam was measured as 9.7 Jy (Morsi & Reich mor86 (1986)), which nicely fits to flux densities obtained from other high-frequency observations (Tsuboi et al. tsu88 (1988)).
Polarization data were collected with a three-feed system (MOD 1) installed in the secondary focus of the telescope. The two circular components of each feed were connected to two cooled HEMT receivers with 2 GHz bandwidth followed by an IF-polarimeter. The feeds were aligned along azimuth–direction with spacings of , 43 and 63, which requires mapping along the azimuth–direction. The complex extended emission in the GC region requires to make long scans of to to restore all components properly.
MOD 1 also receives total intensities, but the sensitivity is low. Since 1999 a second module (MOD 2) is available with a different technical concept to measure total intensities only. The circularly polarized components of different feeds were connected by waveguides into a magic-T. The signal difference between two feeds was obtained by a correlation of the magic-T outputs. The data were restored into a single beam map using the Emerson et al. (emer79 (1979)) algorithm. Adding all three spacings of MOD 2 a three times higher sensitivity for total intensities was achieved than with MOD 1 (Table 1). However, at the low elevations of the GC atmospheric emission reduces the nominal sensitivities significantly by extinction and increased system noise. MOD 2 has the same feed separations as MOD 1 and was installed with an offset of in elevation parallel to MOD 1 with the same azimuth offsets. Pointing errors of a few arcsec and small focal differences between individual coverages reduced the angular resolution to about .
| HPBW | |
|---|---|
| Maximum aperture efficiency | 23% |
| First sidelobe maxima/mean | 12 dB/17 dB |
| Instrumental polarization | |
| 1.8 | |
| Nominal rms-noise/sec: | |
| MOD 1: I/PI | 12/2.4 mJy/beam |
| MOD 2: I | 4 mJy/beam |
| Main calibrator: 3C286: | |
| S [Jy] | 2.1 |
| Percentage polarization [%] | 13 |
| Polarization angle [] | 33 |
3 Results and discussion

In Fig. 1 the total intensity map of G0.0870.087 at 32 GHz is shown including a section of the Arc. The rms–noise of the total intensities was measured to be about 10 mJy/beam. Polarization bars are superimposed. The rms–noise in polarized intensity is about 4 mJy/beam. G0.0870.087 is outstanding in polarization, while its total intensity is somewhat masked by large-scale emission. To enhance the contrast large-scale total intensity structures were partly removed by applying a background filtering technique (Sofue & Reich sof79 (1979)). The length of the filamentary structure G0.0870.087 is about corresponding to a projected length of about 6.2 pc for a GC distance of 8.5 kpc. The intensity along the filament’s ridge is about 70 mJy/beam with a percentage polarization of about 50%. G0.0870.87 is much shorter and about eight times weaker than the adjacent section of the Arc. Both structures run almost parallel deviating by the same inclination angle of about from Galactic latitude direction. G0.0870.087 indicates that the magnetic field direction traced by the Arc extends for a larger area.
We have searched for counterparts of G0.0870.087 in lower frequency maps. Single-dish data, which all have lower angular resolution, show no sign of G0.0870.087 in total power or polarization (e.g. Seiradakis et al. sei89 (1989)). This is not unexpected in view of the dominating large-scale emission. Also polarized emission is not visible due to strong depolarization in the GC direction, which even masks the much stronger polarized emission from the Arc largely.
The polarization angle of G0.0870.087 is in the range of to . In case of no Faraday rotation the magnetic field direction would be inclined by about or in respect to the filament’s axis. However, in the most likely case that the magnetic field is parallel to the filament the observed angle deviations imply RMs of the order of to . With the same argument the RMs along the Arc are between and . Such high RMs are unusual for Galactic emission structures, but rather similar to those reported previously for the Arc structure (Tsuboi et al. tsu87 (1987); Sofue et al. sof87 (1987); Yusef-Zadeh & Morris 1987b ).
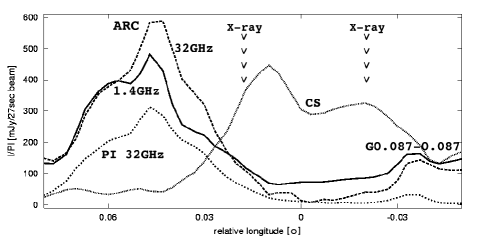
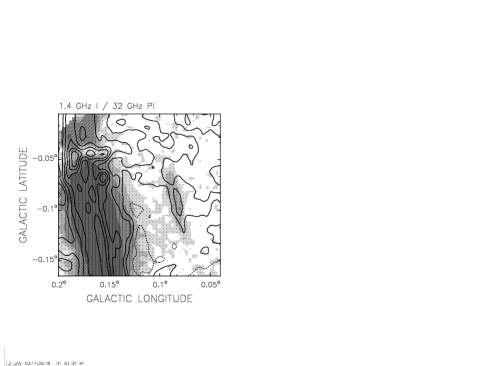
Weak filamentary total intensity emission of G0.0870.087 is identified in a 1.4 GHz VLA map published by Yusef-Zadeh & Morris (1987a ), where numerous weak filamentary structures are visible. This interferometer map does not include large-scale emission. Many filaments of similar strength are noted on high-resolution VLA maps at low frequencies (e.g. LaRosa et al. la00 (2000)), but none of them has a counterpart at 32 GHz like G0.0870.087 as expected for steep-spectrum emission. In Fig. 2 we show 1.4 GHz total intensities from the VLA (Yusef-Zadeh & Morris 1987a ) with 32 GHz polarized intensities superimposed for the same area as in Fig. 1 and at the same angular resolution of . The wide frequency interval and the rather similar total intensity levels in Fig. 1 and Fig. 2 indicate rather flat or slightly inverted spectra. From orthogonal cuts across the filaments (shown in Fig. 3) a spectral index of is calculated for G0.0870.087. Cuts across the Arc give a spectral index of for its maximum emission. These spectral indices are rather similar to those reported by Reich et al. (rei88 (1988)) from a multifrequency study of the Arc between 863 MHz and 43 GHz at angular resolution. The missing large-scale structures in the VLA map seem to have little influence on the spectral indices derived for distinct features like the Arc and G0.0870.087. A rather conservative estimate for possible scaling errors of up to 10% for each map result in a spectral index change of about . The similarity of spectral indices for the Arc and G0.0870.87 suggest that they were created in a similar process. Both structures are different from the majority of nonthermal filamentary structures in the GC region with steep spectra, which are too faint to show up in the present 32 GHz map.
The apparent interaction of the massive molecular cloud G0.110.11 with the Arc at its eastern periphery was discussed by Tsuboi et al. (tsu97 (1997)). The cloud has a size of about 7.5 pc and a mass of . It expands and rotates with 20 km/s and 4 km/s, respectively. Reich et al. (rei99 (2000)) rediscussed this interaction in view of new 150 GHz observations with the Nobeyama 45-m telescope, which show enhanced emission across the interacting areas. This excessive high-frequency emission traces the region of particle acceleration at the surface of G0.110.11. Magnetic reconnection is the likely acceleration process. G0.0870.087 is – like the Arc – seen towards the periphery of the molecular cloud, but on its western side. It is rather suggestive to assume that the same interaction process as for the Arc takes place. However, the much lower intensity of the G0.0870.087 filament suggests that the acceleration process is less efficient compared to the Arc. Figure 4 displays G0.0870.087 and the Arc at the western and eastern periphery of the molecular cloud G0.110.11.
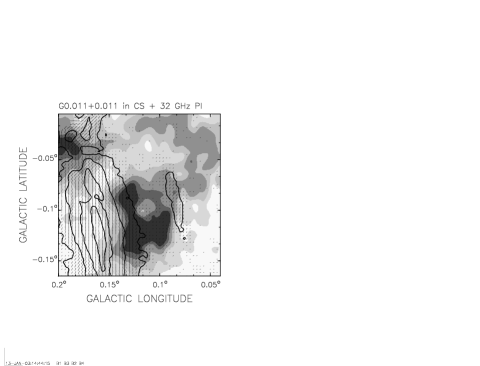
G0.0870.087 is barely resolved at 32 GHz. The unconvolved 1.4 GHz VLA total intensity data with an angular resolution of limit the intrinsic width of G0.0870.087 to about . The polarized intensity distribution (Fig. 1 and Fig. 2) indicates weak diffuse emission slightly above the noise level extending across G0.110.11. Thus it may also be possible that the molecular cloud is surrounded by synchrotron emission forming a thin torus with a thickness of about 1 pc. In such a case G0.0870.087 results from an edge-on view of the torus. Particle acceleration takes place at a larger area on the surface of the molecular cloud, where it is expanding in orthogonal direction to the ambient magnetic field direction. In this scenario the Arc is the exceptional structure, where additional conditions like magnetic field compression are needed to make the particle acceleration process more efficient than elsewhere on the surface of G0.110.11. The excessive brightness of the Arc compared to G0.0870.087 also indicates a larger magnetic field strength.
It has been shown observationally (Sofue et al. sof92 (1992), Reich et al. rei99 (2000)) that the Arc is a rather short-living structure not exceeding a lifetime of a few thousand years. Reich et al. (rei99 (2000)) argue for a non-pressure equilibrium between the Arc and G0.110.11 to avoid magnetic field strenghts exceeding 1 mGauss, which seem not to be compatible with the minimum lifetime of the Arc given by its physical length. A weaker magnetic field for G0.0870.087 implies a longer lifetime and a spectral turn-over will be shifted towards higher frequencies when compared to the Arc. However, its intrinsic faintness makes G0.0870.087 a difficult object to observe and its physical parameters are therefore not easy to constrain.
G0.110.11 is a very unusual molecular cloud in the GC region with a high kinetic temperature (Oka et al. Oka97 (1997)). CHANDRA observations of the G0.110.11 area revealed diffuse X-ray emission distributed across the cloud with enhanced filamentary emission along the edges of the molecular cloud in the direction parallel to the Arc and G0.0870.087 (Yusef-Zadeh et al. yus02 (2002), their Figs. 1 and 2). The X-ray filament near the Arc is rather strong, a weaker one is clearly visible towards G0.0870.087, as indicated in Fig. 3. These observations further support the interaction scenario between the Arc, G0.0870.087 and G0.110.11. Yusef-Zadeh et al. (yus02 (2002)) proposed that relativistic electrons, which likely are from the acceleration process, provide the heating of the molecular cloud. The unidentified EGRET source 3J17462851 (Hartman et al. hart99 (1999)) might also result from that interaction. This supports the previous suggestion of Pohl (pohl97 (1997)) that the GC -ray source coincides with the Arc rather than with the Sgr A complex.
4 Conclusions
A new filament G0.0870.087 with rather similar spectral and polarization characteristics compared to the GC Arc has been identified. It runs parallel to the Arc and is located at the western periphery of the same molecular cloud (G0.110.11) believed to be in interaction with the Arc. The same particle acceleration process, although of lower efficiency, seems to take place at G0.0870.087. It may be a single filament or results from a faint emission torus surrounding G0.110.11 seen edge-on. The orientation of the Arc and of G0.0870.087 with the same inclination of about supports the idea of the existence of a large scale poloidal field throughout the GC.
Acknowledgements.
I like to thank Ute Teuber for her long lasting successful work on the 32 GHz Effelsberg receivers.References
- (1) Emerson, D. T., Klein, U., & Haslam, C. G. T., 1979, A&A, 76, 92
- (2) Hartman, R. C., Bertsch, D. L., Bloom, S. D., et al. 1999, ApJS, 123, 79
- (3) Lesch, H., & Reich, W. 1992, A&A, 264, 493
- (4) Lang, C. C., Morris, M., & Echevarria, L. 1966, ApJ, 526, 727
- (5) LaRosa, T. N., Kassim, N. E., Lazio, T. J. W., & Hyman, S. D. 2000, AJ, 119, 207
- (6) LaRosa, T. N., Lazio, T. J. W., & Kassim, .E.. 2001, ApJ, 563, 163
- (7) Morsi, H.W., & Reich, W. 1986, A&A, 163, 313
- (8) Oka, T., Hasegawa, T., Sato, F., et al., 1997. In The Central Regions of the Galaxy and Galaxies, IAU Symp. 184, ed. Y. Sofue (Dordrecht: Kluwer), 103
- (9) Pohl, M. 1997, A&A, 317, 441
- (10) Pohl, M., Reich, W., & Schlickeiser, R. 1992, A&A, 262, 441
- (11) Reich, W., 1990. In Galactic and Intergalactic Magnetic Fields, IAU Symp. 140, ed. R. Beck, P. P. Kronberg, & R. Wielebinski (Dordrecht: Kluwer), 369
- (12) Reich, W., Sofue Y., Wielebinski R., & Seiradakis J. H. 1988, A&A, 191, 303
- (13) Reich, W., Sofue, Y., & Matsuo, H. 2000, PASJ, 52, 355
- (14) Seiradakis, J. H., Reich, W., Wielebinski, R., Lasenby, A. N., & Yusef-Zadeh, F. 1989, AAS, 81, 291
- (15) Sofue Y., & Reich W. 1979 A&AS, 38, 251
- (16) Sofue, Y., Reich, W., Inoue, M., & Seiradakis, J. H. 1987, PASJ, 39, 359
- (17) Sofue Y., Murata, Y., & Reich W. 1992, PASJ, 44, 367
- (18) Tsuboi, M., Inoue, M., Handa, T., et al., 1987, AJ, 92, 818
- (19) Tsuboi, M., Handa, T., Inoue, M., Ukita, N., & Takano, T. 1988, PASJ, 40, 665
- (20) Tsuboi, M., Ukita, N., & Handa, T. 1997, ApJ, 481, 263
- (21) Yusef-Zadeh, F., & Morris, M. 1987a, AJ, 94, 1178
- (22) Yusef-Zadeh, F., & Morris, M. 1987b, ApJ, 322, 721
- (23) Yusef-Zadeh, F., Law, C., & Wardle, M. 2002, ApJ, 568, L121