Metallicity effects in Photon Dominated Regions: Clumpy clouds
Abstract
Several galaxies, such as dwarfs and Irregulars as well as outer galactic clouds have low metallicity. At low metallicities a reduction in the amount of dust and heavy elements plays a significant role on the chemistry as well as the heating and cooling of the gas in the molecular regions, called as Photon Dominated Regions (PDRs). We present here the effects of reduced metallicity in PDRs and study the important PDR cooling lines ([CII], [CI] and CO). Moreover many observational evidences suggest that molecular clouds are clumpy. We model the molecular emission from galaxies incorporating a mass spectrum of clumps. We also compare our results with the semi-analytical results obtained by Bolatto et al. (1999).
keywords:
ISM: molecules – ISM: structure – ISM: clouds1 Introduction
Photon Dominated Regions are predominantly molecular and atomic regions where the physical and chemical processes are dominated by UV radiation (cf. Hollenbach & Tielens, 1997, 1999). The molecular clouds in the vicinity of the newly formed stars is heated by the FUV photons in the energy range from about 6 to 13.6eV. These clouds cool through the atomic and molecular spectral lines, such as [CII]158, [OI]63,146, [CI]609,370 and the milli-metric and sub-mm CO rotational lines. Plane parallel and spherical models of PDRs have been constructed to understand the physical and chemical characteristics of these regions (e.g., Kaufman et al., 1999; Köster et al., 1994; Le Bourlot et al., 1993; Sternberg & Dalgarno 1995; Störzer et al., 1996; Tielens & Hollenbach 1985). However there are other important factors which affect the UV absorption and scattering as well as the basic heating and cooling processes in PDRs.
Several galaxies such as Dwarf galaxies, Irregular galaxies, the Large and Small Magellenic Clouds have low metallicity (cf. Wilson 1995). A radial gradient in metallicity of molecular clouds is found in the Milky Way and several other nearby galaxies (e.g., Arimoto et al., 1996). These low metallicity systems have much higher [CII]/CO and [CI]/CO line ratios as compared to the galactic value (e.g. Bolatto et al., 2000; Madden 2000). This suggests that the effects of metallicity should be considered while interpreting the molecular and atomic spectral line observations of these sources. Since the important surface coolant of the PDRs, the [CII]158m emission, is strongly affected by the metallicity factor, we study the effects of metallicity in PDRs. In addition, low metallicity PDR models would also help us to understand the star forming regions in Dwarf galaxies which resemble the primordial galaxies.
Additionally, observations of edge-on PDR have suggested that the molecular clouds are clumpy, and the UV radiation can penetrate deep inside the clouds (cf. Stutzki et al., 1988; Boissé 1990). This suggests that a simple single component model may not be sufficient to explain the observed features. We also include a mass spectrum of clumps to understand the cooling lines of PDRs from low metallicity galaxies.
2 Metallicity effects
Low metallicity systems have a lower, dust to gas ratio and heavy elemental abundances as compared to the galactic ISM. This reduction in the amount of dust grains affects, the absorption of UV radiation, heating of gas by photo electric emission from dust, formation of H2 on the dust grains and the cooling of the gas through atomic and molecular lines. In addition, the chemistry is also affected by the reduction in dust and heavy elements (van Dishoeck & Black 1988; Lequeux et al., 1994). We use the self-consistent spherical PDR model of Störzer et al. (1996) to study the metallicity effects. We scale the dust dependent parameters and the abundance of heavy elements with the metallicity factor, Z, in our PDR calculations.
The variation of the temperature at the surface of the PDR clumps with the incident UV field is plotted in figure 1, for a clump of mass, M=1M⊙ and density, n=10. The UV field, , is expressed in units of mean UV field of Draine (1978). It is seen from the figure that at high UV fields the temperature is proportional to metallicity, whereas at low UV fields there is no significant change in the surface temperature.
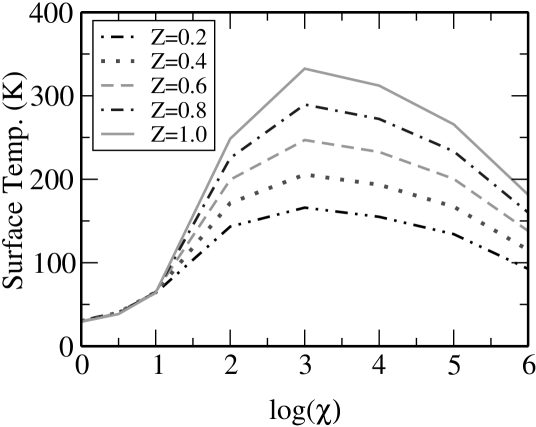
This correlation can be understood analytically by balancing the dominant heating and cooling processes. In the case of PDRs exposed to high UV fields grain photo-electric emission (PE) dominates the heating. The photo electric heating rate given by Bakes & Tielens (1994) is
| (1) |
where Z is the metallicity factor.
The cooling is dominated by fine structure [OI] emission, gas-grain collisions and fine-structure [CII] emission. The cooling rate can be written as where is the escape probability, is the transition probability and number of atoms at level and is the corresponding frequency of radiation.
Following Hollenbach & McKee (1979), for the population of the first level of the OI atom, the cooling rate of [OI]63m can be written as,
| (2) |
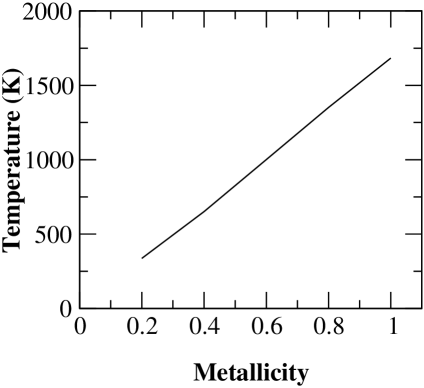
Although eqns. 1 and 2 show a similar dependence with metallicity, the grain heating rate has an additional dependence on metallicity through the charge state of the grains. The charge state of the grains is expressed as which depends on the availability of electrons for recombination. The main source of electrons at high UV fields is the ionisation of CI. Since at the surface almost all of the CI is ionised, the electron density . With this assumption the heating rate, decreases with decreasing whereas the cooling rate, remains constant. The equilibrium temperature obtained by solving eqns. 1 and 2 decreases as the metallicity decreases (cf. figure 2) as seen in our PDR calculations.
3 Clumpy PDR model
In our clumpy model, the molecular cloud is modelled as being composed of many spherical clumps of mass spectrum of the form, We use (e.g. Kramer et al., 1998). We assume that the turbulent velocity dispersion of the cloud is larger than the intrinsic line width of each clump. Thus the clumps do not interact radiatively and the total intensity of a spectral line from the cloud can be written as,
The beam filling factor of each clump is ) where is the solid angle of the clump of mass and is the beam solid angle. The fraction of the clumps within the beam is given by .
By scaling the mass with ()
where is the beam filling factor, and . Although the total intensity depends on the scaling constant and the beam filling factors, the line ratio between any two spectral lines depends only on and .
4 Clumpy clouds at low metallicity
The observations of [CII] and [CI] emission from low metal galaxies have been modelled by Bolatto et al. (1999), assuming that the size of the CII region scales inversely with metallicity. It is also assumed that the size of the CI region remains between two limiting scenarios of, an inverse dependence and no variation with metallicity. Our spherical PDR model calculations based on the model of Störzer et al. (1996) show that the size of the CII layer is indeed inversely proportional to the metallicity factor Z. However the size of the CI region shows very weak dependence at low Z and a roughly inverse dependence at high Z for a typical spherical clump of density, .
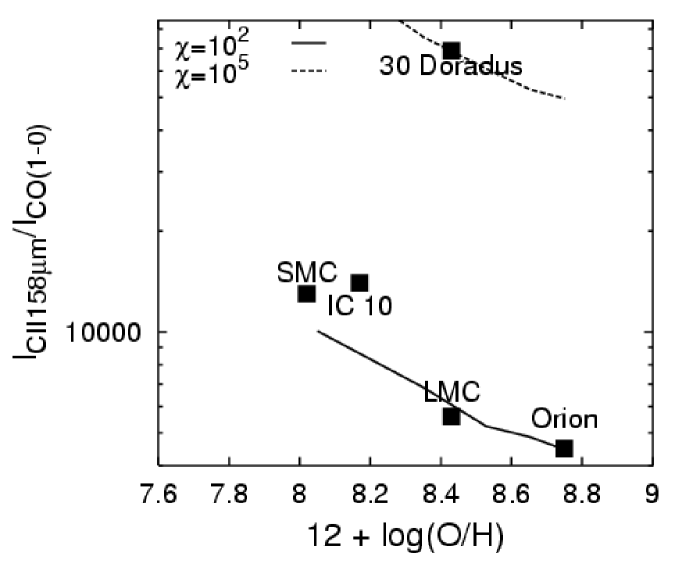
The intensity ratio /, observed in many nearby low metal galaxies, show a power law dependence with metallicity. This dependence has been predicted using a semi-analytical clumpy model by Bolatto et al. (1999). We use our clumpy model explained in section 3 to study the metallicity dependence of this line ratio. The observed ratios of nearby galaxies can be well represented by a clumpy model of density , exposed to a UV field of as shown in figure 3. The higher observed ratio for the 30 Doradus region can be explained by a similar clumpy model, but exposed to an UV field of . These results compare well with the results shown by the semi-analytical model of Bolatto et al. (1999). This trend suggests that at low metallicities CII is a tracer of molecular hydrogen rather than CO. However the observed variation of [CI]/CO line ratio with metallicity is steeper than the model prediction. This is most likely due to large [CI] line intensities predicted by the PDR models and requires further investigation.
Acknowledgements.
The research presented here is supported by the Deutsche Forschungsgemeinschaft (DFG) via Grant SFB 494.References
- [] Arimoto N., Sofue Y., & Tsujimoto T. 1996, PASJ, 48, 275
- [] Bakes & Tielens 1994
- [] Boissé P. 1990, A&A, 228, 483
- [] Bolatto A.D., Jackson J.M., Ingalls J.G. 1999, ApJ, 513, 275
- [] Bolatto A.D., et al., 2000, ApJ, 541, 17
- [] Draine B.T. 1978, ApJS, 36, 595
- [] Hollenach & McKee 1979
- [] Hollenbach D.J., Tielens A.G.G.M. 1999, Rev.Mod.Phys, 71,173
- [] Hollenbach D.J., Tielens A.G.G.M. 1997 ARA&A, 35, 179
- [] Kaufman M.J., et al., 1999, ApJ, 527, 795
- [] Köster et al., 1994, A&A 284, 545
- [] Kramer, C., et al., 1998, A&A, 329, 249
- [] Le Bourlot, J., et al., 1993, A&A, 267, 233
- [] Lequeux, J., et al., 1994, A&A, 292, 371
- [] Madden S.C. 2000, NewAR, 44, 249
- [] Sternberg A. & Dalgarno A. 1995, ApJS, 99, 565
- [] Störzer H., Stutzki J. & Sternberg A. 1996, A&A, 310, 592
- [] Stutzki J., et al., 1988, ApJ, 332, 379
- [] Tielens A.G.G.M., Hollenbach D. 1985, ApJ, 291, 722
- [] van Dishoeck, E. F. & Black, J. H. 1988, ApJ, 334, 771
- [] Wilson C. D. 1995, ApJ,448, L97