STELIB: a library of stellar spectra at R2000 ††thanks: Based on observations collected with the Jacobus Kaptein Telescope, (owned and operated jointly by the Particle Physics and Astronomy Research Council of the United Kingdom, the Nederlandse Organisatie voor Wetenschappelijk Onderzoek of the Netherlands and the Instituto de Astrof sica de Canarias of Spain and located in the Spanish Observatorio del Roque de Los Muchachos on La Palma which is operated by the Instituto de Astrof sica de Canarias), the 2.3m telescope of the Australian National University at Siding Spring, Australia, and the VLT-UT1 Antu Telescope (ESO).
We present STELIB, a new spectroscopic stellar library, available at http://webast.ast.obs-mip.fr/stelib. STELIB consists of an homogeneous library of 249 stellar spectra in the visible range (3200 to 9500Å), with an intermediate spectral resolution (3Å) and sampling (1Å). This library includes stars of various spectral types and luminosity classes, spanning a relatively wide range in metallicity. The spectral resolution, wavelength and spectral type coverage of this library represents a substantial improvement over previous libraries used in population synthesis models. The overall absolute photometric uncertainty is 3%.
Key Words.:
atlases - stars: fundamental parameters - galaxies: stellar content.1 Introduction
Evolutionary population synthesis models that describe the chemical and spectral
evolution of stellar systems in detail are fundamental tools in the analysis of
observations of both nearby and distant galaxies (e.g. Guiderdoni &
Rocca-Volmerange Guiderdoni (1987), Buzzoni Buzzoni (1989), Bruzual & Charlot
Bruzual (1993), Fioc & Rocca-Volmerange Fioc (1997)). They are needed to
determine the stellar populations in a variety of systems, spanning a wide range
of metallicities, from early type galaxies and spiral bulges to star forming
galaxies at different redshifts.
The possibility of building detailed spectro-chemical evolution models of stellar
populations using evolutionary synthesis techniques is limited by the lack of
comprehensive empirical libraries of stellar spectra, comprising stars with
metallicities ranging from well below solar ([Fe/H] from -2 to -1) to above solar
([Fe/H]0). Direct inversions of galaxy spectra (Pelat Pelat (1997), Boisson
et al. Boisson (2000)) are also handicaped by this shortage. Current synthesis
models based on empirical stellar data are mostly restricted to solar metallicity.
In the visible range, they are largely based on the spectral atlas of Gunn &
Stryker (Gunn (1983)) or the more recent (and not completely independent) atlas
of Pickles (Pickles (1998)).
The use of theoretical stellar spectra such as Kurucz’ (Kurucz (1992)) instead of
empirical libraries is a priori preferable, because they can be computed
for a dense grid of fundamental parameters (metallicity, gravity, effective
temperatures), thus avoiding interpolation errors and calibrations. However,
the resulting synthetic spectra do not in general reproduce the spectral features
observed in composite stellar populations with the same degree of accuracy as
models based solely on observed stellar spectra. Methods to achieve photometric
compatibility between models and data have been developed (Lejeune et al.
Lejeune97 (1997)), and extended and homogeneous libraries of theoretical spectra
covering the bulk of the HR-diagram and a wide range of metallicities are now
available (Lejeune et al. Lejeune98 (1998), Westera et al. Westera (2002)). While
this represents a major improvement, such libraries still suffer from the limited
resolution (20Å in the optical). The determination of stellar
populations in galaxies up to z1 through optical spectroscopy requires
spectral synthesis capabilities over a broad wavelength range (3000Å to 1,m). A minimum spectral resolution of a few Å is necessary to
obtain constraints on age, metallicity and global stellar kinematics from
absorption lines. The libraries presently available with a suitable spectral
resolution (1-3Å) are often limited to a narrow wavelength range (Jones
Jones (1997), Cenarro et al. Cenarro (2001)) or are restricted to particular
spectral types (Montes et al. Montes (1999)).
The main objective of our stellar library STELIB is to provide a homogeneous set
of stellar spectra in the visible range (3200 to 9500Å), with a relatively
high spectral resolution (3Å) and sampling (1Å). This library
includes stars of most spectral types and luminosity classes and spans a
relatively wide range in metallicity. Most of the stars in our sample have
measured metallicities.
The outline of the paper is the following. In Section 2 we present the
observations. Section 3 describes the selection criteria and the
overall characteristics of the STELIB sample of stars. The data reduction
process is summarized in Section 4. Section 5 presents the
content of the library STELIB, presently available through the web. In Section
6 we show some particular applications of STELIB to population
synthesis studies, and we compare the performances of this library to previous
results. The conclusions of this paper are given in Section 7.
2 Observations
The data were obtained during two runs, one at the 1m Jacobus Kaptein Telescope (JKT), Roque de los Muchachos Observatory, La Palma, Canary Islands, Spain, between 1994 March 28 and April 4, and a second one at the 2.3m of the Australian National University at Siding Spring (SSO), Australia, between 1994 December 25 and 31. On JKT, we used the Richardson-Brealey Spectrograph with the 600 lines/mm grating. The detector was a EEV7 12421152 CCD with a 22.5m pixel. The slit width was 1.5 arcsec. This configuration gives a dispersion of 1.7Å/pixel and a resolution of about 3Å FWHM. We made use of both blue and red optics. With the blue optics, spectra were alternatively obtained with 2 grating angle settings: 18°giving a wavelength range of 2900Å-5100Å on the CCD (useful data start at 3200Å because of atmospheric cutoff) and 21°giving the wavelength range 4300Å-6500Å. With the red optics the grating angle settings were 24°and 27°for the wavelength ranges 6000Å-8200Å and 7600Å-9900Å, respectively. To maximize the efficiency, and to improve the calibration, each night was devoted to a single grating angle setting: changing the grating angle was done manually by opening the spectrograph. March 29 was an exception because 2 settings with the red optics were used (see Table 1 for details). Again to save time, the spectrograph was not rotated to align the slit on the paralactic angle, since it should have to be done manually on the telescope for each pointing. This should have no consequence because of the relatively short wavelength range of each individual spectra, the slit width of 1.5 arcsec, and also because we observed as close to the meridian as possible (the slit was set vertical when at meridian). During the JKT run about 1000 spectra were obtained on about 200 stars.
| night | grating | wavelength range |
|---|---|---|
| 1994 | angle | |
| March 28 | 24° | 6000Å-8200Å |
| March 29 | 24°+27° | 6000Å-8200Å+7600Å-9900Å |
| March 30 | 21° | 4300Å-6500Å |
| March 31 | 18° | 3200Å-5100Å |
| April 1 | 21° | 4300Å-6500Å |
| April 2 | 24° | 6000Å-8200Å |
| April 3 | 27° | 7600Å-9900Å |
| April 4 | 18° | 3200Å-5100Å |
The spectrograph used at the Siding Spring 2.3m telescope was the Double Beam Spectrograph. This instrument has two beams split by a dichroic slide. The detectors were 2 10241024 CCD’s, the blue channel CCD is UV coated. The grating used was also a 600 lines/mm giving a dispersion of 1.1Å/pixel (15 m pixels). The slit width was 2 arcsec on the sky. The spectral resolution was less than 3 pixels FWHM with good focus, so about 3Å. The mode “vertical slit on sky” was used. Three configurations were defined:
-
•
Configuration 1: wavelength range on blue channel: 3500-4500Å; on red channel: 6470-7550Å.
-
•
Configuration 2: wavelength range on blue channel: 4475-5550Å; on red channel: 7500-8570Å.
-
•
Configuration 3: wavelength range on blue channel: 5510-6550Å; on red channel: 8530-9650Å.
Table 2 summarizes the configurations used during this run. 36 stars were obtained at Siding Spring. They were selected mainly in the Large Magellanic Cloud or among local metal poor stars, in order to improve the coverage of stellar parameter space. Some Wolf Rayet stars were also observed.
| night 1994 | config. | wavelength ranges | |
|---|---|---|---|
| number | blue channel | red channel | |
| December 25 | 1 | 3500Å-4500Å | 6470Å-7550Å |
| December 26 | 2 | 4475Å-5550Å | 7500Å-8570Å |
| December 27 | 3 | 5510Å-6550Å | 8530Å-9650Å |
| December 28 | 1 | 3500Å-4500Å | 6470Å-7550Å |
| December 29 | 2 | 4475Å-5550Å | 7500Å-8570Å |
| December 30 | 3 | 5510Å-6550Å | 8530Å-9650Å |
| December 31 | 1 | 3500Å-4500Å | 6470Å-7550Å |

 |
 |
 |
 |
 |
 |

3 Star selection
Most stars were originally selected from the catalogue of Cayrel de Strobel et
al.(Cayrel92 (1992)) according to the value of [Fe/H]. Additional samples of 62 and
45 stars were selected to include targets with either near-IR spectra (from
Lançon & Rocca-Volmerange Lancon92 (1992)) and/or UV data (from IUE)
respectively.
The Tables 5 to 10 give the list of the 249 stars included in
the library. Most of the atmospheric parameters (Teff, log(g), [Fe/H]) listed
in Tables 5 to 10 come from the 2 latest editions of the
Catalogue of [Fe/H] determinations (Cayrel de Strobel et al. Cayrel97 (1997),
Cayrel01 (2001)). This compilation was complemented by accurate Teff listed
in Blackwell & Lynas-Gray (Blackwell (1998)), di Benedetto (diBenedetto (1998))
and Alonso et al. (Alonso96 (1996), Alonso99 (1999)). We have also used the V-K
colour index, when available, calibrated into Teff using the formulae of
Alonso et al. (Alonso96 (1996), Alonso99 (1999)). Multiple determinations of
atmospheric parameters for the same star were averaged, giving more weight to the
most recent ones. Several stars with unknown atmospheric parameters were also
part of the ELODIE database (Prugniel & Soubiran Prugniel (2001)). In that case
we give the parameters determined by the TGMET method (Katz et al. Katz (1998)).
Absolute magnitudes M were derived from the Hipparcos parallax and
TYCHO2 VT apparent magnitude, transformed into V Johnson band (Høg et al.
Hog (2000)) and corrected with Av measured on the spectra. M is
only given for stars having a relative parallax error lower than 30%.
Uncertainties correspond to one errors on parallaxes and V magnitudes.
Most of the stars in the library have accurate UBV photometry available from the
Lausanne ”General Catalogue of Photometric Data” compiled by Mermilliod et al.
(Mermilliod (1997)) and about half of them have R and I photometry.
Fig. 1 shows the U-B vs B-V diagram corrected for the interstellar
extinction with AV/EB-V=3.1, EU-V/EB-V=1.59,
ER-V/EB-V=-0.88 and EI-V/EB-V = -1.60. The relations
Teff versus color indices are displayed in Fig. 2. Finally, HR-type
diagrams are shown in Fig. 3. In the log(g)/Teff diagram and
MV/Teff diagrams, evolutionary tracks from the Geneva models (Schaller et
al. Schaller (1992)) are displayed for solar metallicity. In the diagram MV
versus Teff and MV versus B-V, MV are from the Hipparcos catalog
(Perryman et al., Perryman (1997)). Fig. 4 shows the distribution of
[Fe/H] as a function of Teff.
4 Data reduction
The basic data reduction was performed with iraf111IRAF is distributed by
the National Optical Astronomy Observatories, USA, which are operated by the
Association of Universities for Research in Astronomy, Inc., under cooperative
agreement with the National Science Foundation, USA.
except for the flux calibration of JKT data which appeared to demand non-standard
procedures.
The wavelength calibration was done thanks to the acquisition of arc spectra from
a Cu-Ne lamp for the JKT data and from He-Ar, Ar-Ne and Cu-Ar lamps for the SSO
data. The typical number of lines used was 30 to 50. The rms of the residuals is
of the order of 0.1 Å.
| star | num. of | rms | reference |
| spectra | |||
| HR2422 | 19 | 0.058 | Whiteoak (Whiteoak (1966)) |
| HR3454, Hya | 31 | 0.024 | Hamuy et al., Hamuy92 (1992), |
| Hamuy94 (1994) | |||
| HR4963, Vir | 29 | 0.020 | Hamuy et al., Hamuy92 (1992), |
| Hamuy94 (1994), Hayes Hayes70 (1970) | |||
| HR3982, Regulus | 27 | 0.020 | Cochran (Cochran (1981)), |
| Hayes Hayes70 (1970) | |||
| HR5511, 109 Vir | 17 | 0.036 | Cochran (Cochran (1981)), |
| Johnson (Johnson (1980)) | |||
| HR7001, Vega | 11 | 0.022 | Hayes, Hayes (1985) |
| HR7589 | 15 | 0.041 | Whiteoak (Whiteoak (1966)) |
Table 3 gives the list of the standard stars observed at JKT. In
average, 18 spectra of standard stars were obtained each night, enough to allow
checking for atmospheric extinction. The examination of these spectra revealed
strongly varying atmospheric extinction during the observations. Our
interpretation is that the strong wind blowing from east was carrying dust from
the Sahara desert. But we cannot exclude that it comes from differential
atmospheric loss in the JKT narrow slit.
As a consequence, the direct use of the standard stars spectra, with a standard
procedure to flux calibrate the spectra was not feasible. We then built a
procedure to take into account various factors which affect the atmospheric
extinction both in its absolute value and its dependence with wavelength.
The normal atmospheric extinction is modeled by the mean atmospheric extinction
curve versus wavelength and the airmass at time of observation. The ”abnormal”
extinction, possibly due to dust, is likely to change rapidly during one night.
We calibrated this effect by using any observed star as a photometric standard
star. The UBVRI photometry of most of our program stars are available in the
Lausanne database (http://obswww.unige.ch/gcpd/gcpd.html) (Mermilliod et al.,
Mermilliod (1997)). However to do this, it has been necessary to take the
variation of seeing into account. The seeing, measured on each spectrum from the
profile of the star image along the slit, appeared to change significantly during
the nights, typically between 0.6″and 1.5″. The light lost outside
the slit differs as the seeing varies. To model it, we took into account the
stellar profile and the slit width. The detailed modelling process was performed
individually for each star. This operation gives an absolute mean value over the
wavelength for a given grating angle setting to scale the spectra. Then, the
observations of spectrophotometric standard stars were used to analyse the
wavelength dependence of the additionnal extinction.


Fig. 5 and 6 show the comparison of the calibrated standard
stars spectra with published SED. The spectrum of Vega (Fig. 5) was
obtained only in the shortest wavelenth setting because of its brightness. The
comparison for the other standards are shown in Fig. 6. The rms of
difference between calibrated spectra of standard stars and published spectra,
expressed in magnitude, are given in Table 3. They are computed avoiding
the strong absorption lines where the difference of wavelength sampling
introduces large dispersions.These rms are between 0.02 and 0.04 magnitude.
An exception is HR2422 for which the rms is 0.058.
The SSO spectra were reduced using the standard procedures for flux calibration.
Table 4 lists the standard stars used. Two target stars and one standard
star observed in this run were also observed at JKT. We used these stars as an
additional check on the reliability of the complex flux calibration procedure
applied to JKT data. A good agreement was obtained between the two independent
set of spectra. Fig. 7 shows the comparison of the calibrated standard
stars spectra with published SED. As for the JKT standard stars, the rms of
difference between calibrated spectra of standard stars and published spectra,
are given in Table 4. They are also computed avoiding the strong
absorption lines. The rms have similar values between 0.02 and 0.04 magnitude.
One standard star, Hya, has been observed during both runs. The rms of the
difference is 0.031 magnitude, of the same order than the rms of the difference
between observed and published spectra. Thus, we can consider that 0.03 magnitude
is the typical absolute photometric uncertainty of the library. In addition, the
detailed comparison between the synthetic photometry derived from the STELIB
library and the Lausanne database is presented and discused in Appendix A.
Tables 15 to 18 provide with the UVBRI synthetic photometry
for STELIB stars.
| star | rms | reference |
| (mags) | ||
| HR 3454, Hya | 0.024 | Hamuy et al., Hamuy92 (1992), Hamuy94 (1994) |
| HR 718, Cet | 0.027 | Hamuy et al., Hamuy92 (1992), Hamuy94 (1994) |
| Feige 110 | 0.043 | Oke,Oke (1990) , Hamuy et al., |
| Hamuy92 (1992), Hamuy94 (1994) | ||
| HR 4468, Crt | 0.031 | Hamuy et al., Hamuy92 (1992), Hamuy94 (1994) |
| HR 1544, Ori | 0.024 | Hamuy et al., Hamuy92 (1992), Hamuy94 (1994) |
| Star | RA 2000 | DEC 2000 | spectr. | Teff | log(g) | [Fe/H] | Mv | Av | identification |
|---|---|---|---|---|---|---|---|---|---|
| HD 2857 | 00:31:53.80 | -05:15:42.3 | A2 | 7611 | 2.67 | -1.51 | 0.25 | - | |
| HD 5820 | 00:59:49.68 | +06:28:59.6 | M2III | 0.70 | V* WW Psc | ||||
| HD 6268 | 01:03:18.19 | -27:52:49.7 | G0III | 4712 | 1.13 | -2.41 | 0.60 | - | |
| HD 9138 | 01:30:10.94 | +06:08:38.2 | K4III | 4061 | 1.90 | -0.39 | 0.00 | Psc | |
| HD 12479 | 02:02:35.08 | +13:28:36.2 | M2III | 0.00 | - | ||||
| HD 15318 | 02:28:09.52 | +08:27:36.3 | B9III | 11300 | 0.08 | Cet HR718 | |||
| HD 18191 | 02:55:48.50 | +18:19:54.0 | M6IIIvar | 3450 | 0.50 | -0.01 | 0.00 | Ari V* RZ Ari | |
| HD 21581 | 03:28:54.45 | -00:25:02.4 | G0 | 4885 | 2.12 | -1.67 | 0.00 | - | |
| HD 26630 | 04:14:53.86 | +48:24:33.7 | G0Ib | 5345 | 1.42 | -0.11 | 0.6 | . Per | |
| HD 29574 | 04:38:55.74 | -13:20:47.7 | G8/K0IIIw. | 4183 | 0.39 | -1.89 | 1.0 | V* HP Eri | |
| HD 30739 | 04:50:36.72 | +08:54:00.9 | A1Vn | 0.10 | Ori HR 1544 | ||||
| HD 268623 | 04:52:11 | -66:42:08 | B2Ia | 0.00 | - | ||||
| HD 268749 | 04:53:29 | -69:24:34 | B7Iab | 0.00 | - | ||||
| HD 30614 | 04:54:03.01 | +66:20:33.6 | O9.5Iae | 31888 | 3.02 | 0.30 | 0.79 | Cam | |
| HD 32034 | 04:55:11 | -67:10:10 | B9Ia | 8262 | 1.29 | -0.80 | 0.39 | - | |
| HD 268819 | 04:55:32.46 | -69:57:45.1 | F6 | 0.00 | - | ||||
| HD 33133 | 05:03:08 | -66:40:42 | WN | 0.00 | LMC FD 12 | ||||
| HD 33579 | 05:05:55.51 | -67:53:10.9 | A3Ia | 7694 | 0.84 | -0.23 | 0.56 | - | |
| HD 32537 | 05:06:40.66 | +51:35:53.3 | F0V | 6978 | 4.07 | -0.23 | 0.4 | 12 Cam V* BM Cam | |
| HD 32923 | 05:07:26.68 | +18:38:42.0 | G4V | 5727 | 3.98 | -0.20 | 0.3 | 104 Tau | |
| HD 271163 | 05:18:52 | -65:41:22 | B3Ia | 0.00 | - | ||||
| HD 34411 | 05:19:08.08 | +40:06:02.4 | G0V | 5845 | 4.13 | 0.01 | 0.00 | Aur | |
| HD 34816 | 05:19:34.53 | -13:10:36.4 | B0.5IV | 28724 | 4.20 | -0.13 | 0.02 | Lep | |
| HD 271182 | 05:21:01.71 | -65:48:02.4 | F8… | 6000 | 0.50 | -0.53 | 0.00 | - | |
| HD 35497 | 05:26:17.50 | +28:36:28.3 | B7III | 13429 | 3.80 | -0.10 | 0.03 | Tau | |
| HD 269687 | 05:31:25 | -69:05:35 | B0e | 0.00 | - | ||||
| HD 269697 | 05:31:38.42 | -67:28:11.6 | F5Ia | 0.00 | - | ||||
| HD 269698 | 05:31:42 | -67:38:06 | O5e | 0.00 | - | ||||
| HD 36512 | 05:31:55.86 | -07:18:05.5 | B0V | 32200 | 4.13 | 0.25 | 0.4 | Ori | |
| HD 36673 | 05:32:43.81 | -17:49:20.3 | F0Ib | 7276 | 1.31 | -0.02 | 0.7 | Lep | |
| HD 37680 | 05:34:18 | -69:45:00 | WC | 0.00 | FD 46 | ||||
| HD 269781 | 05:34:22.47 | -67:01:23.6 | A0Iae | 0.00 | - | ||||
| HD 38282 | 05:38:53 | -69:02:01 | WN | 0.00 | FD 70 | ||||
| HD 37828 | 05:40:54.62 | -11:11:59.8 | K0 | 4335 | 1.36 | -1.39 | 0.00 | - | |
| HD 37394 | 05:41:20.33 | +53:28:56.4 | K1V | 5194 | 4.12 | -0.20 | 0.7 | - | |
| HD 38247 | 05:45:11.52 | +18:42:15.7 | G8Iab | 4755 | 1.70 | 0.04 | 2.0 | - | |
| HD 39587 | 05:54:23.08 | +20:16:35.1 | G0V | 5915 | 4.39 | -0.02 | 0.00 | Ori | |
| HD 39801 | 05:55:10.29 | +07:24:25.3 | M2Ib | 3540 | 0.00 | 0.03 | 0.00 | Ori V* | |
| HD 39866 | 05:56:33.77 | +28:56:32.2 | A2II | 10080 | 1.95 | 0.01 | 0.80 | - | |
| HD 39949 | 05:57:05.56 | +27:19:00.1 | G2Ib | 5250 | 1.10 | -0.16 | 0.5 | - | |
| HD 40111 | 05:57:59.66 | +25:57:14.1 | B1Ib | 0.39 | 139 Tau | ||||
| HD 41667 | 06:05:03.64 | -32:59:39.3 | G8V | 4605 | 1.88 | -1.16 | 0.00 | - |
| Star | RA 2000 | DEC 2000 | spectr. | Teff | log(g) | [Fe/H] | Mv | Av | identification |
|---|---|---|---|---|---|---|---|---|---|
| HD 41593 | 06:06:40.55 | +15:32:32.5 | K0V | 5305 | 4.49 | 0.07 | 0.00 | V* V1386 Ori | |
| HD 41636 | 06:08:23.14 | +41:03:21.0 | G9III | 4755 | 1.70 | -0.30 | 0.00 | - | |
| HD 42454 | 06:12:05.49 | +29:29:31.8 | G2Ib | 5250 | 1.10 | -0.05 | 1.2 | - | |
| HD 42543 | 06:12:19.10 | +22:54:30.7 | M1Ia-ab | 3789 | 0.00 | -0.42 | 1.0 | 6 Gem V* BU Gem | |
| HD 43153 | 06:15:25.13 | +16:08:35.5 | B7V | 13263 | 4.30 | -0.50 | 0.15 | 72 Ori | |
| HD 45829 | 06:30:02.29 | +07:55:16.0 | K0Iab | 4435 | 0.20 | -0.02 | 1.0 | - | |
| HD 46223 | 06:32:09.31 | +04:49:24.7 | O5e | 49300 | 3.95 | 2.1 | - | ||
| HD 47129 | 06:37:24.04 | +06:08:07.4 | O8V+… | 1.13 | HR2422 | ||||
| HD 47839 | 06:40:58.66 | +09:53:44.7 | O7Ve | 39500 | 3.71 | 0.26 | 15 Mon V* S Mon | ||
| HD 47731 | 06:41:20.90 | +28:11:47.9 | G5Ib | 4990 | 1.00 | -0.16 | 0.00 | 25 Gem | |
| HD 48329 | 06:43:55.93 | +25:07:52.2 | G8Ib | 4384 | 0.76 | 0.06 | 0.00 | Gem | |
| HD 48682 | 06:46:44.34 | +43:34:37.3 | G0V | 5727 | 0.15 | 0.3 | Aur A | ||
| HD 48682B | 06:46:46 | +43:35:03 | M0V | 0.00 | Aur B | ||||
| HD 49933 | 06:50:49.82 | -00:32:25.5 | F2V | 6538 | 4.32 | -0.59 | 0.2 | - | |
| HD 50420 | 06:55:14.66 | +43:54:36.2 | A9III | 7200 | 3.28 | 0.04 | 0.75 | V* V352 Aur | |
| HD 52005 | 07:00:15.82 | +16:04:44.4 | K4Iab: | 4271 | 0.80 | -0.22 | 0.00 | 41 Gem | |
| HD 52973 | 07:04:06.54 | +20:34:13.1 | G3Ibvar | 5604 | 1.77 | 0.25 | 0.4 | Gem V* | |
| HD 53929 | 07:07:06.48 | +04:54:38.2 | B9.5III | 14011 | 3.63 | 0.29 | 0.00 | - | |
| HD 60778 | 07:36:11.79 | -00:08:14.9 | A1V | 8416 | 3.30 | -0.50 | 0.28 | - | |
| HD 61064 | 07:37:16.73 | -04:06:39.7 | F6III | 6367 | 3.21 | 0.44 | 0.06 | 25 Mon | |
| LHS 235 | 07:40:21 | -17:24:54 | DF | 0.00 | - | ||||
| HD 63077 | 07:45:35.18 | -34:10:35.6 | G0V | 5731 | 4.08 | -0.87 | 0.00 | 171 Pup | |
| HD 64090 | 07:53:32.64 | +30:36:34.3 | sdG2 | 5413 | 4.53 | -1.70 | 0.00 | - | |
| HD 65583 | 08:00:32.24 | +29:12:54.7 | G8V | 5295 | 4.64 | -0.66 | 0.00 | - | |
| HD 67767 | 08:10:27.23 | +25:30:29.4 | G8IV | 5598 | 4.37 | 0.17 | 0.00 | Cnc | |
| HD 69897 | 08:20:03.87 | +27:13:07.0 | F6V | 6275 | 4.21 | -0.31 | 0.02 | Cnc | |
| HD 70272 | 08:22:50.13 | +43:11:18.1 | K5III | 3900 | 1.59 | -0.03 | 0.00 | 31 Lyn V* BN Lyn | |
| HD 72184 | 08:32:55.06 | +38:01:00.4 | K2III | 4525 | 2.05 | -0.05 | 0.00 | - | |
| HD 72324 | 08:33:00.14 | +24:05:05.7 | G9III | 4743 | 2.06 | -0.01 | 0.00 | Cnc | |
| HD 74280 | 08:43:13.49 | +03:23:55.2 | B3V | 17899 | 3.83 | -0.09 | 0.08 | Hya HR3454 | |
| HD 74739 | 08:46:41.83 | +28:45:36.0 | G8Iab: | 4910 | 2.27 | -0.05 | 0.00 | Cnc A | |
| HD 75732 | 08:52:36.13 | +28:19:53.0 | G8V | 5256 | 4.38 | 0.37 | 0.00 | Cnc A | |
| HD 76151 | 08:54:18.19 | -05:26:04.3 | G3V | 5728 | 4.40 | 0.04 | 0.1 | - | |
| HD 76943 | 09:00:38.75 | +41:47:00.4 | F5V | 6575 | 4.03 | 0.07 | 0.3 | 10 UMa | |
| HD 77350 | 09:02:44.27 | +24:27:10.6 | A0III | 10506 | 3.60 | 0.10 | 0.00 | Cnc | |
| HD 77729 | 09:05:04.74 | +26:09:53.4 | K4III | 4271 | 2.00 | -0.40 | 0.00 | - | |
| HD 78316 | 09:07:44.82 | +10:40:05.6 | B8IIImnp | 13449 | 3.61 | 0.12 | 0.3 | kap Cnc V* | |
| HD 78418 | 09:08:47.42 | +26:37:48.0 | G5IV | 5659 | 4.05 | -0.26 | 0.1 | 75 Cnc | |
| HD 79158 | 09:13:48.23 | +43:13:04.5 | B8IIImnp | 13727 | 3.66 | 0.63 | 0.6 | 36 Lyn | |
| HD 79452 | 09:15:14.36 | +34:38:00.2 | G6III | 5072 | 2.20 | -0.65 | 0.00 | - | |
| HD 80081 | 09:18:50.67 | +36:48:10.4 | A1V | 0.00 | 38 Lyn | ||||
| HD 81192 | 09:24:45.39 | +19:47:12.8 | G7III | 4692 | 2.59 | -0.64 | 0.00 | - |
| Star | RA 2000 | DEC 2000 | spectr. | Teff | log(g) | [Fe/H] | Mv | Av | identification |
|---|---|---|---|---|---|---|---|---|---|
| HD 81809 | 09:27:46.92 | -06:04:15.7 | G2V | 5610 | 3.93 | -0.30 | 0.00 | - | |
| HD 82210 | 09:34:28.97 | +69:49:48.6 | G4III-IV | 5253 | 3.43 | -0.34 | 0.5 | - | |
| HD 83632 | 09:40:34.09 | +26:00:14.4 | K2III | 4308 | 1.00 | -1.30 | 0.3 | - | |
| HD 84937 | 09:48:55.87 | +13:44:46.1 | sdF5 | 6257 | 4.04 | -2.17 | 0.00 | - | |
| HD 85235 | 09:52:06.36 | +54:03:51.4 | A3IV | 11200 | 3.55 | -0.40 | 0.5 | UMa | |
| HD 86161 | 09:54:52.91 | -57:43:38.3 | WN | 0.00 | WR 16 V* V396 Car | ||||
| HD 86728 | 10:01:01.02 | +31:55:29.0 | G1V | 5737 | 4.25 | 0.12 | 0.2 | 20 LMi | |
| HD 86986 | 10:02:29.48 | +14:33:27.0 | A1V | 7867 | 3.15 | -1.77 | 0.34 | - | |
| HD 87141 | 10:04:36.35 | +53:53:30.2 | F5V | 6369 | 3.99 | 0.09 | 0.2 | - | |
| HD 87737 | 10:07:19.95 | +16:45:45.6 | A0Ib | 9806 | 1.95 | -0.01 | 0.04 | Leo | |
| HD 87696 | 10:07:25.73 | +35:14:40.9 | A7V | 0.00 | 21 LMi | ||||
| HD 87822 | 10:08:15.94 | +31:36:15.4 | F4V | 6615 | 4.07 | 0.17 | 0.1 | - | |
| HD 87901 | 10:08:22.46 | +11:58:01.9 | B7V | 12540 | 0.08 | Leo Regulus HR3982 | |||
| HD 88355 | 10:11:38.19 | +13:21:18.7 | F7V | 6423 | 0.00 | 0.05 | 34 Leo | ||
| HD 88609 | 10:14:28.98 | +53:33:39.6 | G5IIIwe | 4560 | 1.17 | -2.75 | 0.00 | - | |
| HD 89025 | 10:16:41.40 | +23:25:02.4 | F0III | 6965 | 0.17 | Leo | |||
| HD 89254 | 10:17:37.90 | -08:04:08.1 | F2III | 7106 | 3.76 | 0.09 | 0.05 | Sex | |
| HD 89758 | 10:22:19.80 | +41:29:58.0 | M0III | 3700 | 1.35 | 0.00 | 0.00 | UMa | |
| HD 90277 | 10:25:54.87 | +33:47:46.5 | F0V | 8937 | 3.46 | 0.18 | 0.00 | 30 LMi | |
| HD 90508 | 10:28:03.81 | +48:47:13.4 | G1V | 5735 | 4.35 | -0.32 | 0.3 | - | |
| HD 90537 | 10:27:53.09 | +36:42:26.9 | G8III-IV | 5061 | 2.95 | 0.01 | 0.00 | LMi | |
| HD 90839 | 10:30:37.76 | +55:58:50.2 | F8V | 6052 | 4.36 | -0.18 | 0.00 | 36 UMa | |
| HD 91316 | 10:32:48.68 | +09:18:23.7 | B1Ib | 24200 | 3.09 | -0.89 | 0.0 | Leo V* | |
| HD 92740 | 10:41:17.52 | -59:40:36.9 | WNs… | 1.30 | WR 22 V* V429 Car | ||||
| HD 92809 | 10:41:38.33 | -58:46:18.8 | WC | 0.00 | WR 23 | ||||
| HD 92769 | 10:43:01.95 | +26:19:32.5 | A4Vn | 6380 | 4.10 | -0.15 | 0.00 | 40 LMi | |
| HD 93250 | 10:44:45.04 | -59:33:54.7 | O5 | 51000 | 3.90 | 1.58 | - | ||
| HD 93430 | 10:47:22.18 | +16:55:20.7 | G0 | 0.00 | - | ||||
| HD 93765 | 10:49:53.73 | +27:58:25.9 | F5V | 6811 | 3.70 | -0.10 | 0.00 | 44 LMi | |
| HD 94028 | 10:51:28.29 | +20:16:43.0 | F4V | 5969 | 4.28 | -1.45 | 0.0 | - | |
| HD 94264 | 10:53:18.64 | +34:12:56.0 | K0III-IV | 4657 | 2.86 | -0.20 | 0.6 | 46 LMi | |
| HD 94247 | 10:53:34.52 | +54:35:06.5 | K3III | 4243 | 2.28 | -0.16 | 0.7 | 44 UMa | |
| HD 95345 | 11:00:33.64 | +03:37:03.1 | K1III | 4527 | 2.48 | -0.19 | 0.00 | 58 Leo | |
| HD 95418 | 11:01:50.39 | +56:22:56.4 | A1V | 9452 | 3.94 | 0.22 | 0.3 | UMa | |
| HD 95735 | 11:03:20.61 | +35:58:53.3 | M2V | 3739 | 4.96 | -0.20 | 0.00 | - | |
| HD 97633 | 11:14:14.44 | +15:25:47.1 | A2V | 9360 | 3.60 | 0.03 | 0.00 | Leo | |
| HD 97916 | 11:15:54.11 | +02:05:12.2 | F5V | 6308 | 4.08 | -1.11 | 0.00 | - | |
| HD 98262 | 11:18:28.76 | +33:05:39.3 | K3III | 4119 | 1.74 | -0.11 | 0.00 | UMa | |
| HD 98839 | 11:22:49.61 | +43:28:57.9 | G8II | 4886 | 2.30 | 0.03 | 0.00 | 56 UMa | |
| HD 99028 | 11:23:55.37 | +10:31:46.9 | F2IV | 6703 | 3.98 | 0.07 | 0.1 | Leo | |
| HD 99747 | 11:29:04.70 | +61:46:40.0 | F5Vawvar | 6580 | 4.23 | -0.57 | 0.2 | - | |
| HD 100006 | 11:30:29.08 | +18:24:35.1 | K0III | 4755 | 3.00 | 0.02 | 0.00 | 86 Leo |
| Star | RA 2000 | DEC 2000 | spectr. | Teff | log(g) | [Fe/H] | Mv | Av | identification |
|---|---|---|---|---|---|---|---|---|---|
| HD 100889 | 11:36:40.95 | -09:48:08.1 | B9.5Vn | 0.01 | Crt HR4468 | ||||
| HD 101501 | 11:41:03.03 | +34:12:09.2 | G8Vvar | 5380 | 4.55 | -0.11 | 0.00 | 61 UMa | |
| HD 101606 | 11:41:34.50 | +31:44:45.5 | F4V | 6210 | 4.32 | -0.79 | 0.2 | 62 UMa | |
| LTT4364 | 11:45:43 | -64:50:29 | DC: | 0.00 | - | ||||
| HD 102212 | 11:45:51.57 | +06:31:47.3 | M0III | 3660 | 0.00 | Vir | |||
| HD 102224 | 11:46:03.13 | +47:46:45.6 | K0III | 4358 | 1.61 | -0.46 | 0.00 | UMa | |
| HD 102634 | 11:49:01.40 | -00:19:07.2 | F7V | 6314 | 4.12 | 0.18 | 0.00 | - | |
| HD 102870 | 11:50:41.29 | +01:45:55.4 | F8V | 6121 | 4.13 | 0.15 | 0.10 | Vir | |
| HD 103036 | 11:51:50.13 | -05:45:43.8 | G3Ibpvar | 4275 | 0.49 | -1.64 | 0.5 | V* TY Vir | |
| HD 104893 | 12:04:43.15 | -29:11:05.1 | K0I | 4500 | 0.96 | -1.90 | 0.00 | - | |
| HD 105546 | 12:09:02.76 | +59:01:05.7 | G2IIIw | 5224 | 2.39 | -1.37 | 0.6 | - | |
| HD 106038 | 12:12:01.50 | +13:15:44.5 | F6V-VI | 5988 | 4.41 | -1.35 | 0.4 | - | |
| HD 107213 | 12:19:29.66 | +28:09:26.0 | F8Vs | 6318 | 4.06 | 0.26 | 0.00 | 9 Com | |
| HD 108177 | 12:25:34.98 | +01:17:06.4 | sdF5 | 6069 | 4.33 | -1.69 | 0.06 | - | |
| HD 109995 | 12:38:47.69 | +39:18:32.9 | A0p | 8293 | 3.16 | -1.27 | 0.0 | - | |
| HD 110897 | 12:44:59.68 | +39:16:42.9 | G0V | 5845 | 4.24 | -0.48 | 0.1 | 10 CVn | |
| HD 111028 | 12:46:22.38 | +09:32:26.8 | K1III-IV | 4710 | 3.00 | -0.40 | 0.00 | 33 Vir | |
| HD 112300 | 12:55:36.48 | +03:23:51.4 | M3III | 3684 | 1.30 | -0.14 | 0.00 | Vir | |
| HD 113022 | 13:00:38.86 | +18:22:22.3 | F6Vs | 6380 | 4.20 | 0.10 | 0.00 | - | |
| HD 113139 | 13:00:43.59 | +56:21:58.8 | F2V | 0.6 | 78 UMa | ||||
| HD 113337 | 13:01:47.15 | +63:36:36.6 | F6V | 6545 | 4.20 | 0.07 | 0.1 | - | |
| HD 113226 | 13:02:10.76 | +10:57:32.8 | G8IIIvar | 5017 | 2.79 | 0.09 | 0.00 | Vir | |
| HD 113848 | 13:06:21.28 | +21:09:12.6 | F4V | 6628 | 4.03 | -0.27 | 0.1 | 39 Com | |
| HD 114330 | 13:09:57.01 | -05:32:20.1 | A1V | 9509 | 3.67 | -0.02 | 0.00 | Vir HR4963 | |
| HD 115383 | 13:16:46.71 | +09:25:25.3 | G0Vs | 5981 | 4.10 | 0.08 | 0.19 | 59 Vir | |
| HD 116842 | 13:25:13.42 | +54:59:16.8 | A5V | 8066 | 0.4 | 80 UMa ALCOR | |||
| HD 117176 | 13:28:25.95 | +13:46:48.7 | G5V | 5485 | 3.84 | -0.09 | 0.00 | 70 Vir | |
| HD 120136 | 13:47:16.04 | +17:27:24.4 | F7V | 6445 | 4.22 | 0.27 | 0.00 | Boo | |
| HD 122408 | 14:01:38.78 | +01:32:40.5 | A3V | 8290 | 0.01 | Vir | |||
| HD 122563 | 14:02:31.96 | +09:41:10.6 | F8IV | 4588 | 1.21 | -2.66 | 0.00 | - | |
| HD 123299 | 14:04:23.43 | +64:22:32.9 | A0III | 9927 | 3.17 | -0.33 | 0.00 | Dra | |
| HD 124425 | 14:13:40.67 | -00:50:42.4 | F7Vw | 6380 | 4.04 | 0.09 | 0.05 | - | |
| HD 124570 | 14:14:05.33 | +12:57:34.5 | F6IV | 6192 | 4.06 | 0.07 | 0.00 | 14 Boo | |
| HD 124850 | 14:16:00.88 | -05:59:58.3 | F7V | 6143 | 3.89 | -0.13 | 0.08 | Vir | |
| HD 125560 | 14:19:45.32 | +16:18:24.5 | K3III | 4426 | 2.42 | 0.00 | 0.3 | 20 Boo | |
| HD 126141 | 14:23:06.92 | +25:20:16.9 | F5V | 6632 | 4.30 | 0.00 | 0.00 | - | |
| HD 126660 | 14:25:12.02 | +51:51:06.2 | F7V | 6369 | 4.29 | -0.05 | 0.01 | Boo | |
| HD 127665 | 14:31:49.86 | +30:22:16.1 | K3III | 4251 | 1.95 | -0.25 | 0.7 | Boo | |
| HD 128167 | 14:34:40.69 | +29:44:41.3 | F3Vwva | 6746 | 4.23 | -0.42 | 0.35 | Boo | |
| HD 130109 | 14:46:14.99 | +01:53:34.6 | A0V | 10110 | 0.02 | 109 Vir HR5511 | |||
| HD 130948 | 14:50:15.72 | +23:54:42.4 | G2V | 5947 | 4.07 | 0.07 | 0.00 | - | |
| HD 131156 | 14:51:23.28 | +19:06:02.3 | G8V | 5512 | 4.59 | -0.04 | 0.00 | Boo |
| Star | RA 2000 | DEC 2000 | spectr. | Teff | log(g) | [Fe/H] | Mv | Av | identification |
|---|---|---|---|---|---|---|---|---|---|
| HD 132142 | 14:55:12.00 | +53:40:45.1 | K1V | 5125 | 4.50 | -0.55 | 0.00 | - | |
| HD 134083 | 15:07:17.95 | +24:52:10.5 | F5V | 6583 | 4.20 | 0.06 | 0.01 | 45 Boo | |
| HD 134169 | 15:08:18.06 | +03:55:50.3 | G1Vw | 5827 | 3.97 | -0.87 | 0.00 | - | |
| HD 135722 | 15:15:30.10 | +33:18:54.4 | G8III | 4803 | 2.51 | -0.40 | 0.00 | Boo | |
| HD 136202 | 15:19:18.58 | +01:46:00.0 | F8III-IV | 6068 | 3.94 | -0.12 | 0.04 | 5 Ser V* MQ Ser | |
| HD 136512 | 15:20:08.64 | +29:36:58.7 | K0III | 4686 | 2.72 | -0.40 | 0.00 | o CrB | |
| HD 137759 | 15:24:55.78 | +58:57:57.7 | K2III | 4472 | 2.74 | 0.19 | 0.00 | Dra | |
| HD 138290 | 15:30:55.42 | +08:34:44.8 | F4Vw | 6834 | 4.11 | -0.05 | 0.00 | - | |
| HD 139669 | 15:31:25.05 | +77:20:57.6 | K5III | 3907 | 1.69 | -0.11 | 0.00 | UMi | |
| HD 139641 | 15:37:49.55 | +40:21:11.8 | G8III-IV | 4937 | 3.21 | -0.54 | 0.00 | Boo | |
| HD 139798 | 15:38:16.14 | +46:47:52.8 | F2V | 6788 | 4.00 | -0.13 | 0.00 | - | |
| HD 141004 | 15:46:26.75 | +07:21:11.7 | G0Vvar | 5899 | 4.22 | -0.01 | 0.00 | Ser | |
| HD 141714 | 15:49:35.70 | +26:04:06.8 | G5III-IV | 5218 | 3.12 | -0.31 | 0.00 | CrB | |
| HD 142373 | 15:52:40.19 | +42:27:00.0 | F9V | 5823 | 4.11 | -0.41 | 0.01 | Her | |
| HD 144206 | 16:02:47.85 | +46:02:12.7 | B9III | 11957 | 3.70 | -0.17 | 0.35 | Her | |
| HD 145675 | 16:10:24.21 | +43:49:06.1 | K0V | 5312 | 4.40 | 0.46 | 0.00 | 14 Her | |
| HD 145976 | 16:12:45.43 | +26:40:14.4 | F3V | 6720 | 4.10 | 0.01 | 0.00 | - | |
| HD 146051 | 16:14:20.77 | -03:41:38.3 | M1III | 3679 | 1.40 | 0.32 | 0.00 | Oph | |
| HD 147394 | 16:19:44.45 | +46:18:47.8 | B5IV | 14908 | 3.81 | -0.07 | 0.08 | Her | |
| HD 147547 | 16:21:55.24 | +19:09:10.9 | A9III | 7125 | 0.08 | V* Her | |||
| HD 148513 | 16:28:33.98 | +00:39:54.6 | K4IIIp | 4003 | 1.03 | -0.08 | 0.00 | - | |
| HD 148783 | 16:28:38.52 | +41:52:54.1 | M6IIIvar | 3250 | 0.20 | -0.02 | 1.0 | V* g Her 30 Her | |
| HD 150275 | 16:30:39.08 | +77:26:45.1 | K1III | 4667 | 2.50 | -0.50 | 0.00 | - | |
| HD 149121 | 16:32:35.68 | +05:31:16.4 | B9.5III | 11067 | 3.78 | 0.17 | 0.00 | 28 Her | |
| HD 149661 | 16:36:21.18 | -02:19:25.8 | K2V | 5362 | 4.56 | 0.01 | 0.00 | 12 Oph V* V2133 Oph | |
| HD 151044 | 16:42:27.69 | +49:56:12.1 | F8V | 6110 | 4.40 | -0.02 | 0.00 | - | |
| HD 151217 | 16:45:49.89 | +08:34:57.3 | K5III | 4093 | 3.36 | -0.04 | 0.00 | 43 Her | |
| HD 152830 | 16:55:15.97 | +13:37:12.0 | F5II | 6811 | 3.70 | -0.13 | 0.00 | V* V644 Her | |
| HD 154417 | 17:05:16.83 | +00:42:12.1 | F9V | 5859 | 4.27 | -0.11 | 0.00 | V* V2213 Oph | |
| HD 154733 | 17:06:18.11 | +22:05:03.3 | K4III | 4220 | 2.20 | -0.13 | 0.00 | - | |
| HD 155646 | 17:12:54.33 | +00:21:07.9 | F6III | 6168 | 3.94 | -0.14 | 0.00 | - | |
| HD 156283 | 17:15:02.85 | +36:48:33.0 | K3IIvar | 4128 | 1.68 | -0.18 | 0.00 | Her | |
| HD 157373 | 17:20:33.60 | +48:11:19.7 | F6Vawvar | 6433 | 4.09 | -0.50 | 0.00 | - | |
| HD 157214 | 17:20:39.47 | +32:28:13.0 | G0V | 5686 | 4.26 | -0.36 | 0.00 | 72 Her | |
| HD 157089 | 17:21:07.15 | +01:26:32.6 | F9V | 5786 | 4.13 | -0.55 | 0.00 | - | |
| HD 157856 | 17:25:57.84 | -01:39:06.9 | F3V | 6327 | 3.96 | -0.18 | 0.00 | - | |
| HD 157881 | 17:25:45.57 | +02:06:51.5 | K7V | 4073 | 4.58 | 0.16 | 0.00 | - | |
| HD 157999 | 17:26:30.88 | +04:08:25.2 | K3IIvar | 4146 | 0.01 | 0.00 | Oph | ||
| HD 159181 | 17:30:25.98 | +52:18:04.9 | G2II | 5169 | 1.55 | 0.14 | 1.4 | Dra | |
| HD 159332 | 17:33:22.84 | +19:15:24.8 | F6V | 6172 | 3.88 | -0.23 | 0.00 | - | |
| HD 160693 | 17:39:37.24 | +37:11:08.7 | G0V | 5747 | 4.21 | -0.63 | 0.00 | - | |
| HD 160910 | 17:41:58.64 | +15:57:07.8 | F4Vw | 6502 | 4.00 | -0.13 | 0.00 | - |
| Star | RA 2000 | DEC 2000 | spectr. | Teff | log(g) | [Fe/H] | Mv | Av | identification |
|---|---|---|---|---|---|---|---|---|---|
| HD 161817 | 17:46:40.65 | +25:44:57.3 | sdA2 | 7702 | 2.94 | -1.30 | 0.0 | - | |
| HD 163506 | 17:55:25.19 | +26:02:59.9 | F2Iavar | 6400 | 1.20 | -0.41 | 0.27 | 89 Her V* V441 Her | |
| HD 163993 | 17:57:45.83 | +29:14:52.5 | K0III | 5014 | 2.78 | 0.02 | 0.00 | Her | |
| HD 164136 | 17:58:30.15 | +30:11:21.4 | F2II | 6586 | 2.07 | -0.42 | 0.30 | . Her V* | |
| HD 164349 | 18:00:03.42 | +16:45:03.4 | K0II-III | 4383 | 1.80 | -0.22 | 0.00 | 93 Her | |
| HD 164353 | 18:00:38.72 | +02:55:53.7 | B5Ib | 22150 | 3.73 | -0.16 | 0.35 | 67 Oph | |
| HD 165195 | 18:04:40.09 | +03:46:45.4 | K3p | 4450 | 1.31 | -2.16 | 0.00 | - | |
| HD 165341 | 18:05:27.21 | +02:30:08.8 | K0V | 5025 | 4.69 | -0.20 | 0.00 | 70 Oph V* V2391 Oph | |
| HD 165908 | 18:07:01.61 | +30:33:42.7 | F7V | 5952 | 4.26 | -0.56 | 0.08 | 99 Her | |
| HD 166620 | 18:09:37.65 | +38:27:32.1 | K2V | 4955 | 4.50 | -0.25 | 0.3 | - | |
| HD 166285 | 18:09:54.01 | +03:07:13.1 | F5V | 6271 | 3.90 | -0.22 | 0.00 | - | |
| HD 168151 | 18:13:53.36 | +64:23:49.9 | F5V | 6463 | 4.05 | -0.30 | 0.5 | 36 Dra | |
| HD 167858 | 18:17:04.85 | +01:00:20.9 | F2V | 7041 | 4.00 | 0.17 | 0.00 | - | |
| HD 172167 | 18:36:56.19 | +38:46:58.8 | A0Vvar | 9520 | 3.97 | -0.55 | 0.01 | Lyr Vega HR7001 | |
| HD 173780 | 18:46:04.47 | +26:39:43.5 | K3III | 4413 | 2.57 | -0.11 | 0.00 | - | |
| HD 173880 | 18:47:01.22 | +18:10:52.4 | A5III | 8113 | -0.84 | 0.0 | 111 Her | ||
| HD 175305 | 18:47:05.73 | +74:43:30.8 | G5III | 5046 | 2.55 | -1.44 | 0.00 | - | |
| HD 173819 | 18:47:28.98 | -05:42:18.3 | K0Ibpvar | 4421 | 0.00 | -0.88 | 0.00 | V* R Sct | |
| HD 175640 | 18:56:22.66 | -01:47:59.3 | B9III | 12067 | 3.93 | -0.47 | 0.2 | - | |
| HD 176437 | 18:58:56.62 | +32:41:22.4 | B9III | 10080 | 3.50 | 0.11 | 0.5 | Lyr | |
| HD 176303 | 18:59:05.73 | +13:37:21.2 | F8V | 6122 | 4.22 | -0.06 | 0.00 | 11 Aql | |
| HD 181470 | 19:19:01.15 | +37:26:43.1 | A0III | 7887 | 3.53 | -0.32 | 0.4 | - | |
| HD 182101 | 19:22:48.35 | +09:54:46.4 | F6V | 6303 | 4.18 | -0.26 | 0.18 | - | |
| HD 182490 | 19:24:22.08 | +16:56:15.9 | A2III-IV | 0.2 | 2 Sge | ||||
| HD 338529 | 19:32:31.91 | +26:23:27.6 | B5 | 6192 | 3.79 | -2.29 | 0.00 | - | |
| HD 184960 | 19:34:19.76 | +51:14:13.5 | F7V | 6249 | 4.36 | -0.14 | 0.3 | - | |
| HD 184927 | 19:35:32.01 | +31:16:35.9 | B2V | 21913 | 3.80 | 0.41 | 0.25 | V* V1671 Cyg | |
| HD 185395 | 19:36:26.54 | +50:13:13.7 | F4V | 6704 | 4.35 | -0.02 | 0.00 | Cyg | |
| HD 185657 | 19:37:56.68 | +49:17:02.6 | G6V | 4912 | 3.00 | -0.41 | 0.30 | - | |
| HD 188209 | 19:51:59.07 | +47:01:38.5 | O9.5Ia | 32903 | 3.32 | 0.70 | HR7589 | ||
| HD 187929 | 19:52:28.36 | +01:00:20.4 | F6Ib: | 5826 | 1.50 | 0.07 | 0.00 | Aql V* | |
| HD 188665 | 19:53:17.37 | +57:31:24.5 | B5V | 0.16 | 23 Cyg | ||||
| HD 188510 | 19:55:09.70 | +10:44:24.9 | G5Vwe | 5536 | 4.59 | -1.63 | 0.00 | 2.52 | |
| HD 189849 | 20:01:06.01 | +27:45:12.8 | A4III | 7860 | 3.61 | 0.01 | 0.00 | 15 Vul V* NT Vul | |
| HD 194093 | 20:22:13.70 | +40:15:24.1 | F8Ib | 5253 | 0.99 | -0.07 | 0.28 | Cyg | |
| HD 195725 | 20:29:34.83 | +62:59:38.9 | A7III | 7769 | 4.00 | 0.13 | 0.8 | Cep | |
| HD 195986 | 20:32:52.33 | +43:11:29.7 | B4III | 0.25 | - | ||||
| HD 197345 | 20:41:25.91 | +45:16:49.2 | A2Ia | 8582 | 1.13 | 0.48 | 0.36 | Cyg Deneb HD 197345 | |
| Feige110 | 23:19:58.40 | -05:09:56.2 | DA: | 0.00 | - |
5 The library
Once calibrated, the spectra in the 4 (JKT) or 6 (SSO) settings of the program stars were combined by averaging the overlapping pixels. This results in 257 stellar spectra in fits format resampled with a step of 1Å per pixel. The library is available in two different forms: the ”raw” data, including the combined spectra as coming out of the calibration process, and the data corrected for interstellar reddening using the empirical extinction function of Cardelli et al. (Cardelli (1989)). As an additional check, we have compared the reddening corrected spectra (using the extintion values from the literature) to the equivalent ones in the Kurucz atlas (same spectral type and metallicity). In most cases (80%), the agreement between the two spectra is excellent. In case of discrepancy (20% of the sample), the extintion values used and quoted in the tables are those allowing to match our corrected spectra to Kurucz. These discrepant objects are clearly identifyed on the web site.
6 Synthetic spectra of stellar populations
Templates of stellar populations have been built from the dereddened library. At this stage, the wavelength scale was corrected for radial velocity. For some stars, data are missing in limited wavelength ranges: for these, we filled the gaps using spectra of stars of similar or close spectral type. The final spectra are useful from 3200 to 9300Å because spectra become noisy from 9300Å to 9850Å. In this way, we built several subsets of the atlas with different [Fe/H] ranges (Table 11). These subsets include a total of 242 star templates which are also available on the web site.
| [Fe/H] range | number of stars | |
|---|---|---|
| -1.90 | 6 | |
| [-1.90 , -1.41] | 12 | |
| sub-solar | [-1.40 , -0.96] | 6 |
| [-0.95 , -0.49] | 23 | |
| [-0.48 , -0.06] | 69 | |
| solar | [-0.06 , +0.07] | 84 |
| above | [+0.08 , +0.47] | 38 |
| solar | +0.47 | 4 |
6.1 Comparison with Kurucz spectra
In order to compare with the previous results, and to show the capabilities of this new library, we have built galaxy models with the STELIB library in the apropriate subset, using the new galaxy evolutionary code GISSEL02 (Bruzual & Charlot Bruzual (1993)). The evolution of a single stellar population of solar metallicity (Z=0.02) is given in Fig. 8 and 9, for ages of the stellar population ranging from 1 to 12 Gyr. A comparison with the same models obtained with the synthetic stellar spectra from Kurucz is also shown to emphasize the gain in spectral resolution.
6.2 Modeling observed spectra of galaxies
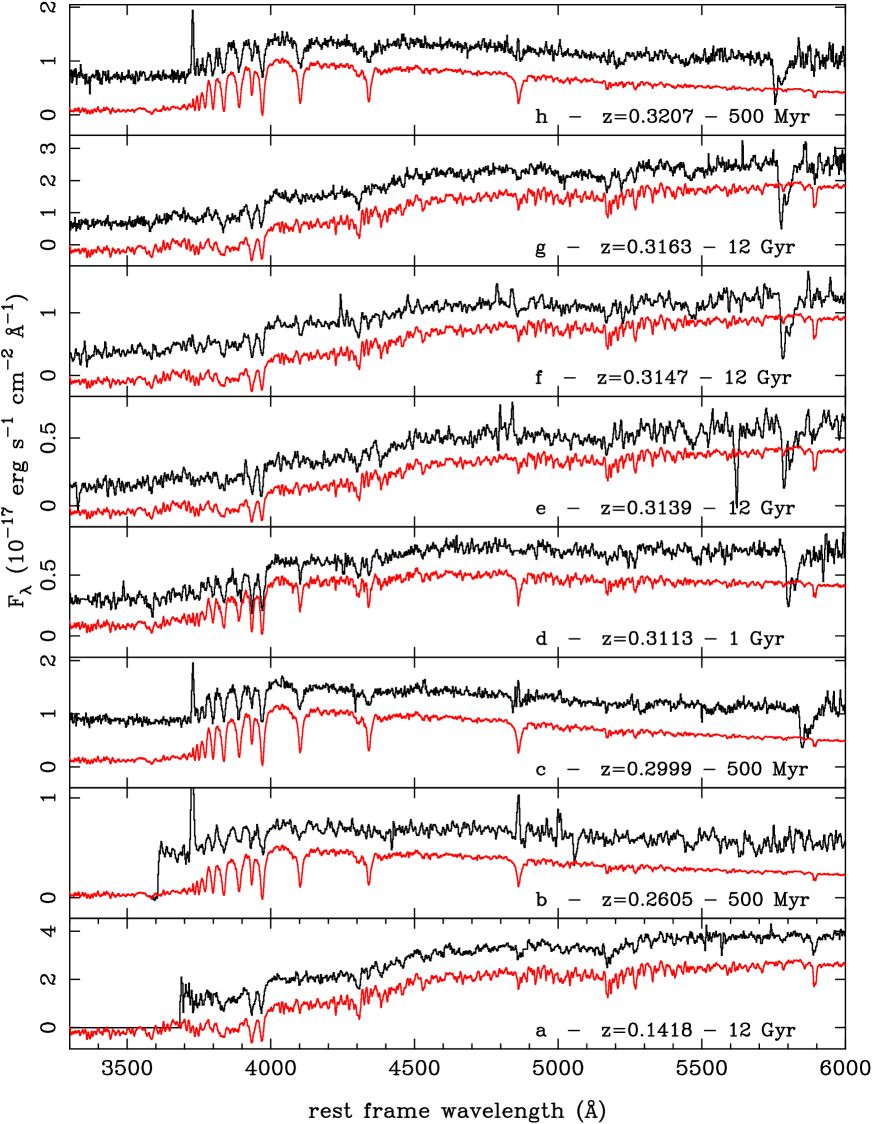
An important application of STELIB is to reproduce in details the spectral features observed in galaxies at z1. As an example, we present here the modeling of spectra of galaxies belonging to the cluster AC114 (more officially named ACO S 1077, Abell et al., Abell (1989)) at a redshift of z=0.312, and some foreground galaxies in the same field. These spectra were obtained with the spectrograph FORS1 on VLT unit 1 Antu, on october 5, 1999. The main objective of the run was the determination of the redshift of background lensed galaxies, but spectra of cluster galaxies were also obtained in the remaining slits. The grism used was G300V, with a wavelength coverage between 4000Å and 8600Å, and a wavelength resolution of R=500 for the 1” slit width used which correspond to a resolution of 7Å at rest frame of the cluster. Details of the observation conditions and data reduction can be found in Campusano et al. (Campusano (2001)).
| USNO | ident.in | ra(2000) | dec(2000) | exposure | redshift | spectral | age of |
|---|---|---|---|---|---|---|---|
| fig. 10 | time | type | model | ||||
| U0525_44063178 | a | 22:59:00.61 | -34:46:20.8 | 2700s | 0.1418 | elliptical | 12 Gyr |
| b | 22:58:37.19 | -34:49:27.8 | 5400s | 0.2605 | irregular | 500 Myr | |
| U0525_44063148 | c | 22:58:43.07 | -34:48:48.1 | 5400s | 0.2999 | irregular | 500 Myr |
| d | 22:58:56.93 | -34:47:57.4 | 2700s | 0.3113 | spiral | 1 Gyr | |
| e | 22:58:46.51 | -34:49:09.6 | 4218s | 0.3139 | elliptical | 12 Gyr | |
| U0525_44062505 | f | 22:58:37.67 | -34:49:24.8 | 4218s | 0.3147 | elliptical | 12 Gyr |
| U0525_44063303 | g | 22:58:44.48 | -34:49:11.3 | 4218s | 0.3163 | elliptical | 12 Gyr |
| U0525_44063178 | h | 22:58:43.35 | -34:49:36.5 | 5400s | 0.3207 | irregular | 500 Myr |
A simple best fit procedure has been used to determine the spectral type of each galaxy, acording to its spectral features (see table 12). We have chosen to display galaxies of different types, from E to irregulars, with good S/N ratio. The models correspond to the evolution with time of a Single Stellar Population (SSP) built with the STELIB library for solar metallicity, assuming Kroupa (Kroupa (2001)) IMF. The comparison between observed and modeled spectra is shown in Fig. 10. The best model was chosen among SEDs computed at 11 different ages from 100 Myr to 12 Gyr. The gain in spectral resolution is clear, with obvious applications in stellar population synthesis modelling. In particular, STELIB allows to determine the stellar populations using the strengths of a large number of absorption lines, due to the wide spectral coverage, and thus to improve the emission-line measurements in star-forming galaxies and AGNs.


7 Conclusions
We have presented the main characteristics of the public stellar library STELIB, available on the web site http://webast.ast.obs-mip.fr/stelib. The main improvements with respect to other previous libraries are:
-
1.
The homogeneous and relatively large spectral coverage, from 3200 to 9500Å.
-
2.
The high spectral resolution and sampling for such a spectral coverage.
-
3.
The wide metallicity range, although the present sample still needs some completion for extreme metallicities.
We have presented some qualitative examples on the possible use of STELIB for population synthesis and evolutionary models of galaxies. Fundamental Plane studies of high redshift galaxies could be another possible application for STELIB (Treu et al. Treu (2001)). In general, STELIB should be a useful tool for detailed studies of galaxies at z1, based on optical spectra at intermediate resolution.
Acknowledgements.
We would like to thanks J.-C. Mermilliod who provided us a file extracted from the Lausanne photometric database. Many thanks to Stépane Charlot for a careful reading of the manuscript. This research has made use of the SIMBAD database, operated at CDS, Strasbourg, France. We are grateful to the help of the staff of Roque de los Muchachos Observatory at La Palma and of Siding Spring Observatory in Australia, where these observations were conducted. Some examples shown in this paper come from observations collected at the European Southern Observatory, Chile (ESO N 64.O-0439). Part of this work was supported by the French Centre National de la Recherche Scientifique, and by the French Programme National Galaxies (PNG). G. Bruzual acknowledges ample support from the Venezuelan Ministerio de Ciencia y Tecnología and FONACIT. G. Bruzual also thanks Observatoire Midi-Pyrénées and the MENRT for their support during stays in Toulouse.References
- (1) Abell, G. O., Corwin, H. G. Jr, & Olowin, R. P. 1989, ApJS 70, 1.
- (2) Alonso, A., Arribas, S., & Martínez-Roger, C. 1996, A&AS 117, 227
- (3) Alonso, A., Arribas, S., & Martínez-Roger, C. 1999, A&AS 140, 261
- (4) Blackwell, D. E. & Lynas-Gray, A. E. 1998, A&AS 129, 505
- (5) Boisson, C., Joly, M., Moultaka, J., Pelat, D., Serote Roos, M. 2000, A&A 357, 850
- (6) Bruzual, G., & Charlot, S. 20033, submitted
- (7) Buzzoni, A. 1989, ApJS, 71, 817
- (8) Campusano, L. E., Pello, R., Kneib, J.-P., Le Borgne, J.-F., et al., 2001, A&A, 378, 394
- (9) Cardelli, J. A., Clayton, G. C., & Mathis, J. S. 1989, ApJ 345, 245
- (10) Cochran, A. L. 1981, ApJS 45, 83
- (11) Cayrel de Strobel, G., Hauck, B., Francois, P., et al. 1992, A&AS 95, 273
- (12) Cayrel de Strobel, G., Soubiran, C., Friel, E. D., Ralite, N., & Francois, P. 1997, A&AS 124, 299
- (13) Cayrel de Strobel, G., Soubiran, C. & Ralite, N. 2001, A&A 373, 159
- (14) Cenarro, A. J., Cardiel, N., Gorgas, J., et al. 2001, MNRAS 326, 959
- (15) di Benedetto, G. P. 1998, A&A 339, 858
- (16) Fioc, M., & Rocca-Volmerange, B. 1997, A&A 326, 950
- (17) Guiderdoni, B., & Rocca-Volmerange, B. 1987, A&A 186, 1
- (18) Gunn, J. E., & Stryker, L. L. 1983, ApJS 52, 121
- (19) Hamuy, M., Walker, A. R., Suntzeff, N. B., et al. 1992, PASP 104, 533
- (20) Hamuy, M., Suntzeff, N. B., Heathcote, S. R., et al. 1994, PASP 106, 566
- (21) Hayes, D. S. 1970, ApJ 159, 165
- (22) Hayes, D. S. 1985, in ”Calibration of fundamental stellar quantities”; Proceedings of the Symposium, Como, Italy, May 24-29 1984, Dordrecht, D. Reidel Publishing Co., p. 225
- (23) Høg, E., Fabricius, C., Makarov, V. V., et al. 2000, A&A 355, L27
- (24) Johnson, H. L. 1980, Rev. Mex. Astron. Astrofis. 5, 25
- (25) Jones, L.A. 1997, Ph.D. Thesis, University of North Carolina at Chapel Hill
- (26) Katz, D., Soubiran, C., Cayrel, R., Adda, M. & Cautain, R. 1998, A&A 338, 151
- (27) Kurucz, R. L. 1992, IAU Symp. 149: ”The Stellar populations of Galaxies”, B. Barbuy and A. Renzini eds, Kluwer Academic Publishers, p225
- (28) Kroupa, P. 2001, MNRAS 322, 231
- (29) Lançon, A., & Rocca-Volmerange, B. 1992, A&AS 96, 593
- (30) Lejeune, T., Cuisinier, F., & Buser, R. 1997, A&AS 125, 246
- (31) Lejeune, T., Cuisinier, F., & Buser, R. 1998, A&AS 130, 75
- (32) Mermilliod, J.-C., Mermilliod, M., & Hauck, B. 1997, A&AS 124, 349
- (33) Montes, D., Ramsey, L. W., & Welty, A. D. 1999, ApJS 123, 283
- (34) Oke, J. B. 1990, AJ 99, 1621
- (35) Pelat, D. 1997, MNRAS 284, 365
- (36) Perryman, M. A. C., Lindegren, L., Kovalevsky, J., et al. 1997, A&A 323, L49
- (37) Pickles, A. J. 1998, PASP 110, 863
- (38) Prugniel, P. & Soubiran, C. 2001, A&A 369, 1048
- (39) Schaller G., Schaerer D., Meynet G., & Maeder A. 1992, A&AS 96, 269
- (40) Treu, T., Stiavelli, M., Bertin, G., Casertano, S., & Møller, P. 2001, MNRAS 326, 237
- (41) Westera, P., Lejeune, T., Buser, R., Cuisinier, F., & Bruzual, G. 2002, A&A 381, 524
- (42) Whiteoak, J. B 1966, ApJ 144, 305
Appendix A Synthetic photometry and photometric reliability of STELIB
We present in this section a detailed comparison between the synthetic photometry
derived for the STELIB library and the Lausanne database (Mermilliod et al.
1997). Magnitudes for STELIB stars have been obtained using the flux calibrated
spectra without any correction for dereddening or radial velocity. The
photometric bands are UBVRI, with filter transmissions as close as possible to
the Johnson filters commonly used in the Lausanne database. Table 13
summarizes the characteristics of the different filters.
Tables 15 to 18 provide with the UVBRI synthetic photometry
for most of STELIB stars, together with the photoelectric photometry coming from
the Lausanne database. Stars known to be variable or for which the spectrum is
incomplete in a given filter have been discarded from this analysis. Almost all
stars in this library have UBV Johnson magnitudes available, whereas R and I
magnitudes are available only for 70% of the whole sample. In addition,
magnitudes in the R and I bands are given either in the Johnson system or in the
Eggen or Cousins systems. The later are identified by a comment in the last
column of Tables 15 to 18. When a filter band is missing in
the STELIB spectra, the corresponding magnitude is given by ”-” in the tables.
A small extrapolation up to 100Å is allowed in U and I when needed,
towards the blue and the red edges of the filters. The following caveats apply in
the comparison of photoelectric with synthetic magnitudes derived from our
spectra:
-
•
The effective filter transmissions in the different bands could be different between the photoelectric and the synthetic magnitudes.
-
•
The transmission of the Johnson U band has been set to zero in our calculations for wavelengths shorter than 3200Å, which corresponds to the blue limit of the STELIB spectra.
-
•
Although the majority of stars in the Lausanne database are given in the Johnson system, STELIB spectra do not cover completely the standard I band. Thus, the effective transmission in the I band has been adapted to the red limit of our spectra in wavelength. When spectra extend up to 9800Å, we use the broadest and redest version of the I band filter, identified by in Table 13, which is closer (although not identical) to a true Johnson filter. For spectra with red wavelegth limits bluer than 9800Å, we used the I Cousins filter instead, identified by in Table 13. These stars are identified by an asterisk in Tables 15 to 18.
| Filter | [Å] | width [Å] |
|---|---|---|
| 3594 | 377 | |
| 4462 | 742 | |
| 5554 | 736 | |
| 6939 | 1507 | |
| 8548 | 1307 | |
| 8060 | 924 |
| quantity | rms | quantity | rms | |
|---|---|---|---|---|
| 0.145 | 0.156 | |||
| 0.044 | 0.083 | |||
| 0.072 | 0.135 | |||
| 0.172 | 0.177 | |||
| 0.249 |
Figures 11 to 13 display the residuals of the comparison between synthetic photometry and the published Lausanne database. Table 14 summarizes the dispersion values obtained in the different filters and colors. As expected, the smallest dispersions correspond to the B and V magnitudes and B-V colors, for which we have the highest degree of confidence in the correspondance between filter bands. For these 2 filters, the rms dispersion is quite consistent with the photometric accuracy derived from standard stars. The dispersion is much higher in the I band, as expected taking into account the inhomogeneities both in the photometric systems and the wavelegth coverage for the different objects. The situation in the U and R bands are intermediate. The wavelegth coverage could be responsible for the dispersion in U, (where the photometric systems are more consistent than in I), whereas the culprit in R is more likely the photometric system, but this point is difficult to assess. According to figures 11 to 13, there is no obvious color trend in the residuals neither in magnitude nor in color, except for the R-I and maybe in V-R in Figure 13. This color trend is due to a residual difference between the filters used to compute synthetic magnitudes and the true Johnson filter. On the other hand, the relatively small dispersion in the R-I residuals as compared to the corresponding dispersion in R and I magnitudes (Figure 13) indicates that the two photometric systems used are both internally consistent, but different from each other.


| photoelectric photometry | synthetic photometry from spectra | ||||||||||
| Star | U | B | V | R | I | U | B | V | R | I | comment |
| HD 2857 | 10.42 | 10.19 | 9.99 | - | - | 10.27 | 10.19 | 10.06 | 9.92 | 9.80 | |
| HD 6268 | 9.26 | 8.95 | 8.11 | - | - | 9.37 | 8.85 | 8.06 | 7.45 | 7.02 | |
| HD 15318 | 4.12 | 4.23 | 4.28 | 4.26 | 4.31 | 4.11 | 4.24 | 4.32 | 4.31 | 4.31 | * |
| HD 21581 | 9.74 | 9.53 | 8.71 | 7.97 | 7.43 | 10.13 | 9.36 | 8.60 | 8.05 | 7.64 | |
| HD 26630 | 5.75 | 5.11 | 4.15 | 3.36 | 2.82 | 5.77 | 5.08 | 4.13 | 3.43 | 3.12 | * |
| HD 30614 | 3.43 | 4.32 | 4.29 | 4.18 | 4.18 | 3.83 | 4.29 | 4.08 | 3.78 | 3.38 | |
| HD 30739 | 4.35 | 4.37 | 4.36 | 4.30 | 4.30 | 4.51 | 4.38 | 4.41 | 4.33 | 4.32 | |
| HD 32034 | 9.16 | 9.79 | 9.69 | 9.52 | 9.46 | 9.01 | 9.80 | 9.77 | 9.70 | 9.63 | * |
| HD 32923 | 5.71 | 5.57 | 4.92 | 4.65 | 4.42 | 5.80 | 5.57 | 4.87 | 4.38 | 4.48 | * Eggen |
| HD 33579 | 9.08 | 9.32 | 9.13 | 8.90 | 8.75 | 9.24 | 9.33 | 9.22 | 9.07 | 8.95 | * |
| HD 34411 | 5.45 | 5.33 | 4.71 | 4.18 | 3.86 | 5.47 | 5.33 | 4.69 | 4.26 | 4.51 | * |
| HD 34816 | 3.01 | 4.02 | 4.29 | 4.41 | 4.69 | 2.87 | 4.05 | 4.33 | 4.42 | 4.60 | |
| HD 35497 | 1.03 | 1.52 | 1.65 | 1.66 | 1.76 | 0.89 | 1.47 | 1.65 | 1.66 | 1.79 | * |
| HD 36512 | 3.29 | 4.36 | 4.62 | 4.74 | 5.00 | 3.26 | 4.29 | 4.48 | 4.52 | 4.70 | * |
| HD 36673 | 3.04 | 2.79 | 2.58 | 2.36 | 2.15 | 3.29 | 2.74 | 2.30 | 1.96 | 1.98 | * |
| HD 37394 | 7.57 | 7.06 | 6.22 | 5.53 | 5.10 | 7.62 | 7.06 | 6.06 | 5.36 | 5.45 | * |
| HD 37828 | 8.86 | 8.00 | 6.87 | 5.94 | 5.27 | 9.18 | - | - | 5.90 | 5.36 | |
| HD 38247 | 9.94 | 8.23 | 6.61 | - | - | 9.86 | 8.03 | - | 4.44 | 3.20 | |
| HD 39587 | 5.06 | 4.99 | 4.40 | 3.89 | 3.58 | 4.94 | 4.99 | 4.40 | 3.93 | 3.79 | |
| HD 39866 | 7.18 | 6.92 | 6.62 | - | - | 7.22 | 6.90 | 6.70 | 6.47 | 6.50 | * |
| HD 39949 | - | 8.32 | 7.23 | - | - | 9.09 | 8.30 | 7.16 | 6.50 | 6.80 | * |
| HD 40111 | 3.84 | 4.76 | 4.82 | 4.76 | 4.87 | 3.50 | 4.71 | 4.80 | 4.70 | 4.33 | |
| HD 41636 | 8.23 | 7.39 | 6.35 | - | - | 8.28 | 7.38 | 6.34 | 5.65 | 4.98 | |
| HD 41667 | 10.10 | 9.54 | 8.53 | - | - | - | 9.32 | 8.40 | 7.75 | 7.28 | |
| HD 42454 | 9.34 | 8.58 | 7.35 | 6.39 | 5.70 | 9.51 | 8.54 | 7.29 | 6.54 | - | * |
| HD 43153 | 4.73 | 5.18 | 5.33 | - | - | 4.82 | 5.16 | 5.24 | 5.23 | 5.32 | * |
| HD 45829 | 9.83 | 8.21 | 6.63 | 5.54 | 4.78 | 9.86 | 8.14 | 6.58 | 5.58 | 5.07 | * |
| HD 46223 | 6.74 | 7.50 | 7.28 | 6.97 | 6.81 | 6.83 | 7.45 | 7.10 | 6.77 | 6.76 | * |
| HD 47129 | 5.23 | 6.11 | 6.06 | 5.97 | 5.91 | 5.31 | 6.23 | 6.17 | 6.00 | 6.22 | * |
| HD 47731 | 8.36 | 7.51 | 6.42 | 6.07 | 5.71 | 8.36 | 7.51 | 6.46 | 5.76 | 4.88 | Eggen |
| HD 48329 | 5.86 | 4.39 | 2.99 | 2.03 | 1.42 | 5.78 | 4.35 | 2.99 | 2.19 | 1.33 | |
| HD 48682 | 5.85 | 5.79 | 5.24 | - | - | 5.95 | 5.75 | 5.07 | 4.56 | 4.34 | |
| HD 49933 | 6.05 | 6.15 | 5.76 | - | - | 6.10 | 6.13 | 5.66 | 5.26 | 5.13 | * |
| HD 52005 | 9.12 | 7.33 | 5.68 | 4.42 | 3.59 | 9.06 | 7.27 | 5.65 | 4.69 | - | * |
| HD 53929 | 5.51 | 5.97 | 6.10 | - | - | 5.48 | 6.01 | 6.21 | 6.21 | 6.28 | |
| HD 54719 | 7.07 | 5.67 | 4.41 | 3.45 | 2.82 | 7.10 | 5.67 | 4.43 | 3.83 | - | |
| HD 58551 | - | 7.00 | 6.54 | 6.12 | 5.81 | 6.87 | 6.99 | 6.54 | 6.31 | - | |
| HD 59881 | 5.64 | 5.46 | 5.24 | - | - | 5.75 | 5.47 | 5.37 | 5.31 | 5.72 | * |
| HD 60178 | - | - | - | - | - | 2.11 | 2.03 | 1.50 | 0.63 | - | |
| HD 60778 | 9.44 | 9.22 | 9.11 | - | - | 9.40 | 9.20 | 9.08 | 8.94 | 9.13 | |
| HD 61064 | 5.67 | 5.57 | 5.13 | - | - | 6.03 | 5.58 | 5.06 | 4.78 | 5.16 | |
| HD 63077 | 5.87 | 5.94 | 5.36 | - | - | 6.34 | 5.85 | 5.37 | 4.96 | 4.68 | |
| HD 64090 | 8.79 | 8.92 | 8.30 | 7.75 | 7.34 | 8.75 | 8.91 | 8.31 | 7.83 | 7.82 | * |
| HD 65583 | 7.89 | 7.71 | 7.00 | 6.40 | 5.98 | 7.84 | 7.72 | 7.06 | 6.51 | 6.12 | |
| HD 67767 | 6.98 | 6.54 | 5.72 | 5.41 | 5.14 | 6.92 | 6.55 | 5.75 | 5.18 | 4.87 | * Eggen |
| HD 69897 | 5.54 | 5.60 | 5.14 | - | - | 5.54 | 5.60 | 5.13 | 4.72 | 4.52 | |
| HD 72184 | 8.17 | 7.01 | 5.90 | 5.43 | 5.03 | 8.12 | 7.06 | 5.89 | 5.25 | 5.69 | * Eggen |
| HD 72324 | 8.25 | 7.38 | 6.35 | 5.93 | 5.58 | 8.26 | 7.38 | 6.33 | 5.81 | - | * |
| HD 74739 | 5.82 | 5.04 | 4.03 | 3.28 | 2.79 | 5.81 | 5.04 | 4.05 | 3.48 | 3.76 | * |
| HD 75732 | 7.46 | 6.81 | 5.95 | 5.66 | 5.40 | 7.48 | 6.83 | 5.96 | 5.34 | 5.00 | * |
| HD 76151 | 6.88 | 6.66 | 6.00 | 5.64 | 5.31 | 6.92 | 6.67 | 5.97 | 5.50 | 5.66 | * Cousins |
| HD 76943 | 4.44 | 4.40 | 3.97 | 3.57 | 3.35 | 4.45 | 4.40 | 3.87 | 3.41 | 3.15 | * |
| photoelectric photometry | synthetic photometry from spectra | ||||||||||
| Star | U | B | V | R | I | U | B | V | R | I | comment |
| HD 77350 | 5.29 | 5.40 | 5.44 | 5.42 | 5.46 | 5.19 | 5.37 | 5.43 | 5.38 | 5.36 | |
| HD 77729 | 10.60 | 9.03 | 7.63 | 6.87 | 6.29 | 10.62 | 9.05 | 7.72 | 6.78 | 6.25 | * Eggen |
| HD 78418 | 6.82 | 6.62 | 5.96 | 5.67 | 5.44 | 6.77 | 6.69 | 5.95 | 5.45 | 5.18 | * Eggen |
| HD 79158 | 4.70 | 5.18 | 5.32 | - | - | 4.75 | 5.14 | 5.14 | 4.97 | 4.86 | |
| HD 79452 | 7.20 | 6.84 | 6.00 | - | - | 7.24 | 6.84 | 5.98 | 5.37 | 4.90 | |
| HD 80081 | 3.92 | 3.87 | 3.81 | 3.69 | 3.66 | 3.89 | 3.85 | 3.81 | 3.65 | 3.52 | * |
| HD 81192 | 8.05 | 7.48 | 6.53 | 5.79 | 5.25 | 7.98 | 7.65 | 6.51 | 5.84 | 5.33 | |
| HD 81809 | 6.14 | 6.01 | 5.37 | 5.00 | 4.64 | 5.82 | 5.98 | 5.36 | 4.85 | 4.56 | * Cousins |
| HD 82210 | 5.67 | 5.34 | 4.57 | 3.91 | 3.50 | - | 5.32 | - | 3.52 | 3.13 | * |
| HD 83632 | 10.93 | 9.44 | 8.05 | 7.03 | 6.28 | 10.68 | 9.43 | 8.12 | 7.20 | 6.53 | |
| HD 84937 | 8.50 | 8.71 | 8.32 | 7.92 | 7.64 | 8.15 | 8.66 | 8.36 | 7.92 | 7.59 | |
| HD 85235 | 4.70 | 4.62 | 4.59 | 4.49 | 4.49 | 4.87 | 4.84 | 4.60 | 4.51 | 4.59 | |
| HD 86728 | 6.28 | 6.02 | 5.37 | - | - | 6.26 | 6.03 | 5.34 | 4.79 | 4.41 | |
| HD 87141 | 6.27 | 6.23 | 5.75 | - | - | 6.35 | 6.24 | 5.70 | 5.26 | 4.95 | |
| HD 87696 | 4.73 | 4.66 | 4.48 | 4.30 | 4.23 | 4.77 | 4.68 | 4.49 | 4.28 | 4.17 | |
| HD 87737 | 3.25 | 3.46 | 3.49 | 3.40 | 3.38 | 3.02 | 3.39 | 3.47 | 3.35 | 3.25 | |
| HD 87822 | 6.69 | 6.68 | 6.24 | - | - | 6.70 | 6.69 | 6.22 | 5.80 | 5.53 | |
| HD 87901 | 0.88 | 1.25 | 1.36 | 1.39 | 1.49 | 0.80 | 1.23 | 1.40 | 1.40 | 1.40 | |
| HD 88355 | 6.92 | 6.90 | 6.44 | 6.03 | 5.76 | 6.82 | 6.90 | 6.45 | 6.06 | 5.81 | |
| HD 88609 | 9.94 | 9.52 | 8.59 | 7.79 | 7.16 | 10.13 | 9.50 | 8.52 | 7.77 | 7.25 | |
| HD 89025 | 3.94 | 3.75 | 3.44 | 3.13 | 2.94 | 3.97 | 3.75 | 3.42 | 3.11 | 2.91 | |
| HD 89254 | 5.70 | 5.60 | 5.28 | - | - | 5.57 | 5.60 | 5.58 | 5.52 | 5.56 | |
| HD 89758 | 6.52 | 4.63 | 3.05 | 1.77 | 0.81 | 6.38 | 4.75 | 3.01 | 1.86 | 0.98 | |
| HD 90277 | 5.16 | 4.99 | 4.74 | 4.48 | 4.34 | 5.20 | 4.99 | 4.66 | 4.37 | 4.24 | * |
| HD 90508 | 7.09 | 7.04 | 6.44 | 5.97 | 5.67 | 7.21 | 7.04 | 6.35 | 5.80 | 5.49 | * |
| HD 90537 | 5.76 | 5.12 | 4.21 | 3.52 | 3.06 | 5.81 | 5.13 | 4.20 | 3.59 | 3.16 | |
| HD 91316 | 2.76 | 3.71 | 3.85 | 3.89 | 4.05 | 2.55 | 3.82 | - | - | 4.26 | |
| HD 92769 | 5.77 | 5.68 | 5.51 | - | - | 5.77 | 5.69 | 5.49 | 5.28 | 5.11 | |
| HD 93250 | - | - | - | - | - | 6.54 | 7.53 | 7.41 | 7.15 | 7.03 | |
| HD 93430 | - | - | - | - | - | 10.01 | 10.05 | 9.57 | 9.16 | 8.85 | |
| HD 93765 | 6.40 | 6.43 | 6.06 | - | - | 6.43 | 6.43 | 6.03 | 5.68 | 5.46 | |
| HD 94028 | 8.52 | 8.70 | 8.23 | 7.76 | 7.46 | 8.47 | 8.69 | 8.24 | 7.82 | 7.51 | |
| HD 94247 | 7.97 | 6.45 | 5.09 | 4.49 | 4.00 | 8.09 | 6.45 | 5.10 | 4.14 | 3.61 | * Eggen |
| HD 94264 | 5.78 | 4.86 | 3.82 | 2.99 | 2.45 | 5.72 | 5.00 | 3.78 | 2.98 | 2.40 | |
| HD 95345 | 7.11 | 6.00 | 4.84 | 4.25 | 3.71 | 7.14 | 6.02 | 4.98 | 4.28 | 3.80 | Cousins |
| HD 95418 | 2.35 | 2.35 | 2.37 | 2.31 | 2.35 | 2.76 | 2.52 | 2.38 | 2.29 | 2.22 | |
| HD 95735 | 10.13 | 9.00 | 7.49 | 5.99 | 4.80 | 10.09 | 9.00 | 7.51 | 6.09 | 4.95 | |
| HD 97633 | 3.37 | 3.33 | 3.34 | 3.35 | 3.35 | 3.37 | 3.32 | 3.35 | 3.42 | 3.26 | |
| HD 97916 | 9.51 | 9.63 | 9.21 | 8.79 | 8.48 | 9.49 | 9.63 | 9.28 | 8.94 | 8.73 | |
| HD 98262 | 6.43 | 4.88 | 3.48 | 2.42 | 1.72 | 6.48 | 4.88 | 3.49 | 2.55 | 1.89 | |
| HD 98839 | 6.79 | 5.99 | 4.99 | 4.24 | 3.78 | 6.79 | 5.98 | 4.90 | 4.19 | 3.76 | |
| HD 99028 | 4.42 | 4.35 | 3.94 | 3.55 | 3.34 | 4.39 | 4.37 | 3.97 | 3.63 | 3.45 | |
| HD 99747 | 6.14 | 6.22 | 5.86 | - | - | 6.15 | 6.20 | 5.77 | 5.34 | 5.04 | |
| HD 100006 | 7.41 | 6.59 | 5.53 | 5.04 | 4.68 | 7.43 | 6.60 | 5.57 | 4.84 | 4.43 | * Eggen |
| HD 100889 | 4.47 | 4.62 | 4.70 | 4.69 | 4.76 | 4.44 | 4.65 | 4.78 | 4.78 | 4.77 | * |
| HD 101501 | 6.30 | 6.04 | 5.32 | 4.70 | 4.39 | 6.29 | 6.04 | 5.29 | 4.74 | 4.37 | |
| HD 101606 | 6.08 | 6.19 | 5.75 | 5.33 | 5.04 | 6.08 | 6.17 | 5.66 | 5.20 | 4.92 | * |
| HD 102212 | 7.34 | 5.54 | 4.03 | 2.77 | 1.76 | 7.30 | 5.57 | 4.17 | 3.11 | 2.20 | |
| HD 102224 | 6.04 | 4.89 | 3.71 | 2.83 | 2.23 | 6.05 | 4.90 | 3.72 | 2.91 | 2.33 | |
| HD 102634 | 6.73 | 6.66 | 6.14 | - | - | 6.59 | 6.67 | 6.26 | 5.93 | 5.74 | |
| HD 102870 | 4.26 | 4.16 | 3.61 | 3.18 | 2.90 | 4.70 | 4.11 | 3.65 | 3.28 | 3.07 | * |
| HD 102870 | 4.26 | 4.16 | 3.61 | 3.18 | 2.90 | 4.24 | 4.18 | 3.74 | 3.41 | 3.18 | * |
| photoelectric photometry | synthetic photometry from spectra | ||||||||||
| Star | U | B | V | R | I | U | B | V | R | I | comment |
| HD 104893 | 11.38 | 10.44 | 9.22 | - | - | 11.78 | 10.23 | 9.17 | 8.39 | 7.78 | |
| HD 105546 | - | - | - | - | - | 9.28 | 9.04 | 8.22 | 7.54 | 7.04 | |
| HD 106038 | - | - | - | - | - | 10.15 | 10.26 | 9.67 | 9.12 | 8.75 | |
| HD 107213 | 7.01 | 6.93 | 6.40 | - | - | 7.00 | 6.94 | 6.40 | 5.97 | 5.70 | |
| HD 108177 | 9.88 | 10.10 | 9.67 | 9.22 | 8.90 | 10.00 | 10.10 | 9.68 | 9.27 | 8.99 | |
| HD 109995 | 7.79 | 7.66 | 7.61 | - | - | 7.84 | 7.66 | 7.63 | 7.51 | 7.40 | |
| HD 110897 | 6.47 | 6.51 | 5.96 | 5.42 | 5.13 | 6.44 | 6.50 | 5.85 | 5.33 | 5.03 | * |
| HD 111028 | 7.43 | 6.65 | 5.66 | 5.20 | 4.87 | 7.43 | 6.67 | 5.70 | 5.03 | 4.69 | * Eggen |
| HD 112033 | - | - | - | - | - | 10.76 | 10.51 | 9.85 | 9.30 | 8.91 | |
| HD 113022 | 6.63 | 6.63 | 6.20 | 6.21 | 6.07 | 6.64 | 6.64 | 6.22 | 5.85 | 5.64 | * Eggen |
| HD 113139 | 5.31 | 5.30 | 4.93 | 4.56 | 4.35 | 5.54 | 5.31 | 4.80 | 4.36 | 4.09 | * |
| HD 113226 | 4.49 | 3.76 | 2.83 | 2.19 | 1.74 | 4.39 | 3.78 | 2.93 | 2.34 | 1.93 | |
| HD 113337 | 6.48 | 6.49 | 6.07 | - | - | 6.52 | 6.49 | 6.00 | 5.62 | 5.38 | |
| HD 114330 | 4.37 | 4.37 | 4.38 | 4.33 | 4.33 | 4.42 | 4.41 | 4.50 | 4.47 | 4.49 | * |
| HD 115383 | 5.89 | 5.79 | 5.21 | 4.88 | 4.57 | 5.90 | 5.81 | 5.28 | 4.85 | 4.56 | Cousins |
| HD 116842 | 4.26 | 4.18 | 4.01 | 3.84 | 3.77 | 4.34 | 4.18 | 3.90 | 3.63 | 3.48 | * |
| HD 117176 | 5.94 | 5.68 | 4.97 | 4.36 | 3.97 | 5.90 | 5.69 | 5.02 | 4.52 | 4.19 | |
| HD 120136 | 5.03 | 4.98 | 4.50 | 4.09 | 3.85 | 4.98 | 4.99 | 4.51 | 4.11 | 3.87 | |
| HD 122408 | 4.47 | 4.35 | 4.25 | 4.10 | 4.04 | 4.51 | 4.36 | 4.37 | 4.33 | 4.26 | |
| HD 122563 | 7.47 | 7.11 | 6.20 | 5.38 | 4.80 | 7.45 | 7.09 | 6.22 | 5.52 | 5.03 | |
| HD 123299 | 3.52 | 3.61 | 3.66 | 3.69 | 3.76 | 3.64 | 3.60 | 3.71 | 3.76 | 3.77 | |
| HD 124425 | 6.40 | 6.38 | 5.91 | - | - | 6.55 | 6.39 | 5.92 | 5.55 | 5.32 | |
| HD 124570 | 6.18 | 6.09 | 5.55 | - | - | 6.13 | 6.11 | 5.69 | 5.31 | 5.05 | |
| HD 124850 | 4.62 | 4.59 | 4.08 | 3.58 | 3.31 | 4.49 | 4.59 | 4.24 | 3.97 | 3.83 | |
| HD 125560 | 7.46 | 6.07 | 4.84 | 3.95 | 3.35 | 7.44 | 6.08 | 4.88 | 4.05 | 3.47 | |
| HD 126141 | 6.57 | 6.60 | 6.23 | - | - | 6.55 | 6.61 | 6.24 | 5.90 | 5.64 | |
| HD 126660 | 4.56 | 4.55 | 4.05 | 3.63 | 3.38 | 4.62 | 4.55 | 4.04 | 3.63 | 3.38 | |
| HD 127665 | 6.32 | 4.88 | 3.58 | 2.66 | 2.01 | 6.34 | 4.78 | 3.37 | 2.40 | 1.83 | * |
| HD 128167 | 4.74 | 4.82 | 4.46 | 4.12 | 3.93 | 4.68 | 4.79 | 4.32 | 3.89 | 3.62 | * |
| HD 130109 | 3.71 | 3.73 | 3.74 | 3.67 | 3.69 | 3.77 | 3.66 | 3.65 | 3.58 | 3.60 | |
| HD 130948 | 6.43 | 6.42 | 5.86 | 5.80 | 5.60 | 6.46 | 6.44 | 5.91 | 5.47 | 5.20 | * Eggen |
| HD 131156 | 5.61 | 5.33 | 4.56 | 3.93 | 3.50 | 5.52 | 5.34 | 4.82 | 4.26 | 3.74 | |
| HD 132142 | 8.90 | 8.56 | 7.78 | 7.11 | 6.66 | 9.02 | 8.57 | 7.69 | 7.03 | 6.95 | |
| HD 134083 | 5.33 | 5.36 | 4.93 | 4.53 | 4.32 | 5.29 | 5.36 | 4.90 | 4.49 | 4.21 | |
| HD 134169 | 8.14 | 8.22 | 7.69 | - | - | 8.19 | 8.22 | 7.69 | 7.21 | 6.93 | |
| HD 135722 | 5.10 | 4.43 | 3.48 | 2.75 | 2.24 | 5.10 | 4.43 | 3.46 | 2.79 | 2.31 | |
| HD 136512 | 7.29 | 6.52 | 5.51 | - | - | 7.32 | 6.53 | 5.57 | 4.89 | 4.40 | |
| HD 137759 | 5.68 | 4.46 | 3.29 | 2.51 | 1.91 | 5.86 | 4.47 | 3.30 | 2.55 | 2.04 | |
| HD 138290 | 6.87 | 6.93 | 6.56 | - | - | 6.89 | 6.94 | 6.59 | 6.26 | 6.04 | |
| HD 139641 | 6.64 | 6.15 | 5.26 | - | - | 6.67 | 6.16 | 5.33 | 5.64 | 4.48 | |
| HD 139669 | 8.43 | 6.54 | 4.96 | 3.93 | 3.06 | 8.61 | 6.58 | 5.12 | 4.18 | 3.58 | Eggen |
| HD 139798 | 6.09 | 6.11 | 5.76 | 5.43 | 5.25 | 6.17 | 6.12 | 5.76 | 5.45 | 5.37 | |
| HD 141004 | 5.13 | 5.03 | 4.43 | 3.92 | 3.60 | 5.11 | 5.04 | 4.49 | 4.05 | 3.78 | |
| HD 141714 | 5.78 | 5.42 | 4.62 | 3.99 | 3.57 | 5.76 | 5.43 | 4.88 | 4.29 | 3.72 | |
| HD 142373 | 5.19 | 5.18 | 4.62 | 4.14 | 3.82 | 5.15 | 5.17 | 4.58 | 4.09 | 3.78 | |
| HD 144206 | 4.32 | 4.64 | 4.74 | 4.72 | 4.82 | 4.32 | 4.60 | 4.62 | 4.51 | 4.44 | * |
| HD 145675 | 8.20 | 7.53 | 6.65 | - | - | 8.25 | 7.57 | 6.70 | 6.07 | 5.72 | |
| HD 145976 | 6.85 | 6.90 | 6.52 | - | - | 6.90 | 6.91 | 6.55 | 6.21 | 5.97 | |
| HD 146051 | 6.26 | 4.31 | 2.73 | 1.46 | 0.44 | 5.68 | 4.36 | 2.71 | 1.70 | 0.94 | |
| HD 147394 | 3.19 | 3.75 | 3.90 | 3.98 | 4.14 | 3.09 | 3.70 | 3.78 | 3.81 | 4.04 | |
| HD 148513 | 8.63 | 6.84 | 5.38 | 4.56 | 4.02 | 8.51 | 6.85 | 5.44 | 4.52 | 4.00 | Eggen |
| HD 149121 | 5.44 | 5.59 | 5.64 | - | - | 5.37 | 5.56 | 5.69 | 5.65 | 5.59 | |
| photoelectric photometry | synthetic photometry from spectra | ||||||||||
| Star | U | B | V | R | I | U | B | V | R | I | comment |
| HD 150275 | 8.04 | 7.34 | 6.35 | - | - | 8.61 | 7.37 | 6.36 | 5.66 | 5.23 | |
| HD 151044 | 7.03 | 7.01 | 6.48 | 6.04 | 5.78 | 7.04 | 7.01 | 6.41 | 5.95 | - | |
| HD 151217 | 8.60 | 6.68 | 5.14 | - | - | 8.44 | 6.71 | 5.26 | 4.15 | 2.30 | |
| HD 154733 | 8.38 | 6.86 | 5.56 | 4.90 | 4.43 | 8.29 | 6.88 | 5.61 | 4.76 | 4.32 | * Eggen |
| HD 155646 | 7.17 | 7.13 | 6.64 | - | - | - | - | 6.63 | 6.27 | - | |
| HD 156283 | 6.27 | 4.60 | 3.16 | 2.20 | 1.48 | - | - | 3.12 | 2.05 | - | |
| HD 157089 | 7.53 | 7.55 | 6.97 | 6.45 | 6.10 | - | - | 6.97 | 6.52 | - | |
| HD 157214 | 6.08 | 6.01 | 5.39 | 4.88 | 4.54 | 6.03 | 6.00 | 5.34 | 4.83 | 4.50 | |
| HD 157373 | 6.72 | 6.82 | 6.41 | - | - | - | - | 6.41 | 6.06 | 5.98 | * |
| HD 157856 | 6.86 | 6.89 | 6.43 | - | - | 6.31 | 6.71 | 6.44 | - | - | |
| HD 157881 | 10.16 | 8.90 | 7.54 | 6.24 | 5.44 | 10.26 | 8.99 | 7.68 | 6.65 | 5.98 | |
| HD 157999 | 7.43 | 5.83 | 4.33 | 3.23 | 2.46 | - | - | 4.30 | 3.31 | 2.35 | * |
| HD 159181 | 4.40 | 3.77 | 2.80 | 2.12 | 1.64 | - | - | 2.75 | 1.85 | 1.81 | |
| HD 159332 | 6.15 | 6.15 | 5.66 | - | - | - | - | 5.66 | 8.62 | - | |
| HD 160693 | 8.92 | 8.95 | 8.37 | 7.89 | 7.55 | - | - | 8.37 | - | - | |
| HD 161817 | 7.27 | 7.13 | 6.98 | 6.86 | 6.71 | 7.26 | 7.12 | 7.02 | 6.84 | 6.69 | Cousins |
| HD 163993 | 5.32 | 4.64 | 3.70 | 3.01 | 2.55 | 5.25 | 4.64 | 3.67 | 3.04 | 2.61 | |
| HD 164349 | 7.16 | 5.93 | 4.67 | 3.81 | 3.24 | 6.99 | 5.92 | 4.74 | 3.97 | 3.46 | |
| HD 164353 | 3.34 | 3.99 | 3.97 | 3.91 | 3.88 | 3.04 | 3.92 | 4.10 | 4.07 | 4.07 | * |
| HD 165908 | 5.48 | 5.57 | 5.05 | 4.57 | 4.23 | 5.19 | 5.50 | 5.04 | 4.63 | 4.64 | * |
| HD 166285 | 6.08 | 6.12 | 5.68 | - | - | - | - | 5.68 | 5.35 | 5.33 | * |
| HD 166620 | 7.87 | 7.28 | 6.40 | 5.63 | 5.14 | - | - | 6.39 | 5.70 | 5.42 | * |
| HD 167858 | 6.95 | 6.93 | 6.62 | - | - | - | - | 6.63 | 6.35 | 5.63 | |
| HD 172167 | 0.02 | 0.03 | 0.03 | 0.07 | 0.10 | 0.09 | 0.10 | - | - | - | |
| HD 173780 | 7.26 | 6.03 | 4.83 | 3.95 | 3.34 | - | - | 4.85 | - | - | |
| HD 173880 | 4.56 | 4.49 | 4.36 | 4.19 | 4.13 | - | - | 4.36 | 4.31 | 4.43 | * |
| HD 175305 | 8.08 | 7.93 | 7.18 | 6.53 | 6.04 | - | 7.89 | - | - | - | * |
| HD 175640 | 5.86 | 6.16 | 6.21 | - | - | 5.34 | 6.16 | 6.21 | 6.15 | 6.18 | |
| HD 176437 | 3.10 | 3.20 | 3.25 | 3.28 | 3.29 | 2.99 | 3.40 | 3.25 | 3.15 | 3.30 | * |
| HD 181470 | 6.17 | 6.25 | 6.26 | - | - | - | - | 6.27 | 6.18 | 6.39 | * |
| HD 182101 | 6.75 | 6.78 | 6.33 | 5.94 | 5.64 | - | - | 6.34 | 6.04 | 6.10 | * |
| HD 182490 | 6.36 | 6.32 | 6.25 | 6.19 | 6.17 | 5.90 | 6.36 | 6.26 | 6.19 | 6.49 | * |
| HD 184960 | 6.19 | 6.20 | 5.73 | 5.27 | 4.99 | - | - | 5.74 | - | - | |
| HD 185657 | 8.21 | 7.46 | 6.46 | - | - | - | - | 6.45 | - | - | |
| HD 188209 | 4.60 | 5.56 | 5.63 | 5.53 | 5.65 | 4.45 | 5.47 | 5.47 | 5.34 | 5.33 | |
| HD 188510 | 9.31 | 9.42 | 8.83 | 8.26 | 7.89 | - | 9.50 | 8.84 | 8.50 | 8.77 | |
| HD 195725 | 4.57 | 4.41 | 4.21 | 4.04 | 3.95 | - | - | 4.22 | - | - | |
| HD 195986 | 5.91 | 6.48 | 6.59 | - | - | - | - | 6.61 | - | - | |
| HD 197345 | 1.11 | 1.34 | 1.25 | 1.14 | 1.04 | - | - | 1.23 | 1.38 | - | |
| HD 268623 | 10.69 | 11.55 | 11.61 | - | - | 10.49 | 11.57 | 11.68 | 11.70 | 11.76 | |
| HD 268749 | 11.49 | 12.14 | 12.10 | - | - | 11.29 | 12.17 | 12.21 | 12.17 | 12.18 | |
| HD 268819 | 10.97 | 10.58 | 10.08 | - | - | - | 10.52 | 10.12 | 9.83 | 9.61 | |
| HD 269697 | 10.99 | 10.69 | 10.28 | - | - | 11.31 | 10.65 | 10.34 | 10.12 | 9.93 | |
| HD 269698 | 11.01 | 12.04 | 12.26 | - | - | 10.76 | 12.07 | 12.34 | 12.39 | 12.52 | |
| HD 269781 | - | 9.96 | 9.89 | 9.76 | 9.69 | 9.21 | 9.97 | 9.95 | 9.89 | 9.82 | * |
| HD 271163 | 10.98 | 11.68 | 11.75 | - | - | 10.80 | 11.70 | 11.83 | 11.84 | 11.91 | |
| HD 271182 | 10.74 | 10.29 | 9.70 | 9.17 | 8.86 | - | 10.21 | 9.63 | 9.27 | 9.06 | * |
| HD 338529 | 9.53 | 9.75 | 9.36 | 8.95 | 8.62 | 10.12 | 9.86 | 9.36 | 8.99 | 9.02 | * |
| Feige110 | 10.35 | 11.51 | 11.82 | - | - | 10.25 | 11.57 | 11.91 | 12.04 | 12.27 | |
| G319 | - | - | - | - | - | 13.17 | 12.71 | 12.58 | 12.47 | 12.35 | |
| LTT4364 | - | - | - | - | - | 10.72 | 11.64 | 11.49 | 11.39 | 11.30 | |