Far-UV FUSE Spectra of Peculiar Magnetic Cataclysmic Variables
Abstract
We present far-UV spectra of the three magnetic cataclysmic variables (MCVs) BY Cam, V1309 Ori and AE Aqr obtained with the FUSE satellite. These MCVs have revealed strongly unusual NV and CIV UV resonance lines. The FUSE spectra exhibit broad OVI lines as well as a strong NIII line at 991Å, while the CIII 1175Å line is nearly absent, supporting non-solar CNO abundances of the accreting matter in these sources. The spectrum of BY Cam shows molecular H2 lines which might be of circumstellar nature. The flaring activity of AE Aqr is also observed in the far-UV range. The radial velocities of the broad OVI components in AE Aqr are orbitally modulated and would indicate an emission region close to the magnetosphere.
1Observatoire de Paris, 5 Place J. Janssen, 92190 Meudon, F
2DAPNIA/Service d’Astrophysique,CEA-Saclay, Gif-sur-Yvette, F
3Universtäts-Sternwarte, Göttingen, D
4Osservatorio Astronomico Capodimonte, Naples, I
5Institut d’Astrophysique de Paris, Paris, F
6Braeside Observatory, Flagstaff, AZ, USA
7Department of Physics and Astronomy, University of Southampton, UK
8Astrophysics Group, Planetary Science Institute, Tucson, AZ, USA
9NASA Goddard Space Flight Center, Greenbelt, MD, USA
10Max-Planck-Institut f r Extraterrestrische Physik, Garching, D
11Department of Astronomy, University of Washington, Seattle, WA, USA
1. Introduction
Among magnetic cataclysmic variables (MCV), three Polars (BY Cam, V1309 Ori, MN Hya) and one intermediate polar (AE Aqr) have been discovered to exhibit very peculiar NV and CIV UV resonance line intensities, with a NV/CIV ratio much greater than the typical value 0.5 (Bonnet-Bidaud & Mouchet 1987 (BM87), Skzody & Silber 1996, Schmidt & Stockman 2001, Jameson et al. 1980). Anomalous UV line strengths might result from non-solar abundances in the accreting matter or from peculiar ionization conditions in the emitting regions (BM87, Mouchet et al. 2003). In order to have access to the OVI resonance lines at 1032-1038Å, we obtained FUSE spectra of three of these sources, BY Cam, V1309 Ori and AE Aqr.
In addition to these abnormal UV line intensities, all three sources exhibit peculiarities. BY Cam is enigmatic in several respects, being slightly de-synchronized, and possessing a very high hard X-ray-to-optical luminosity ratio (Kallman et al. 1996). Among more than fifty Polars, only five, including the nova magnetic system V1500 Cyg, have been found to be slightly de-synchronized. BY Cam has two close periods near 3.3 h that differ by only 1% (Silber et al. 1992, Mouchet et al. 1997). V1309 Ori is also very peculiar, having the longest orbital period for a Polar (P h, Garnavich et al. 1994, Walter et al. 1995), revealing a very high soft-to-hard X-ray luminosity ratio and a strong flaring X-ray variability (Walter et al. 1995, de Martino et al. 1998). AE Aqr exhibits several unique properties (see e.g. detailed introduction in Welsh et al. 1998). It has been detected in all energy bands, from TeV to radio wavelengths. This binary displays a wide range of variability, both coherent and incoherent, on various timescales. The spin period of the white dwarf (33 s) is the fastest among IPs and the spin-to-orbital period ratio (33s/9.88h 10-3) is the smallest. Strong aperiodic recurrent flares of about one-hour duration have been recorded in all wavelength bands. To account for this strong variability and a very low X-ray luminosity, Wynn et al. (1997) proposed that the gas flow consists of blobs which are propelled out of the system by the rapidly rotating magnetosphere.
2. Average FUSE spectra
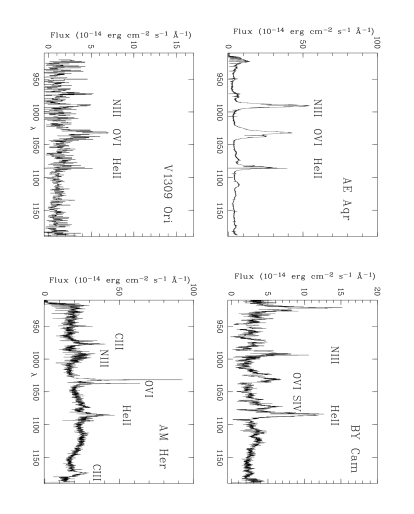
Far UV observations at high spectral resolution in the range 905-1185Å have been performed with the FUSE satellite using the time-tag mode and the large aperture () (Moos et al. 2000). Total exposure times of 20 ks, 12 ks and 40 ks split into 5, 5 and 14 exposures were obtained respectively for BY Cam, V1309 Ori and AE Aqr. The spectra of BY Cam mostly acquired during “day time” are strongly affected by geocoronal lines.
The average spectra obtained by combining all detectors and exposures are reported in Fig.1 where the strongest geocoronal lines have been removed. For comparison the FUSE average spectrum of AM Her (Hutchings et al. 2002) retrieved from the archives, is also plotted. The level of the continuum is consistent with the extrapolation of the power law fitting the IUE or HST spectra obtained during high states of accretion for the two polars, and during quiescent states for AE Aqr. Broad emission lines are present, including the resonance doublet OVI and strong lines of HeII and NIII. Note the absence of the CIII 1175Å line and the weakness of CIII at 975Å. Interstellar lines of ArI, FeII and SiII are detected in BY Cam, and of HI, CII, OI and NII in AE Aqr. Pronounced H2 molecular lines are also clearly present in the spectrum of BY Cam (see Section 3). Contrary to AM Her, a narrow component in the OVI line is not seen in BY Cam, and is much weaker in AE Aqr, while the spectrum of V1309 Ori is too noisy to distinguish several components in the OVI profile. The dereddened total OVI line intensities are respectively of 2.510-13, 410-13 and 2710-13 erg s-1 cm-2 for BY Cam, V1309 Ori and AE Aqr. In the case of BY Cam, the redward component of the doublet is strongly affected by the presence of H2 molecular lines. We have derived the flux of this line taking into account this strong absorption (Mouchet et al. 2003). A modelisation of the resonance UV CNO lines measured in BY Cam is presented in Bonnet-Bidaud & Mouchet (these proceedings).
3. H2 molecular lines in BY Cam
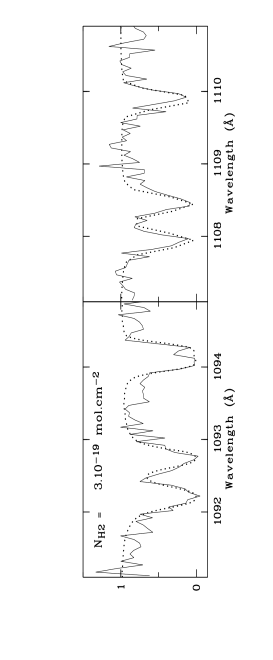
Several H2 absorption lines of the Lyman and Werner bands are clearly detected in the average FUSE spectrum of BY Cam. The equivalent width measurements of the strongest H2 lines absorbed from the J=0, 1, and 2 levels in the v’-0 Lyman bands with v’ = 0 to 4, have been compared with those of models computed for specific values of the total column density, a temperature of 80 K and a Doppler factor of 10 km s-1, using recent molecular data given by Abgrall et al. (2000). A best fit value is obtained for a H2 column density N of molecules cm-2. This model for the first lines of the Lyman (0,0) and (1,0) bands is displayed in Fig.2, together with the corresponding parts of the observed spectrum. From the absorption bump around 2200 Å, an upper limit of E 0.05 has been derived for the source (BM87), which corresponds to a neutral H density N cm-2 (Shull & Van Steenberg 1985). This value is consistent with the equivalent neutral H column density N cm-2 derived from the absorption cut-off in the X-ray spectra (Kallman et al. 1996). This implies a very high N/N ratio in the direction of the source, which is unexpected for a relatively nearby source. It may be due to the presence of a molecular cloud in the line of sight but it may also be linked with dense matter close to the source, possibly ejected during a prior nova event. Note that such H2 absorption has also being detected in the FUSE spectra of the supersoft binary QR And and may originate in a circumbinary location (Hutchings et al. 2001).

4. Far-UV variability of AE Aqr
We obtained 14 spectra of AE Aqr with exposure times in the range 2500 s () to 3400 s (). They are regularly spaced, covering 2.2 orbital cycles. In order to describe the OVI doublet, the profile has been fitted using one narrow ( 450 km s-1) and one broad ( 1300 km s-1) gaussian for each component. Such components could not be detected in the HST low resolution spectra (Eracleous & Horne 1996). Another broad component has also been added to take into account the Ly contribution as well as an absorption contribution for the interstellar CII line at 1036Å. All phases quoted below refer to Casares et al. (1996) ephemeris with zero phase defined as the time at which the secondary is closest to the observer (blue-to-red crossing of the secondary absorption line radial velocities).

4.1. Flaring activity
In Fig. 3 the continuum measured at 1010Å is plotted versus the OVI line intensity and the OVI line profiles of the 14 spectra are displayed in Fig. 4. A large flare occurs at =1.94, with an increase by a factor 9 in the continuum flux and 5 in the OVI line flux. The line width is also enhanced up to 2400 km s-1. Both broad and narrow components are more intense and wider. A possible delay between the lines and the continuum, as observed in the optical, but not in the HST data, will be investigated by reconstructing spectra at higher temporal resolution. In addition the continuum and line fluxes increase by a factor 1.5-2 during four other exposures ( = 0.41, 1.60, 1.77, 2.60). These moderate flares are quite similar to those observed in the UV range with IUE (de Martino et al. 1995).
4.2. Search for orbital variability
The continuum flux of the remaining nine quiescent spectra shows a
weak tendency for a minimum at phase 0.0, similar to the optical light
curve. The narrow component intensity also tends to be lower at this
phase, while the broad component flux does not show any regular
orbital modulation.
The radial velocities (RVs) have been derived for all components used to
describe the OVI profile.
While the interstellar CII RVs are stable
(dispersion less than 5 km s-1), those of the OVI broad components
are modulated.
The corresponding sinusoidal parameters
are K = 192 km s-1, km s-1
and where is the blue-to-red
crossing phase. Note that the RV of the flare spectrum does not depart from
the orbital modulation.
These values are marginally consistent with those obtained for the UV
lines (K 110-330 km s-1, 0.62-0.73,
Eracleous & Horne 1996). However they contrast with the X-ray line RVs
which exhibit a much larger amplitude (see Osborne & Wynn these proc.).
The RV measurements of the narrow component show much scatter with a
value close to 0, indicating an emitting region in phase with
the secondary motion, such as the irradiated hemisphere of the companion.
The exact location cannot be ascertained without a precise evaluation of the
K and velocities.
While the phasing and the RV amplitude of the broad OVI components are
consistent with
blobby gas having passed the closest approach to the white dwarf
(Wynn et al. 1997), the large width of the
OVI line would require a significant contribution of
individual blobs at high velocities. Such blobs are not predicted
in large numbers by the propeller-driven collisional model (Welsh, Horne
& Gomer 1998). Besides such high velocities are easily reached close to
the magnetosphere radius.
In addition, the UV line intensities can be accounted for by material
collisionally heated
at temperatures 5 105 K, however with a non-solar chemical
composition (Mouchet et al. in prep.). Such abundances can be obtained as
the result of nuclear evolution of the donor in the framework of evolutionary
models in which AE Aqr would descend from a
supersoft X-ray binary (Schenker et al. 2002, and these proc.)
Acknowledgments.
We are very grateful to Sandrine Maloreau for her participation in the reduction and analysis of the AE Aqr spectra.
References
Abgrall, H., Roueff, E., Drira, I. 1000, A&AS, 141, 297
Bonnet-Bidaud, J.M., Mouchet, M. 1987, A&A, 188, 89
Casares, J., Mouchet, M., Martinez-Pais, I., Harlaftis, E.T. 1996, MNRAS, 282, 182
Eracleous, M., Horne K. 1996, ApJ, 471, 427
Garnavich, P.M., Szkody, P., Robb, R.M., Zurek, D.R., Hoard, D.W. 1994 ApJ, 435, L141
Hutchings, J.B., Crampton, D., Cowley, A.P., Schmidtke, P.C., Fulleton, A.W. 2001, AJ, 122, 1572
Hutchings, J.B., Fullerton, A.W., Cowley, A.P., Schmidtke, P.C. 2002, AJ, 123, 2841
Jameson, R.F., King, A.R., Sherrington, M.R. 1980, MNRAS, 191, 590
Kallman, T.R., Mukai, K., Schlegel, E.M., et al. 1996, ApJ, 466, 973
de Martino, D., Wamsteker, W., Bromage, G. 1995, in proc. of the “Cape Workshop on Magnetic Cataclysmic Variables”, eds D.A.H. Buckley and B. Warner A.S.P. Conf. series 85, 388
de Martino, D., Barcaroli, R., Matt, G. et al. 1998, A&A, 332, 904
Moos, H.W., Cash, W.C., Cowie, L.L. et al. 2000, ApJ, 538, L1
Mouchet, M., Bonnet-Bidaud, J.M., Roueff, E. et al. 2003, A&A, submitted
Mouchet, M., Bonnet-Bidaud, J.M., Somov, N.N., Somova, T. A. 1997, A&A, 324, 109
Schenker, K., King, A.R., Kolb, U., Wynn, G.A., Zhang, Z. 2002, MNRAS, 337, 1105
Schmidt, G.D., Stockman, H.S. 2001, ApJ, 548, 410
Shull, J.M., Van Steenberg, M.E. 1985, ApJ, 294, 599
Silber, A., Bradt, H.V., Ishida, M. et al. 1992, ApJ, 389, 704
Szkody, P., Silber, A. 1996, AJ, 112, 239
Walter, F.M., Wolk, S.J., Adams, N.R. 1995, ApJ, 440, 834
Welsh, W.F., Horne, K., Gomer, R. 1998, MNRAS, 298, 285
Wynn, G.A., King, A.R., Horne, K. 1997 MNRAS, 286, 436