AN XMM-NEWTON OBSERVATION OF 4U1755-33 IN QUIESCENCE: EVIDENCE FOR A FOSSIL X-RAY JET
Abstract
We report an XMM-Newton observation of the Low mass X-ray Binary (LMXB) and black hole candidate 4U1755-33. This source had been a bright persistent source for at least 25 yrs, but in 1995 entered an extended quiescent phase. 4U1755-33 was not detected with an upper limit to the 2–10 keV luminosity of ergs s-1(where is the distance in units of 4 kpc) – consistent with the luminosity of other black hole candidates in a quiescent state. An unexpected result is the discovery of a narrow long X-ray jet-like feature centered on the position of 4U1755-33. The spectrum of the jet is similar to that observed from other galactic and extragalactic jets thought to be associated with accreting black holes. The detection of a fossil jet provides additional evidence supporting the black hole candidacy of 4U1755-33. The spectral properties of three bright serendipitous sources in the field are reported and it is suggested these are background active galactic nuclei (AGN).
1 Introduction
The LMXB 4U1755-33 had been a permanent feature of the X-ray sky since its discovery in the first all-sky X-ray survey by the Uhuru satellite in 1970 (Giacconi et al 1974), with a typical flux of Jy. An observation by RXTE in January 1996 revealed that 4U1755-33 had turned off, with an upper limit to a flux of 1 Jy (Roberts et al. 1996). The RXTE all sky monitor shows it has been quiescent since then, to the time of writing. 4U1755-33 has an orbital period of 4.4 hr, which was established from regular periodic dipping in the X-ray lightcurve (White et al. 1984), and confirmed in photometric variations in the 18–19 magnitude optical counterpart V4143 Sagittarii (Mason, Parmar & White 1985). Since the X-ray source turned off, the optical counterpart became fainter than V 22 (Wachter & Smale 1998).
When it was active 4U1755-33 was noted for having an ultrasoft X-ray spectrum, similar to that of black hole candidates (White & Marshall 1984, White et al. 1984). The spectral evidence for the compact object being a black hole was further strengthened when broad band observations revealed a hard X-ray tail, again similar to that seen in other black hole systems (Pan et al. 1995). However, the possibility that a neutron star might mimic this spectral signature has not been ruled out (see e.g. Seon et al. 1995 and references therein).
The study of LMXBs during quiescence, when the luminosity is a factor of 1 million or more fainter than the peak, has become an important tool to investigate the nature of the compact object and the physics of the accretion process (see e.g. Garcia et al. 2000). Observations with ASCA, Beppo-SAX and ROSAT were the first to detect faint emission from these LMXBs in quiescence with a luminosity of typically ergs s-1 with fluxes of ergs cm-2 s-1 (e.g. Menou et al. 1999). The luminosity of systems thought to contain a black hole appears to be significantly fainter than systems thought to contain a neutron star (e.g. Menou et al. 1999). This lower luminosity of the black hole systems has been attributed as due to the lack of a solid surface on the compact object and used as supporting the existence of the black hole event horizon (e.g. Garcia et al. 2000). These systems are also used to test models for the accretion disk emission e.g. the Advection Dominated Accretion Flow (ADAF) model (Narayan, McClintock & Yi 1996).
With the advent of XMM-Newton and Chandra it is possible to extend these studies using more sensitive observatories (e.g. Hameury et al 2002). In this paper we present the results of an observation of 4U1755-33 in its quiescent state using the European Space Agency’s XMM-Newton Observatory (Jansen et al 2001).
2 Results
2.1 The Observation
4U1755-33 was observed by the XMM-Newton observatory on March 3, 2001 starting at 05:13 hr UT and ending at 10:30 hr. XMM-Newton has three X-ray telescopes with two different types of CCD arrays in each focal plane. Two CCD cameras use MOS arrays and one a PN array. The data were processed using XMM-Newton Science Analysis System (SAS) version 5.3.3. Images were accumulated from the cleaned event files selecting good events as recommended in the users guide. Images were made for each CCD camera in the 0.5–4.5 keV band, 6.2–6.8 keV iron band and 0.5–10 keV band. The good time exposure in each camera was: MOS-1=18127s, MOS-2=18107s and PN=15359s.
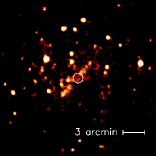
The three images in the 0.5–4.5 keV band were summed together and the total image is shown in Figure 1. The position of 4U1755-33 is at the center of the image, and is marked with a circle. While many sources are seen in the image, there is none at the position of 4U1755-33. A striking aspect of the image is a long jet-like feature of extended emission that passes through the position of 4U1755-33. There are several bright spots embedded in the extended emission, in particular on the southern side.
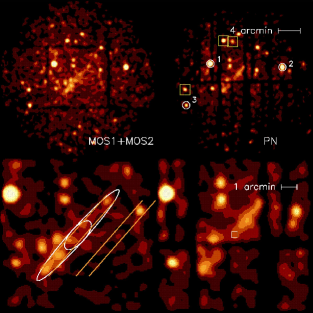
To examine the region around 4U1755-33 in more detail in Figure 2 we show the individual images from the PN camera and the summed MOS cameras for the 0.5–10 keV band. The lower two images zoom in on the position of 4U1755-33. We separate the MOS and PN cameras so that the gaps in the image caused by CCD chip boundaries or bad columns can be seen. The position of 4U1755-33 is marked on the PN image.
2.2 4U1755-33 in Quiescence
An upper limit to the flux from 4U1755-33 was obtained by selecting an optimum sized region around the source. A circle of radius 7 arc sec was used to minimize the contribution from the extended emission, this includes about 45% of the telescope point spread function (PSF). Because of the different energy response of the two types of CCD cameras and different coverage across the CCD we separately estimated an upper limit for the summed MOS and the PN images. By taking many different backgrounds across the image an average background count rate was estimated and found to be similar to the count rate at the position of 4U1755-33.
A three sigma upper limit was derived from the count rate in the source box using the statistics method described by Gehrels (1986). The upper limits derived for the summed MOS and PN are count/s and count/s in the 0.5–2 keV and count/s and count/s in the 2–10 keV bands. This was then corrected by a factor of 2.2 to correct for the portion of the telescope point spread function not included in the circle.
The corresponding flux level depends on the assumed spectrum. When active the spectrum of 4U1755-33 had a characteristic temperature of 2 keV and an equivalent hydrogen column density of cm-2 (White et al. 1984). The distance to 4U1755-33 is very uncertain with estimates ranging from 4 to 9 kpc (see Wachter and Smale 1998). Table 1 summarizes the various flux upper limits for the MOS and PN, using a bremsstrahlung model for two temperatures of 2 and 10 keV. The latter temperature is representative of other transient black hole systems detected in quiescence (e.g. Narayan et al. 1996). These upper limits are corrected for any attenuation by interstellar absorption. The MOS gives the most restrictive upper limits, which for the 2–10 keV band corresponds to ergs s-1 (where is the distance in units of 4 kpc) assuming a 10 keV spectrum.
The ratios of the quiescent luminosity to the peak luminosity and the Eddington luminosity are other useful parameters to compare the relative activity across systems (e.g. Menou et al. 1999). This has been applied to transient systems, where there is well defined peak luminosity. For a steady source such as 4U1755-33 it is less clear that this is a meaningful parameter.
2.3 Extended Emission
The extended streak of emission centered on 4U1755-33 is suggestive of a two-sided jet ejected from this X-ray binary when it was active. Profiles along the extended emission were made by slicing the MOS image along the jet-like feature, and for comparison also along an offset position. These are shown in Figure 3 (the regions used are indicated in Figure 2). The bright point source seen passing through the lower slice gives a reference as to the size of the XMM-Newton telescope point spread function (PSF). The bright knots on the left side of 4U1755-33 appear somewhat broader than the PSF of the telescope, suggesting that they are not point sources.
Spectra were extracted from the MOS detectors for two different sized regions along the extended feature, centered on the position of 4U 1755-33, as indicated in Figure 2. A background spectrum was accumulated from a source free region parallel to the jet. The summed MOS spectra were fit to a number of different models: power law, thermal bremsstralung and a MEKAL plasma model. The statistics are poor and an acceptable fit is found for all three models. The PN camera has less uniform coverage because of gaps between the CCDs and bad columns, and was not used for the larger region.
For the inner region the best fit is a photon index of with an equivalent Hydrogen column density of cm-2 or if the column density is fixed to be cm-2, the interstellar value in that direction predicted from the HI map by Dickey & Lockman (1990), the photon index is . The bremsstralung and MEKAL models are poorly constrained with kT 0.7 keV and 1.7 keV respectively, even when the absorption is fixed at the interstellar value. Fitting together the MOS and PN spectra for this region give similar and consistent spectral fits. The summed MOS spectrum from the larger region gives a power law photon index of and an absorption of cm-2 with an unabsorbed 0.5–2 keV flux of ergs cm-2 s-1. If the absorption is fixed at the interstellar value gives a photon index of . The best fit bremsstralung model for the larger region gives a kT 4 keV. In Figure 4 the sum of the MOS spectra for the larger region is shown with the best fitting power law model for the inner region. There is a suggestion that the spectrum of the larger region has a high energy excess, perhaps from contaminating unresolved sources.
2.4 Bright Serendipitous Sources
There are many faint sources in the field, that previously would have been hard to detect when the bright X-ray binary was active, because of scattering in the telescopes. Three of these field sources stand out in the iron band image and these are indicated with circles in Figure 2. To investigate these sources we extracted PN spectra (because this detector has a harder response). The three spectra are shown in Figure 5. They are quite different, with source 1 (R.A.(J2000)= Dec(J2000)=) displaying a prominent iron K line, source 2 (R.A.(J2000)= Dec(J2000)= ) a steeper featureless spectrum and source 3 (R.A.(J2000)= Dec(J2000)= ) showing strong absorption. We summarize the spectral fits to a power law model in Table 2.
Three sources were previously detected from ROSAT observations, when 4U1755-33 was active and they are marked in Fig 2 with squares. These three ROSAT sources were the brightest sources after 4U1755-33 reported in the WGACAT ROSAT source catalog for this field (1WGA J1758.6-3341, 1WGA J1758.8-3341 and 1WGA J1759.3-3350). There were about eight other fainter detections reported in WGACAT that do not appear in the XMM-Newton image – we ascribed these to false detections generated by the scattered light from 4U1755-33.
Two of the three new ”iron band” sources in the XMM-Newton image are absorbed and would not have been detected by ROSAT which had a soft 2 keV spectrum. Source 2 should have been detected by ROSAT and examining the ROSAT PSPC field there is a faint source at this position with a 0.1–2 keV band count rate of 0.005 ct/s, consistent with that predicted.
The ASCA source counts (e.g. Kushino et al. 2002) predict in the 2–10 keV band 10 sources per square degree ergs cm-2 s-1. The XMM-Newton field of view covers 0.25 square arc min, so 2–3 extragalactic sources above this flux is consistent the observation of 3 sources. While perhaps one of these sources might be galactic, it seems likely that at least two and probably all three are background AGN.
3 A Fossil Jet from 4U1755-33
The XMM-Newton image of the region surrounding 4U1755-33 reveals a 7 arc minute long jet-like structure, centered on the position of the LMXB. This is very suggestive that the jet was ejected from 4U1755-33 when it was X-ray active. 4U1755-33 is located at l=357o and b=-4.8o, i.e. well off the galactic plane. The X-ray dipping seen from this source indicate it is observed close to the orbital plane and so the jets would be expected to be symmetric, as observed. The jet runs at an angle of to the galactic plane, so it is unlikely to be associated with the galactic ridge.
Another possibility is that the emission is a scattering halo from dust intervening between the source. To produce such a narrow ridge would require a rather unusual geometry for the intervening material. The spectrum of a scattering halo would have a spectral index steeper by unity than that of the source (Xu, McCray & Kelley 1986). The spectrum of 4U1755-33 when it was active was very steep, with an equivalent photon index of order 4 (White et al 1984) – the opposite of that observed in the extended emission.
X-ray emission from jets has been observed by the Chandra X-ray observatory from many black hole systems, both galactic and extra-galactic. The spectra of these jets are typically power laws with a photon index ranging from 1.5 – 2.2 (e.g. Kaaret et al. 2002; Siemiginowska et al 2002; Wilson and Yang 2002), suggesting that non-thermal processes dominate. However, the jet from SS433 shows line emission indicating a hot gas with a temperature of to K. This should adiabatically cool along the jet (e.g. Brinkmann et al 1991), which is not seen from the 4U1755-33 jet, although recent Chandra observations demonstrate reenergization of the SS433 jet maybe possible (Migliari, Fender & Mendez 2002).
The quality of the 4U1755-33 jet spectra is not high enough to distinguish thermal or non-thermal models. When fit with a power law the 4U1755-33 jet has a photon index of 1.5 to 1.9, consistent with that measured from other galactic and extra-galactic jets. The knots in the 4U1755-33 jet are also very reminiscent of similar features seen in other X-ray jets (e.g. Wilson & Yang 2002). If 4U1755-33 is at a distance of 4 kpc, then a 3.5 arc min long jet corresponds to 4 pc. If the jet has a velocity of close to the speed of light, then it would take yr to expand to this length – consistent with the 25 yr active phase of 4U1755-33. If the jet is no longer being fed since the source has been quiescent, then we might expect to see a hole developing centered on 4U1755-33 and indeed there is some evidence for such a feature (Figure 1).
4 Discussion & Conclusions
The XMM-Newton observation reported here did not detect any quiescent emission from 4U1755-33. The upper limit to the source luminosity depends on the assumed spectrum and distance. If the source is at the lower end of the assumed ranges (a distance of 4 kpc and temperature of 2 keV) then the upper limit of ergs s-1 is comparable to other black hole transients in quiescence with similar orbital periods (Lasota & Hameury 1998; Narayan, Garcia & McClintock 2002), which would strengthen the black hole candidacy of 4U1755-33. If the distance is as far as 9 kpc and the underlying spectrum 10 keV, then the upper limit to the luminosity of ergs s-1 starts to overlap the area where both neutron stars and black holes accreting at low accretion rates are found (see Figure 4 in Lasota & Hameury 1998).
The transition of 4U1755-33 into a quiescent state has allowed the surrounding region to be studied in detail. A surprising result from this observation has been the detection of a faint extended X-ray jet that appears to have been ejected from 4U1755-33 . Jets are a common feature of black hole candidates in our galaxy and in AGN, and this result provides more circumstantial evidence that 4U1755-33 contains a black hole. The several parsec extent of the jet is consistent with a source that has been active for more than 25 yrs. Sensitive radio observations should be made to search for a radio counterpart to the X-ray jet. Future X-ray observations will confirm the jet nature of this feature by observing the expansion of the knots and the central hole. This will provide a rare opportunity to test jet propagation models.
5 Acknowledgements
We acknowledge the XMM-Newton science survey center staff Mike Watson and Wolfgang Pietsch for their insight and suggestions regarding these data.
6 References
-
Brinkmann W., Kawai, N., Matsuoka, M. and Fink, H. H. 1991, A&A, 241, 112.
-
Dickey, J. M. & Lockman F. J., 1990, Ann. Rev. Ast. Astr., 28, 215.
-
Garcia, M.R., McClintock, J.E., Narayan, R., Callanan, P. and Murray, S.M. 2000, ApJ, 553, L47.
-
Geherls, N.,1986, ApJ, 303, 336.
-
Giacconi, R., Murray, S., Gursky, H., Kellogg, E., Schreier, E., Matilsky, T., Koch, D. and Tananbaum, H. 1974, ApJS, 27, 37.
-
Hameury, J.-M., Barret, D., Lasota, J.-P., McClintock, J.E., Menou, K., Motch, C., Olive, J.-F., and Webb, N., 2002, A&A, in press.
-
Jansen, F., Lumb, D., Altieri, B., Clavel, J., Ehle, M., Erd, C., Gabriel, C., Guainazzi, M., Gondoin, P., Much, R., et al 2001, A&A, 365, L1.
-
Kaaret P., Corbel, S., Tomsick J.A., Fender, R., Miller, J.M., Orosz, J.A., Tzioumis, A.K. and Wijnands, R. 2002, astro-ph/0210401.
-
Kushino, A., Ishisaki, Y., Morita, U., Yamasaki, Y., Ishida, M., Ohashi, T., and Ueda, Y. 2002, PASJ, 54, 327
-
Lasota, J.-P. and Hameury, J.-M, 1998, proceeding of “Accretion Processes in Astrophysical Systems: Some Like it Hot!”, College Park, MD, October 1997, eds S. S. Holt and T. R. Kallman, AIP Conference Proceedings 431., 351.
-
Mason, K.O., Parmar, A.N. & White, N.E. 1985, MNRAS, 216, 1033.
-
Menou, K., Esin, A.A., Narayan, R., Garcia, M.R., Lasota, J.-P., and McClintock, J.E. 1999, ApJ520 276
-
Migliari, S., Fender, R., and Mendez, M. 2002, Science 297, 1673.
-
Narayan, R., McClintock, J.E., & Yi, I., 1996, ApJ, 457, 821.
-
Narayan, R., Garcia, M.R., & McClintock, J.E. 2002. Proc. IX Marcel Grossman Meeting, Eds V. Gurzadyan, R. Jantzen and R. Ruffini, Singapore: World Scientific Press, astro-ph/0107387.
-
Pan, H.C., Skinner, G. K., Sunyaev, R. A. and Borozdin, K. N. 1995, MNRAS, 274, 15P.
-
Roberts, M. S. E., Michelson P. F., Cominsky, L. R., Marshall F. E. , Corbet R. H. D., and Smith E. A. 1996, IAUC 6302.
-
Seon, K., Min, K., Yoshida, K., Makino, F., van der Klis, M., van Paradijs, J., and Lewin, W. 1995, ApJ, 454, 463.
-
Siemiginowska A., Bechtold, J., Aldcroft, T. L., Elvis, M., Harris, D. E. and Dobrzycki, A. 2002 570, 543-556
-
Wilson A. S., and Yang Y. 2002, ApJ, 568, 133.
-
Wachter, S. and Smale, A.P., 1998, ApJ, 496, 21.
-
White, N.E. and Marshall, F.E., 1984, ApJ, 281, 354.
-
White, N.E., Parmar, A. N., Sztajno, M., Zimmermann, H. U., Mason, K. O. and Kahn, S. M. 1984, ApJ, 283, L9.
-
Xu, Y., McCray, R., and Kelley, R. 1986, Nature 319, 652.
| Table 1: Flux & Luminosity upper limits | |||||
|---|---|---|---|---|---|
| Flux | Luminosity | ||||
| Instrument | Temperature | 0.5-2 | 2-10 | 0.5-2 | 2-10 |
| keV | ergs cm-2 s-1 | ergs cm-2 s-1 | ergs s-1 | ergs s-1 | |
| MOS | 2 | ||||
| PN | 2 | ||||
| MOS | 10 | ||||
| PN | 10 | ||||
| Table 2: Spectral Parameters of the Serendipitous XMM-Newton Sources | |||||||
|---|---|---|---|---|---|---|---|
| Absorbed Flux | Line | ||||||
| Source | Index | NH | 0.5-2 | 2-10 | 5-10 | Energy | EQW |
| cm-2 | ergs cm-2 s-1 | ergs cm-2 s-1 | ergs cm-2 s-1 | keV | eV | ||
| 1 | 876 | ||||||
| 2 | |||||||
| 3 | 1.7 a | ||||||
a Power law index keept fixed