The far infrared CO line emission of Orion BN/KL
Abstract
We present observations of the closest region of high mass star formation, Orion BN/KL, performed at both low resolution mode (grating mode) and high resolution (Fabry-Pérot mode) with the Long Wavelength Spectrometer (LWS) on board the Infrared Space Observatory (ISO). We detected the CO rotational transitions from Jup= 15 to Jup = 49. A LVG analysis of the line fluxes allows to distinguish three main physical components with different temperatures, densities and column densities. Our analysis yields to conclude than J15 arise from the photodissociation region (PDR), the emission between Jup= 20 and 30 arise from the high velocity outflow (plateau), and Jup 32 arises from a hot and dense gas component. The latter exhibits broadened lines for the levels Jup 32 and is thought to be due to shocked gas in a high velocity outflow. Future observations with HIFI, onboard the Far Infrared Space Telescope (FIRST) will allow the spectral separation of the PDR and the plateau components, unresolved with ISO, and characterise more precisely the Orion BN/KL star forming region.
1 Introduction
The Orion Molecular cloud, at a distance of 450 pc, is the closest region of high mass star formation. Its proximity and its large infrared luminosity allowed to perform plenty of observations in the past years, yielding the discovery of the first proto-stars candidates. Molecular emission mostly comes from OMC1, containing several condensation as the KL nebulae. The KL nebulae is composed by many infrared clusters (e.g. BN or IrC2), containing massives stars at early evolutionary states. Millimeter, sub-millimeter and infrared spectroscopy (see [\astronciteGenzel & Stutzki1989] for a review) have shown copious molecular emission arising from physically distinct regions: the ridge, the compact ridge, the hot core, the PDR region surrounding the quiescent gas and a high velocity ( = 18 km/s) bipolar outflow originating from IrC2. Outside the bipolar outflow is a region of very hot (1000 to 2000 K) shock exited gas. Numerous observations have allowed to charaterise this components in term of temperature, density and column density. Recently [*]Sempere reported of FIR CO observations towards BN/KL with the Long Wavelength Spectrometer (hereafter LWS: [\astronciteClegg et al.2000]) on board of the Infrared Space Observatory (ISO: [\astronciteKessler et al.1996]). Theses observations revealed the presence of three gas components they identified as the ridge, the high velocity outflow and a hot and dense gas component detected at Jup 30 due to the shocked gas in the high velocity outflow. Notheless uncertainties remains on the data calibration, and high J grating data are probably contaminated by adjacent lines. We here present a large bandwith survey of the far infrared CO lines of Orion BN/KL, performed with ISO-LWS in Fabry-Perot mode. Particular emphasis is given to the calibration of the FP data. Based on theses new calibrated data we interprete the FIR lines by means of a LVG code to derive the temperature, density and column density of the several gas component.
2 Observations and results
We performed a spectral survey of the Orion BN/KL using ISO-LWS both in grating mode and FP mode. The 80 beam was centred on Orion BN/KL (, ). The grating spectral survey was done using LWS in with the L01 AOT. It was calibrated using Uranus, and the absolute accuracy is estimated to be better than 30% ([\astronciteSwinyard et al.1998]). Theses observations required the use of the bright source data reduction package ([\astronciteLeeks et al.1999]) as the brightness of the source saturated the detectors LW2 to LW4. The grating spectrum was only used to calibrate the FP observations. The FP spectral survey was performed with the L03 AOT. Theses observations, covering the wavelength range 43 to 162 m are the first performed with a single instrument in space at the same time. The continuum level of the observation was calibrated against the grating spectrum, after taking into account the dark, straylight and FP order sorting. The calibration uncertainties, estimated from RMS of measured fluxes of each transition, is between 30% and 40% for the weaker lines. We detected 12CO rotational lines between Jup = 15 and 49 in FP mode. Higher transitions fluxes are under 10-11 erg.s-1.cm-2 and are not detected. The fluxes uncertainties, estimated from measurements of each transitions, are about 30% for transitions between Jup = 15 and 40 and 40% between 40 and 45. Lines between Jup = 45 and 49 must be considered as upper limits.

Higher transitions have a low RMS yielding uncertainties on width determination but the broadening observed is consistent with higher transitions measurement. This is clearly indicate that Jup 32 lines emission comes from another gas component than lower transitions, necessary hotter and denser. We also detected Jup = 18 and 24 13CO lines. We found a flux of respectively 3.7 1.1 and 4.7 1.4 erg s-1 cm-2. The 12CO/13CO fluxes ratio is 27 for Jup = 18 and 12 for Jup = 24, indicating that theses lines are optically thick.
3 Discussion
We analysed the 12CO lines fluxes by means of an LVG model developed by Ceccarelli et al. This model, which compute in a self consistent way the opacities of lines, has four free parameters : the 12CO column density, the H2 density, the gas temperature and the linewidth. The results of our computations are shown on fig. 2, together with our observations and previous ones ([\astronciteSchultz et al.1992], [\astronciteGraf et al.1990], [\astronciteSchmid-Burgk et al.1989], [\astronciteHowe et al.1993], [\astronciteGenzel et al.1988]). The differences between these previous measurements and our measurements are probably due to the different instruments beam.
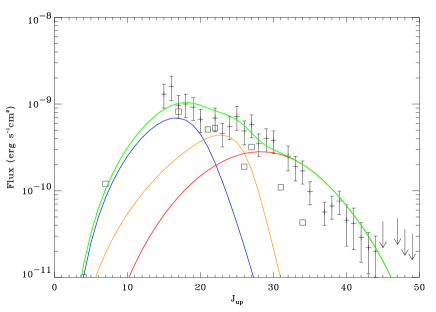
The first thing to note is that a single gas component can not explain the Jup = 15 to 44 observed emission. At least two components are needed to explain the emission peak observed at Jup = 16 and the “broad shaped” emission between Jup = 20 and 30. In addition the observed broadening at Jup 32 implies a third physical component.
3.1 Low J emission. Ridge, compact ridge and PDR
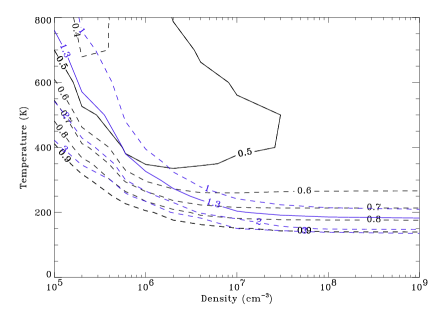
Because of the accurate calibration we used, the emission between Jup = 15 and 20 we observed is quite different than previous ISO observations. The fluxes we measure are 30 % higher than those measured by [\astronciteSempere et al.2000]. Such fluxes can’t be explain by the ridge emission as they previously said. The temperature, density and column density they adopted fail to reproduce the intensity of the emission we observed. In order to characterise the gas emitting at these transitions, we used the 12CO to 13CO line ratio at Jup = 18 to calculate the escape photon escape probability at this transition. Assuming that the relative abundance of 13CO with respect to 12CO is 60 and that the 13CO is optically thin, it gives a photon escape probability of 0.5 at Jup = 18. We also calculated Jup = 15 / 20 12CO lines ratios. This ratio, both with the photon escape probability were used to constrain the temperature and density of the gas. The fig. 3 shows theoretical photon escape probability and lines ratios computed with our LVG codes, both with photon escape probability and ratio we observed. We found a lower limit for the CO column density of 1017 cm-2. We adopted a column density of 1018 cm-2 and a line width of 10 km/s. This parameters gives a a temperature lower limit of 200 K. The best fit model is obtained for T = 350 K and n(H2) = 106 cm-3, but observed emission can also be explain by lower temperature and higher density, or inversely. The lack of data between Jup = 7 and 15 not allow to constrain more precisely the physical parameters. The parameters we adopted require a beam dilution factor of 1, which implies an extended emission. This, both with temperature limit of 200 K we obtained, indicates that the emission between 15 Jup 20 can not only arise from the ridge, but may arise from a the PDR region, in agreement with [\astronciteHowe et al.1993]. Notheless, BN/KL is a complex region where a lot of gas component whit nearby physical characteristics are present. This components are not resolved with LWS. Even if a single gas component can explain the Jup = 15 to 20 emission we observed, a part of emission may arise from the ridge. Nonetheless, because of it low temperature, we estimated the low J emission contribution of ridge of 10 % of the PDR emission. The hot core, due to its small angular size towards the PDR, also certainly few contribute to the 15 Jup 20 emission. The density and column density are in agreement with previous works ([\astronciteHowe et al.1993]), but the temperature we derive is significantly higher.
3.2 Jup = 20 to 30 emission. Plateau
Observed emission between Jup = 20 and 30 show a broad shaped emission
necessary arising from an hotter and denser component than the PDR. Along the
same lines, we used the 13CO to 12CO fluxes at Jup = 24 to
constrain the physical parameters of the gas emitting at theses transitions.
This ratio give a photon escape probability of 0.2. We used the 12CO line
ratio 20/26 is 1.4 and adopted a line width of v = 30 km/s.
We found a lower limit for the column density of 1019 cm-2, but
higher density are also giving solution. We adopted N(CO) = 5.1019
cm-2. This column density gives a lower limit of 5.106 cm-3 for
the density and 300 K for the temperature (see fig. 4).
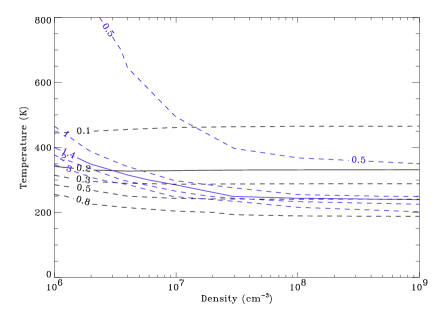
The parameters which are best fitting our observations are T = 350 K and a n(H2) = 107 cm-3. Theses requires a beam filling factor of 7 % to fit the Jup = 20 to 30 lines fluxes. The angular size we derive from this filling factor is 20 [\astronciteHowe et al.1993]. The high velocity component angular size deduced from CO 7-6 line emission is 40 , but could be smaller at higher transitions. The angular size we determined yields to say that the emission at theses transitions arises from this gas component. The physical parameters we derived agree with previous determinations ([\astronciteSchultz et al.1995]).
3.3 High J emission. Shocked gas
Although high J emission could be explain by higher plateau temperatures and densities, the observed broadening of Jup 32 lines clearly shows that emission at this transitions arises from another hot and dense gas component. High temperatures and densities that requires this emission suggest that the emission arise from the gas shocked by the high velocity outflow, in agreement with [\astronciteSempere et al.2000] interpretation. We modelled this emission by a gas temperature of 1500 K, n(H2) = 4.106 cm-3, and v = 50 km/s. Theses requires a beam averaged column density of 1017 cm-2. Assuming a angular size of 40 , it implies a column density of 1016 cm-2. This values are in good agreement with [\astronciteSempere et al.2000]. At Jup 32, the shocked gas emission become more important than the plateau emission, explaining the line broadening observed at theses transitions.
3.4 Agreement with observed lines profiles
In order to check the agreement of our model with observed lines profiles, we compared theoretical emission lines profiles of the three component with observed profiles. Theoretical profiles were obtained in convolving gaussian profiles by the PSF of the instrument. The line intensities were inferred from lines fluxes predicted by our LVG model. The PSF was obtained by Vastel et al. in observing thin [OI],[OIII] and [CII] lines in NGC7023 and G 0.6-0.6. The theoretical profiles, superposed on observed lines, are shown on fig. 5.
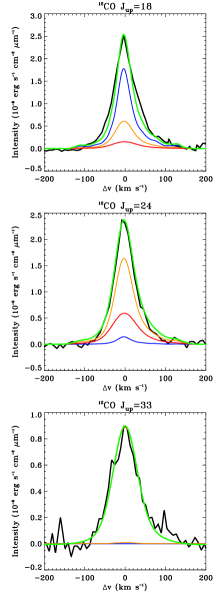
The theoretical profils are in good agreement with the observed ones. The predominance of shocked gas emission at Jup = 32 can explain the broadening of lines observed at theses transitions
4 Conclusions
The Orion BN/KL observations with LWS allowed to detect Jup = 15 to 49 CO rotational transitions in Fabry-Perot mode. The modelling of observed fluxes by a LVG showed that molecular emission can be explained by three gas components that we characterised in term of temperature, density and column density (see tab. 1).
| PDR | Plateau | Schocked gas | |
|---|---|---|---|
| n(H2) cm-3 | 106 | 2.106 | 4.106 |
| T (K) | 400 | 350 | 1500 |
| N(CO) (cm-2) | 1018 | 5.1019 | 1017 |
| (km/s) | 10 | 30 | 50 |
| Filling factor (%) | 100 | 7 | 25 |
We found that low J emission can not only arise from the ridge, too cold, but may arise from the PDR region. The emission between Jup = 20 and 30 certainly arise from the high velocity outflow. Finally, observed Jup 32 lines broadening is though to be due to the gas shocked by the high velocity outflow. High J fluxes measurements lead to estimate a shocked gas temperature between 1000 and 2000 K, a H2 density between 106 and 107 cm-3 and a CO column density between 1015 and 1016 cm-2. Our model both account of observed fluxes and lines profiles. This study show the necessity of high resolution observations of Orion BN/KL, as ISO-LWS observations not allow the spectral separation of the different gas components. Future observations with HIFI, onboard the Far Infrared Space Telescope (FIRST) will allow the spectral separation of the PDR and the plateau component, unresolved with ISO, and characterise more precisely the Orion BN/KL star forming region.
Acknowledgements.
This study is based on observations with ISO, an ESA project with instruments funded by ESA Member States (especially the PI countries: France, Germany, the Netherlands and the United Kingdom) with the participation of ISAS and NASA.References
- [\astronciteClegg et al.2000] Clegg, P. E. et al 1996, A&A, 315, L38
- [\astronciteGenzel et al.1988] Genzel, R. et al 1988, ApJ, 333, L59
- [\astronciteGenzel & Stutzki1989] Genzel, R. and Stutzki, J. 1989, ARA&A 27, 41
- [\astronciteGraf et al.1990] Graf, U. U. et al 1990, ApJ, 358, L49
- [\astronciteHowe et al.1993] Howe, J. E. et al 1993, ApJ, 410, 179
- [\astronciteKessler et al.1996] Kessler, M. F. et al 1996, A&A, 315, L27
- [\astronciteLeeks et al.1999] Leeks, S. J. et al 1999, ESA SP-427, 427, 81
- [\astronciteSchmid-Burgk et al.1989] Schmid-Burgk, J. et al 1989, A&A, 215, 150
- [\astronciteSchultz et al.1992] Schultz, A. et al 1992, A&A, 264, 629
- [\astronciteSchultz et al.1995] Schultz, A. et al 1995, A&A, 295, 183
- [\astronciteSempere et al.2000] Sempere, M. et al 2000, ApJ, 530, L123
- [\astronciteSwinyard et al.1998] Swinyard, B. M. et al 1998, Proc. SPIE, 3354, 888