CL 1358+62: Characterizing the Physical Properties of Cluster Galaxies at
Abstract
We examine the physical properties of 173 cluster members in CL 1358+62 () from WFPC2 imaging taken in the F606W (rest-frame ) and F814W (rest-frame ) filters over a Mpc2 field ( km s-1 Mpc-1, , ). Structural parameters are measured for each galaxy by fitting a PSF-convolved, two component model to their 2D surface brightness distribution. We examine bulge+disk models using three different bulge profiles (de Vaucouleurs, Sérsic, and exponential), and rigorously test the robustness of our results by analyzing several thousand artificial galaxies in the same manner as the cluster data. The measured physical properties from the best-fit profile of the cluster galaxies are combined with ground-based spectroscopy to test for correlations between morphological characteristics, current star formation, total galaxy colors, and cluster substructure. We find that: (1) Bulge-to-total ratio [] and Hubble type () are strongly correlated (99% confidence), but the scatter is large and early-type spirals are not reliably distinguished from ellipticals and S0’s based on . (2) From comparison of their physical properties, the low luminosity () ellipticals in our sample are likely to be face-on S0 galaxies. (3) High galaxy asymmetry and strong [OII] emission are strongly correlated for disk-dominated members []. (4) There exists a small population (%) of bulge-dominated members whose significant [OII] emission (Å) suggest they harbor active galactic nuclei. (5) At these redshifts, determining the correct Sérsic index can be highly unreliable.
1 Introduction
How galaxies evolve as a function of their environment remains a fundamental question in astronomy. In particular, the environment of rich clusters provides a unique laboratory for studying how the physical properties of galaxies are related to varying local density, interactions with other galaxies, and exposure to a hot intracluster medium. One deeply ingrained and useful approach to studying galaxy evolution is characterizing morphological properties by visually typing galaxies using the Hubble system (Hubble 1926). As we move into the era of galaxy surveys with thousands, if not millions, of objects, however, there is a need for a quantitative, uniform, and reproducible method of cataloging these visual properties.
A promising solution to this challenge is to measure physical properties, bulge and disk scale lengths, bulge-to-total ratios, disk inclination, bulge ellipticity, etc., directly from 2D surface brightness distributions. Here, parametric models are convolved with the point spread function and then compared to the galaxy’s image to determine the best fit model (Schade et al. 1995; de Jong 1996; Marleau & Simard 1998; Simard et al. 1999; Tran et al. 2001; Trujillo et al. 2001; Simard et al. 2002; La Barbera et al. 2002; MacArthur et al. 2003). Not only are 2D fits a natural way to weight the information contained in each pixel, they are crucial for detecting the presence of bars, HII regions, tidal tails, arms, shells, etc., structures not easily identified in traditional 1D profiles. By keeping the 2D information, structural parameters for a large sample of galaxies can be derived and then compared to the galaxies’ spectral properties and environmental conditions. A lingering concern, however, is assessing how meaningful the structural parameters are. In the well-accepted framework of Hubble classifications, how can bulge-to-total ratios, scale lengths, galaxy asymmetry, etc. aid our understanding of galaxy evolution?
In Hubble’s original system (Hubble 1926), one of the main qualitative classification criteria is bulge-to-disk ratio. As bulge+disk models measure a basic extension of this parameter (bulge-to-total fraction; ), it should be possible to correlate bulge fraction with Hubble type. The bulge fraction varies, however, depending on the type of bulge profile used, classical de Vaucouleurs law (de Vaucouleurs 1948), the generalization by Sérsic to (Sersic 1968), or pure exponential (de Jong 1996). A fundamental question is which profile correlates best to Hubble classifications for galaxies spanning the range of morphological types?
Once the appropriate profile is determined, the measured structural parameters provide a wealth of information with which to study galaxies. In addition to confirming the morphology-density relation in intermediate redshift clusters (Dressler et al. 1997), recent studies find a population of late-type/disk-dominated members that lack strong emission (Poggianti et al. 1999; Balogh et al. 2002), i.e. their star formation has been quenched. This result suggests that spectral and morphological evolution in the cluster environment may be decoupled and raises the question of how strongly ongoing star formation is correlated with physical characteristics. By comparing spectral features to quantitative measures of galaxy morphology from our extensive sample of CL 1358+62 (; Fisher et al. 1998, hereafter F98), we can address this issue as well as test for correlations between morphology and cluster substructure ( Hutchings et al. 2002).
A direct test of the link between star formation and morphology is to compare [OII] emission to residuals from the galaxy fits. Couch et al. (2001) find that spiral structure still can be observed in cluster galaxies long after star formation has ceased, signatures of past events may be long-lived. If 1) morphological disturbances associated with star formation continue to exist long after the star forming episode ends, and 2) late-types are “strangled” when they enter the cluster environment (Balogh et al. 1998, Mpc), then we should observe a population of predominantly late-type galaxies in CL 1358+62 with high asymmetry but no detectable [OII] emission. By comparing [OII]3727 to bulge-to-total ratio and galaxy asymmetry, we can isolate these galaxies.
Another interesting question that can be addressed using 2D fits is whether low luminosity ellipticals and S0’s are essentially the same type of galaxy. It has been argued that ellipticals and S0’s have different formation/merger histories than the most luminous early-types. Jorgensen & Franx (1994) suggest that these fainter ellipticals and S0’s actually form a common parent galaxy population, and that viewing angle plays a strong part in how these galaxies are typed (Rix & White 1990; Kormendy & Bender 1996, see also). Their similarity in colors support this argument (Sandage & Visvanathan 1978). As the isophotal shapes of early-type galaxies hold clues to their formation history (Nieto & Bender 1989; Naab et al. 1999), determining if bulge-dominated systems must be separated into two classes, “boxy” bright ellipticals and “disky” fainter ones (Kormendy & Bender 1996), is integral to understanding galaxy evolution across the range of luminosity (mass). To address this question, we compare the bulge fractions, disk inclinations, bulge ellipticities, and velocity dispersions of visually classified ellipticals and S0’s in CL 1358+62 (Fabricant et al. 2000, hereafter FFvD00).
In this paper, we characterize the physical properties of 173 confirmed members in CL 1358+62 (F98) using GIM2D (Marleau & Simard 1998; Simard et al. 1999; Tran et al. 2001; Simard et al. 2002), an automated program that fits a PSF-convolved 2D surface brightness model to an image of each galaxy and searches space for the best fit. The images are from WFPC2 mosaics taken in the F606W and F814W filters ( rest-frame and ). The members span the range of Hubble type () and have apparent F814W magnitudes between (BCG) and (). By fitting three different bulge+disk profiles to the sample, we determine the profile that is correlated best with the published visual classifications. We test for correlations between structural parameters, current star formation as defined by [OII] emission, internal velocity dispersions, and local cluster structure. We also investigate the relationship between elliptical and S0 galaxies, and examine the properties of E+A galaxies.
To determine how robust our results are, we simulate thousands of artificial de Vaucouleurs bulge+exponential disk galaxies and fit surface brightness profiles to them in the same manner as with the cluster sample; note we assume galaxies can be well-described by a two component profile. The artificial galaxy catalog covers the same range in structural parameter space as the cluster members, and from these simulations we quantify systematic and random errors associated with bulge fraction, half-light radius, bulge & disk scale lengths, disk inclination, and bulge ellipticity. We also test our ability to measure Sérsic and exponential bulge components by fitting artificial galaxies with () bulge+exponential disk and double exponential profiles.
The sections of this paper are organized as follows: The data and fitting technique are described in §2. In §3, we present the models and structural parameters determined by our surface brightness fitting program for the cluster sample. Here we employ “sanity checks” by comparing the measured bulge fraction to visual morphologies, local cluster density, and total galaxy colors. Correlations between bulge fraction, total residual, galaxy asymmetry, and current star formation also are examined in this section. We discuss the physical properties of elliptical, S0, and E+A galaxies in §4. In §5, we test the robustness of our measurements by utilizing results from thousands of artificial galaxies fits. Our conclusions are summarized in §6. Here we use km s-1 Mpc-1, , and .
2 Data and Analysis
2.1 Imaging
We use WFPC2 imaging of CL 1358+62 that is part of an extensive project to study the evolution of intermediate redshift cluster galaxies (van Dokkum et al. 1998a, b; Tran et al. 1999; van Dokkum et al. 1999, 2000; Kelson et al. 2000a, b, c, 2001; van Dokkum & Franx 2001). The mosiac ( Mpc) is centered on the brightest cluster galaxy (BCG) and is comprised of 12 separate pointings in the F606W and F814W filters. Three exposures, each 1200 seconds, were taken in each filter for each pointing. The two chosen filters, F606W and F814W, are similar to rest-frame and for CL 1358+62. The images were reduced at the Space Telescope Science Institute (STScI) with the usual pipeline procedure. Details of the complex sky subtraction and cosmic ray removal are explained fully in van Dokkum et al. (1998b, hereafter vD98). Following vD98, we transform from observed F606W and F814W magnitudes to rest-frame and using
| (1) |
| (2) |
with a distance modulus of ; we also correct for passive evolution (van Dokkum et al. 1998a).
2.2 Spectroscopy
The large spectroscopic sample obtained for the CL 1358+62 field was taken at the Multiple Mirror Telescope and the William Herschel Telescope. A detailed description of the reduction and analysis of the spectroscopic sample are described in Fabricant et al. (1991) and F98.
Twenty slit-masks were designed to cover a field; targets were chosen based on their magnitude from imaging taken at the Whipple Observatory 1.2m telescope. The spectral resolution was Å at the WHT and Å at the MMT. Of the 387 redshifts measured, 232 are cluster members. Defining galaxies with as cluster members, CL 1358+62’s mean redshift and velocity dispersion are and km s-1 respectively (F98).
From the redshift catalog, 192 cluster members fall on the WFPC2 mosaic. The completeness within the mosaic is to (), decreasing to at . The incompleteness is not due to an inability to measure redshifts at these magnitudes but by the limited number of galaxies observed. The redshift success rate is not strongly color dependent for (F98).
Of the 192 galaxies that are on the mosaic, we fit galaxy models only to 173 as 19 fall too close to a chip edge for proper analysis of the surface brightness distribution. The 173 galaxies range in absolute magnitude from +5log mags (H375; BCG) to +5log mags (I1829). We include the published [OII] Å line strength measurements (F98) and internal velocity dispersions for a subset (Kelson et al. 2000b) in our analysis.
2.3 Structural Measurements
2.3.1 The Surface Brightness Models
We use the GIM2D package (Marleau & Simard 1998; Simard et al. 1999; Tran et al. 2001; Simard et al. 2002) to find the best-fit PSF-convolved, 2D bulge+disk models to the surface brightness profiles of the cluster members. The program has a maximum of 12 fitting parameters: the flux () in the model integrated to ; the bulge/total luminosity ; the semi-major axis effective radius of the bulge ; the bulge ellipticity where and are the bulge semi-major and semi-minor axes respectively; the bulge position angle ; the semi-major axis exponential disk scale length ; the inclination of the disk ( for face-on); the disk position angle ; the subpixel and offsets of the galaxy’s center; the residual background level ; and the Sérsic index of the bulge. Both and are measured clockwise from the positive -axis of the image. The best-fit parameters and their confidence intervals are determined using the Metropolis algorithm (Metropolis et al. 1953; Saha & Williams 1994) which uses the test to determine the region of maximum likelihood in the multi-parameter space.
The bulge profile is defined as
| (3) |
where is the surface brightness at along the semi-major axis, and is the effective surface brightness. This bulge profile is also known as the Sérsic profile (Sersic 1968). The parameter is equal to , a value that defines to be the projected radius enclosing half of the light in the bulge component (Capaccioli 1989). The classical de Vaucouleurs profile is a special case of Equation 3 with .
The disk profile is defined as
| (4) |
where is the (face-on) central surface brightness. We note (as do Simard et al. 1999, 2002) that the bulge/disk nomenclature adopted here to describe our surface brightness models may not reflect the internal kinematics of its components. A “bulge” may not be a centralized, dynamically hot spheroid but could be a central starburst. Similarly, a “disk” may not necessarily be a cold, co-rotating population. For example, dynamically “hot” systems such as faint dwarf ellipticals are best fit by exponential disks (Binggeli & Cameron 1991; Ryden et al. 1999).
Before a 2D model to the surface brightness of a given galaxy can be fitted, the galaxy’s isophotal area and an appropriate point spread function (PSF) must be determined. To define the isophotal area, we use the galaxy photometry package SExtractor V2.0 (Bertin & Arnouts 1996) with a detection threshold of mags/ (equivalent to of the sky noise) and a minimum deblending contrast parameter of 0.01. As we fit galaxies in two filters (F606W and F814W), we use the isophotal area defined in the (redder) F814W image. To generate a PSF for each galaxy in each filter, we use TinyTim V4.4 (Krist 1993). As the PSF changes across each WF chip, a PSF model is generated every 50 pixels and the nearest one to the galaxy is chosen for the GIM2D analysis. Both the PSF and galaxy models are subsampled by a factor of five as WF image are undersampled and the pixelization can affect the shape of small galaxies such as those in our cluster sample. The centering of the galaxy is also improved by subsampling the data; this point can be critical for determination of the galaxy residuals (Conselice et al. 2000).
By fitting models to the surface brightness distribution of these galaxies, we measure the structural properties , , , , , , , and the half-light radius . The semi-major axis half-light radius is computed by integrating the sum of Equations 3 and 4 to ; note that as the models include bulge ellipticity and disk inclination, circular symmetry is not assumed. The galaxy’s center is also determined from the best fit model.
The asymmetric image residual flux is quantified by the asymmetry index (Schade et al. 1995), defined as
| (5) | |||||
where is the flux at in the residual image, is the flux in the residual image rotated by , and is the flux in the original image. Following Marleau & Simard (1998), is measured within . The second term in Equation 5 is a statistical correction for background noise fluctuations. Since involves taking absolute values of pixel fluxes, it will yield a positive signal even in the sole presence of noise. The background correction, , is computed over pixels flagged as background pixels by SExtractor. The ’s are background pixel values in the residual image, and the ’s are background pixel values in the residual image rotated by . The background correction is computed over a background pixel area equal to the pixel area over which is computed. Given the statistical nature of , there will be cases when a galaxy is faint enough compared to its background noise that may take on small negative values in exactly the way as the difference of two values of computed from different regions of the sky may be negative.
In addition to , we measure the total residual fraction of light by taking the pixels assigned to the galaxy by SExtractor and creating a mask that is applied to the original and model images (Tran et al. 2001). For a positive-definite residual fraction, the model is subtracted from the original, and the absolute value of the difference at each pixel over the isophotal area is summed. To account for the sky, the same number of sky pixels as galaxy pixels are summed in the same manner and subtracted from the total galaxy residual. We use the total residual fraction of light as a gauge of the model’s goodness of fit but note that, for fainter galaxies, the error in is dominated by the error in the sky flux.
3 Physical Properties
3.1 What Type of Profile?
A fundamental question when using parametric surface brightness models to measure physical properties is what type of profile should be used. Depending on the profile, certain structural parameters ( , scale lengths, and bulge/disk colors) can change drastically in value (see Fig. 1). Recent work (de Jong 1996; Courteau et al. 1996; Andredakis 1998) combine two exponential components to fit the surface brightness profile of late-type spirals while others (Caon et al. 1993; La Barbera et al. 2002) use a Sérsic profile to fit early-type galaxies. Another popular profile is the classical de Vaucouleurs with exponential disk (Schade et al. 1995; Marleau & Simard 1998; Simard et al. 1999; Im et al. 2001; Tran et al. 2001). If conclusions are to be drawn from these quantitative studies of galaxy morphology, the most basic first step is to be consistent in the type of profile used.
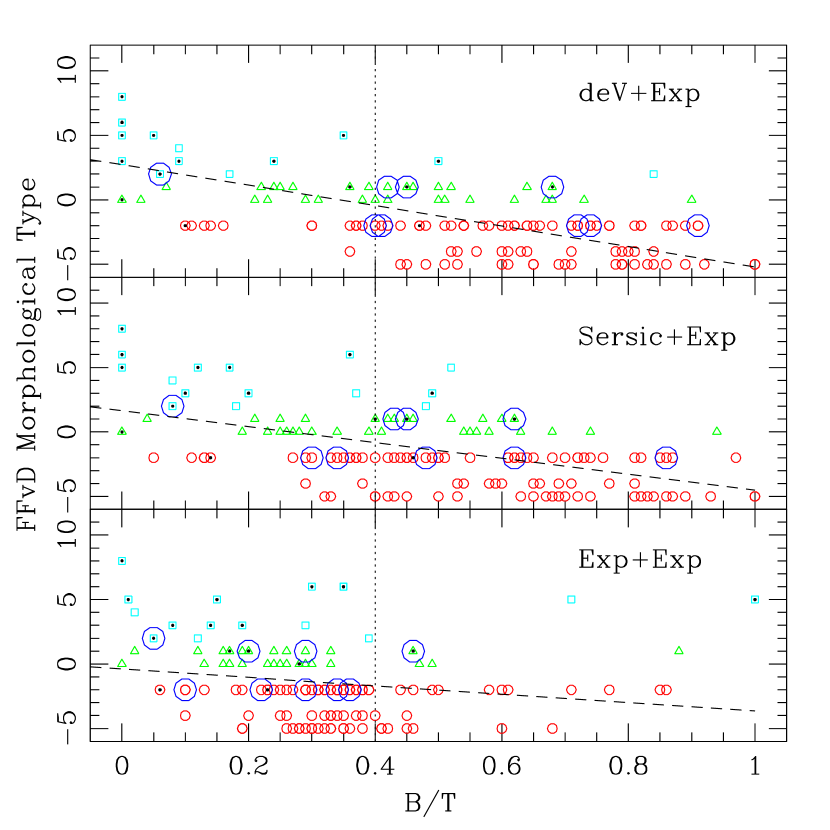
In this paper, we test three different profiles by fitting them to the cluster galaxies and comparing the measured structural parameters to published Hubble types from FFvD00; as we justify in §5, we use only the 155 members in our sample brighter than (+5log). The three profiles are: (1) de Vaucouleurs bulge with exponential disk; (2) Sérsic bulge () with exponential disk; and (3) double exponential. Figure 1 shows versus visual morphological type for the three profiles; here, visual types are represented as E (-5), S0 (-2), Sa (1), Sb (3), Sc (5), Sd (7), Sm (9), and Im (10); galaxies with high degree of asymmetry (, see §3.3.1) are noted with dots.
Of the three profiles, both the de Vaucouleurs bulge+exponential disk and Sérsic bulge+exponential disk correspond well to the visual types. The correlation between measured and visual type for both profiles is 99% () significant with the Spearman rank test (Press et al. 1992). The trend between de Vaucouleurs bulge+exponential disk and type is not surprising because: 1) bright ellipticals and the bulges of early-type spirals are well-fit by a de Vaucouleurs profile (Andredakis et al. 1995; Andredakis 1998); and 2) cluster galaxies tend to be bulge-dominated systems. We note, however, that there is large scatter in the correlation and that cannot reliably distinguish early-type spirals from ellipticals and S0’s.
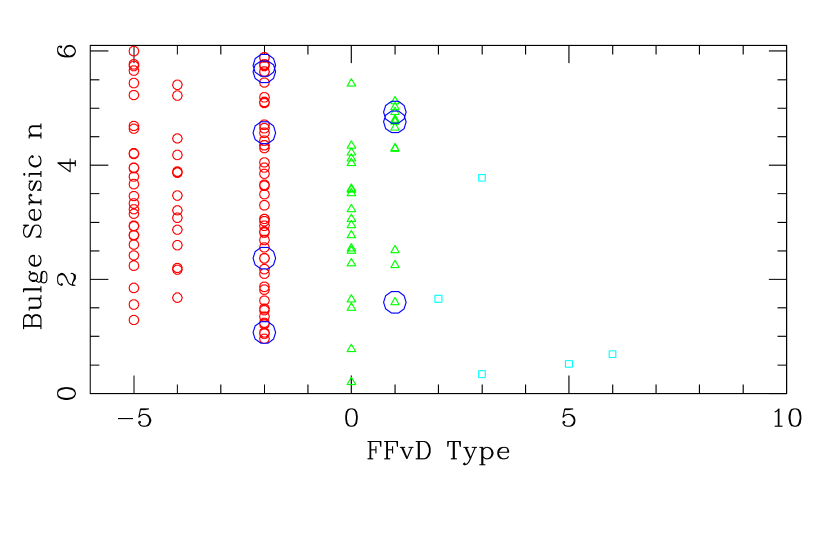
While the correlation between visual type and for the Sérsic bulge+exponential disk fits is strong (see Fig. 1), we do not recover the observed correlation between bulge power and Hubble type found locally (Caon et al. 1993; Graham & Prieto 1999, see Fig. 2). This combined with results from the simulations discussed in §6 suggest that a Sérsic bulge+exponential disk is not an appropriate model for this sample. Our sample does not contain enough spirals to test for the trend between and early versus late-type spirals found by Graham (2001).
There is no visible correlation between and type for the double exponential profile. The mismatch between profile and galaxy type results in an alarming number of cluster galaxies (75%) being classified as disk-dominated sytems (). The lack of correlation is not surprising, however, given the inherent ambiguity between “bulge” and “disk” when describing the two components with the same functional form. Also, this profile is appropriate mainly for late-type spirals (de Jong 1996; Courteau et al. 1996). These points convince us that the double exponential profile is a poor choice for measuring structural parameters across the range of galaxy types.
Based on these tests, we proceed to use the de Vaucouleurs bulge with exponential disk profile as our canonical fitting model for the sake of continuity across the full range of morphological types.
3.2 2D Surface Brightness Models: Sanity Checks
Before drawing any conclusions from the surface brightness models, we employ “sanity checks” to ensure our method corresponds to observed, well-established cluster galaxy properties. These tests are: 1) check for consistency of measurement between filters; 2) establish a correlation between measured and visual morphological type; 3) determine if a morphology-radius ( density) relation using exists; and 4) check that typing cluster members by results in separation of galaxy types in the color-magnitude diagram.
3.2.1 Galaxy Models: de Vaucouleurs Bulge with Exponential Disk
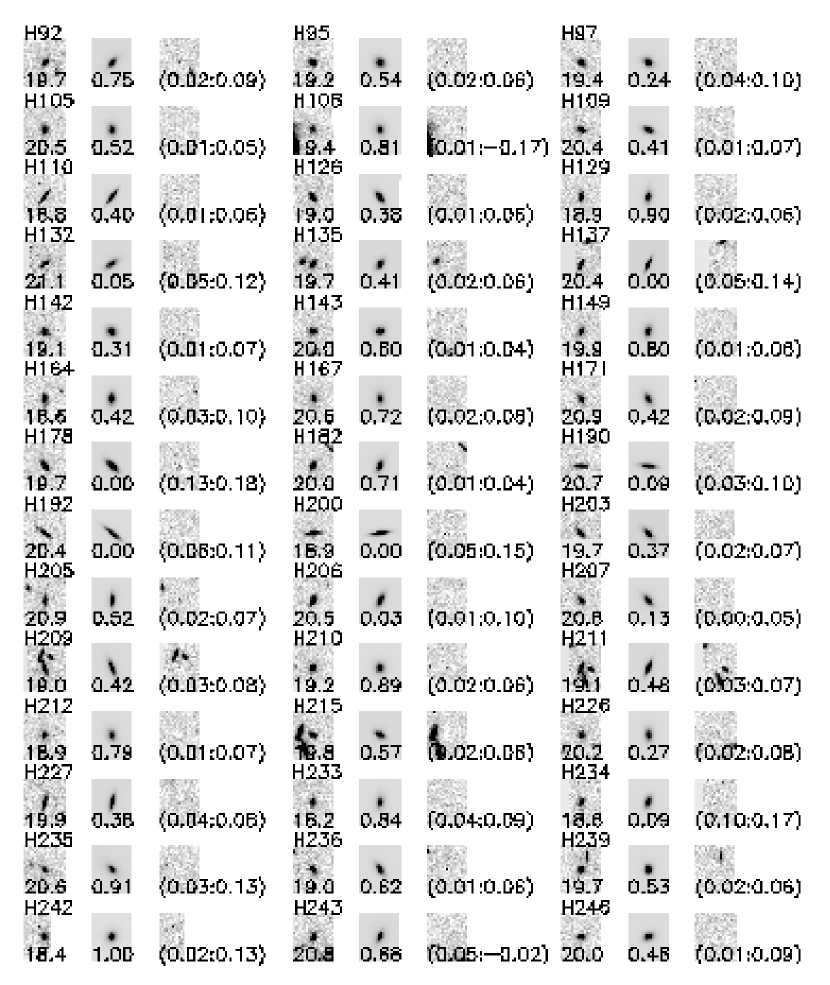
We fit a de Vaucouleurs bulge with exponential disk model to the 173 cluster members in our sample. The galaxies are fit in each filter separately to test the robustness of the structural parameter measurements. Figure 3 shows 168 of the 173 galaxies in our cluster sample. Each set of three thumbnails shows the galaxy, its best-fit de Vaucouleurs with exponential disk model, and its residual image created by subtracting the model from the original. Included in the images are reference numbers (upper left), apparent F814W magnitudes (bottom left), bulge/total luminosity (; bottom middle), and the asymmetry parameter and total fraction of residual light (; bottom right). The pixel area in each thumbnail is 15 times the galaxy’s isophotal area as defined by SExtractor; this is usually on a side. The cluster members range in absolute magnitude from +5log (BCG; H375) to +5log (H1829). Table 1 lists these parameters as well as , , Hubble type, half-light radius, and bulge/disk scale lengths. In the following discussion, we only include the 155 members with as, based on results from extensive simulations in §5, our measured structural parameters are not significantly biased for these.
For simplicity, we focus on structural parameters measured from the individual F814W (rest-frame ) images as opposed to including values from the F606W ( rest-frame ) images. Comparing structural parameters measured in the two filters finds little difference in their general distributions. We emphasize that while structural parameter values for individual galaxies may vary between the two filters, these differences are 1) expected and understandable and 2) do not impact the global conclusions drawn from our analysis.
3.2.2 vs. Visual Morphology
In Fig. 4, we show the bulge distributions measured in F814W. Not surprisingly, the majority of cluster members (%) are bulge-dominated () systems. This result does not depend strongly on filter as, using the Kolmolgorov-Smirnov test (Press et al. 1992), we find the F814W and F606W distributions to be indistinguishable.
With the de Vaucouleurs bulge+exponential disk profile, we find a strong trend (99% confidence) between and visual morphological type (Fig. 1, top panel) with the Spearman rank test (Press et al. 1992), albeit with large scatter. We also see in Fig. 1 that of the high asymmetry, visually typed galaxies, all have ; this is expected because disks are more likely to harbor asymmetric features such as HII regions. The correlations between , asymmetry, and visual type are highly encouraging but we note that, in this sample, it is difficult to separate early-type spirals from ellipticals and S0’s using alone.
3.2.3 (Morphology) vs. Local Density
F98 and vD98 have shown that galaxy spectral type and visual morphological type vary as a function of local density in CL 1358+62. In Fig. 5, we show that fitting a de Vaucouleurs bulge with exponential disk profile to the same sample of galaxies also recovers the same results, as expected since we have demonstrated the strong correlation between and visual type. Splitting the sample into bulge and disk-dominated systems, Fig. 5 shows the increase in the fraction of disk-dominated systems with decreasing local galaxy density. Here, the local galaxy density is defined as , and is the distance to the farthest of the ten nearest confirmed members to the object (Dressler 1980).
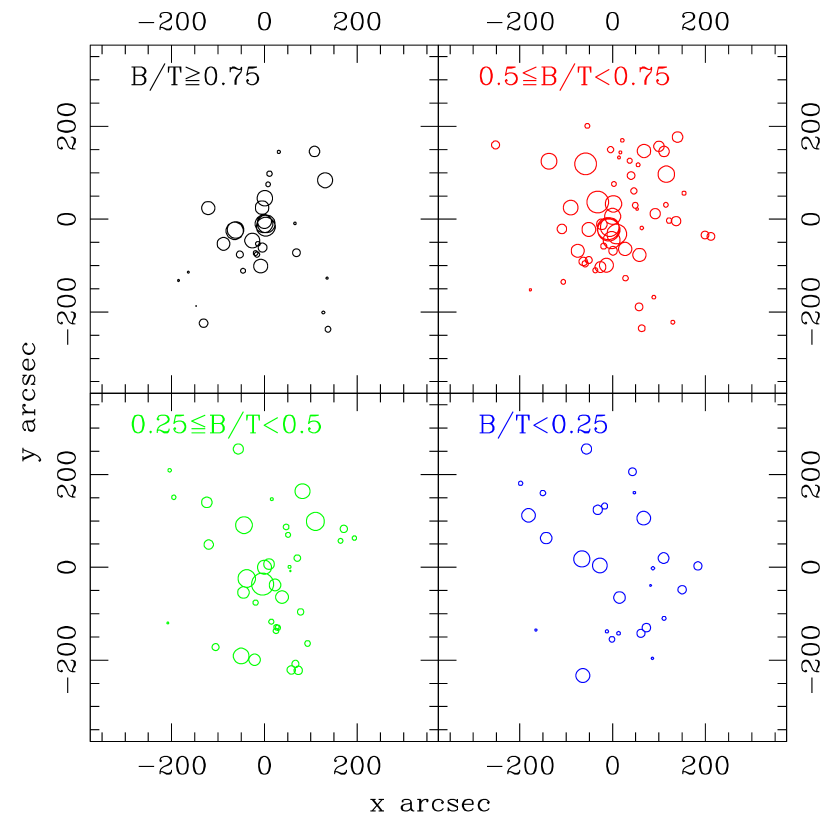
An interesting question is whether the distribution of bulge-dominated galaxies is related to cluster substructure. Using the Dressler-Shectman test (Dressler & Shectman 1988), F98 found the degree of substructure to be significant with 96% confidence () where the significance was calibrated with Monte Carlo realizations. Fig. 6 shows the spatial distribution of mags members as a function of and , the substructure statistic. As quantifies how much the local mean redshift and velocity dispersion deviate from the cluster’s global values, groups of large circles indicate a significant degree of substructure. Moving from bulge to disk-dominated systems, we find that bulge-dominated systems are clustered more strongly than disk-dominated ones. The spatial distribution of the most bulge-dominated galaxies () is different from that of the most disk-dominated () ones with 97% confidence () using the two dimensional K-S test. The most significant subclump is a foreground group composed mainly of early-types (), including the BCG.
As a further refinement, we separate the cluster sample into and members and apply the Dressler-Schectman test; again, the substructure signficance is calibrated with Monte Carlo realizations. The bulge-dominated galaxies (98) show substructure with 98% confidence () while the disk-dominated galaxies (75) lack significant substructure. In addition, the cluster velocity dispersion determined from bulge-dominated systems is lower than that from disk-dominated ones: km s-1 compared to km s-1 .
3.2.4 Color-Magnitude Relation
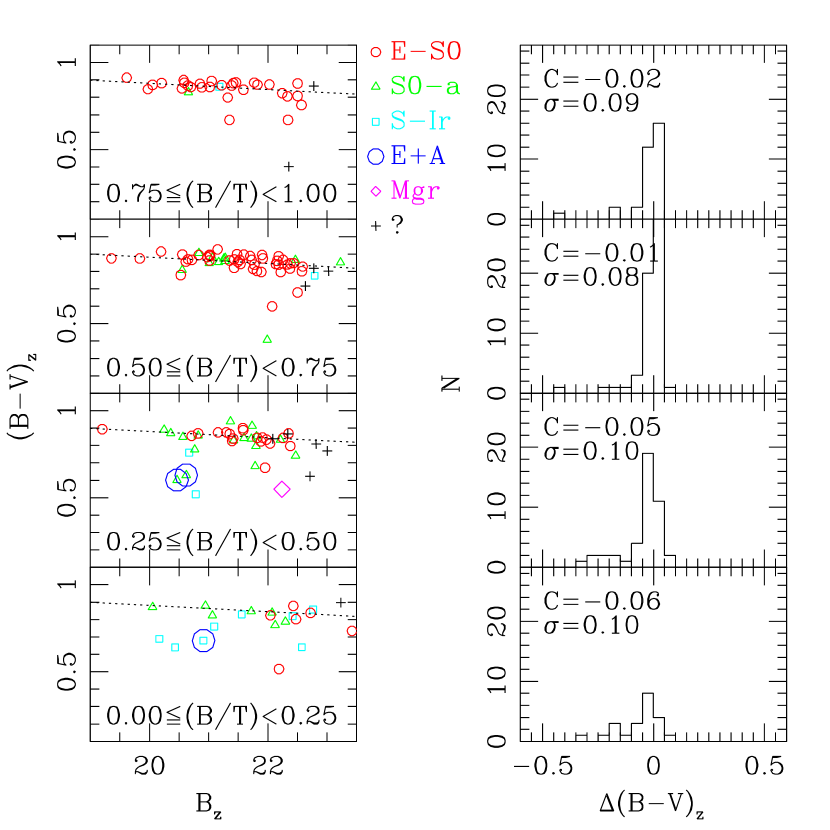
Following vD98, we examine how galaxy colors change as a function of magnitude and galaxy type (as defined by bulge fraction ). In Fig. 7, we show the color magnitude diagram in four bins; we use magnitudes, colors, CM relation (determined from E-S0 members) from vD98. As decreases, the scatter and average deviation from the CM relation increases. Also, the most disk-dominated systems () are significantly bluer and have the largest scatter about the CM relation. These results are consistent with the trends vD98 found using Hubble classifications for the same galaxies.
In Fig. 7, we see there exist cluster members with significant disk components () that are also red. It is possible these disk systems have had their star formation “strangled” Balogh et al. (1998) and/or they have managed to avoid major galaxy interactions that would have disrupted their disks, mergers. An extensive analysis of the bulge/disk colors of these galaxies will be discussed in a future paper.
3.3 Image Residuals of Cluster Members
3.3.1 High Asymmetry Galaxies
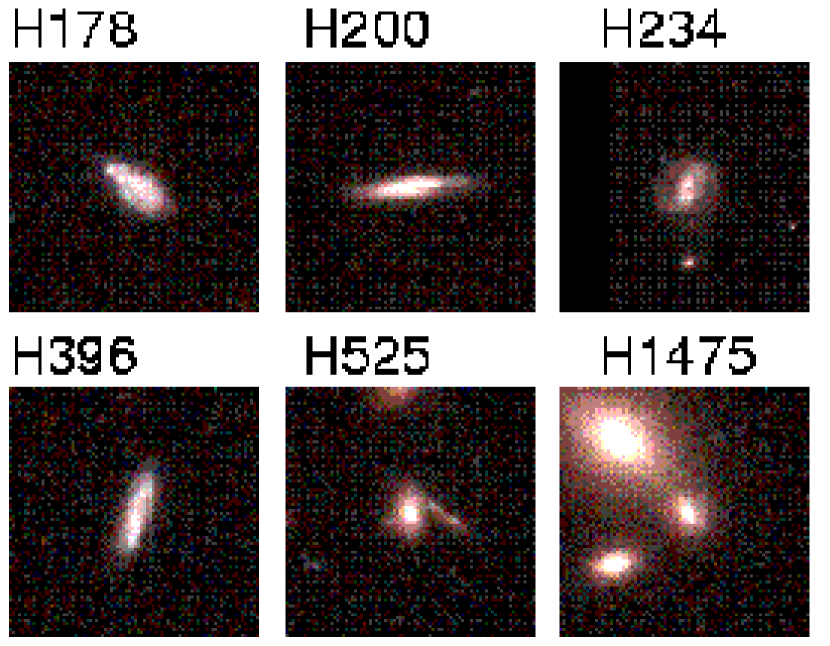
Following Tran et al. (2001) and Schade et al. (1995), we define galaxies with as having a high degree of asymmetry. In the cluster sample of galaxies with , % have , and all of these high asymmetry galaxies have . Most asymmetries in this population are due to star-forming regions in disk-dominated systems ( H178, H200, H234, and H396; see Fig. 8).
CL 1358+62’s fraction of high asymmetry galaxies is more similar to that observed in groups than in the field. Tran et al. (2001) found that about 11% of galaxies nearby, X-ray luminous groups have high asymmetry222Note, however, that our data are higher in physical resolution than the ground-based sample (0.44 kpc versus 1.31 kpc)., with the fraction of bulge-dominated galaxies in groups at . In comparison, Schade et al. (1995) found that 10/32 (30%) observed field galaxies within the redshift range have high galaxy asymmetry. This is as expected, however, as the majority of field galaxies are disk-dominated, and disks are more sensitive to morphological disturbances.
3.3.2 High Total Residual Galaxies
After examining the residual images (Fig. 3), we define galaxies with as having high total residual. Approximately 20% of the members have high total residuals with features that are over or under-subtracted by the model, bars (H525, see Fig. 8) or star-forming regions (H178, see Fig. 8). As there are 15 galaxies common to both populations, however, this is not surprising.
We find that disk-dominated galaxies tend to be more disturbed than bulge-dominated ones: a third of these systems show high asymmetry and half have a high total residual. Comparatively, the early-type galaxies have smoother galaxy profiles: only % show high galaxy asymmetry and % have a high total residual. Normalizing the residuals by the average surface brightness instead of the total flux finds the same result. The difference in the high residual fraction of disk-dominated members compared to bulge-dominated ones supports findings that the mechanism(s) responsible for morphologically disrupting cluster members are: (1) more effective at disturbing disk-dominated galaxies than bulge-dominated ones and/or (2) the early-type galaxies are older and have been in the cluster environment longer, so any disruptions in these galaxies occurred long ago and have damped out via phase mixing.
3.4 Correlations between Structural Parameters and [OII] Emission
To determine how morphological characteristics are correlated (or not) with ongoing star formation, we compare , , and to [OII] measurements from F98. We assume [OII] emission is correlated with star formation and not active galactic nuclei (AGN) as we do not have the necessary data ( H or X-ray) to distinguish between the two. Again, we discuss only the 155 galaxies in the cluster sample with . In the following discussion, note that neither nor are correlated with luminosity, as determined with the Spearman rank test.
3.4.1 Current Star Formation vs.
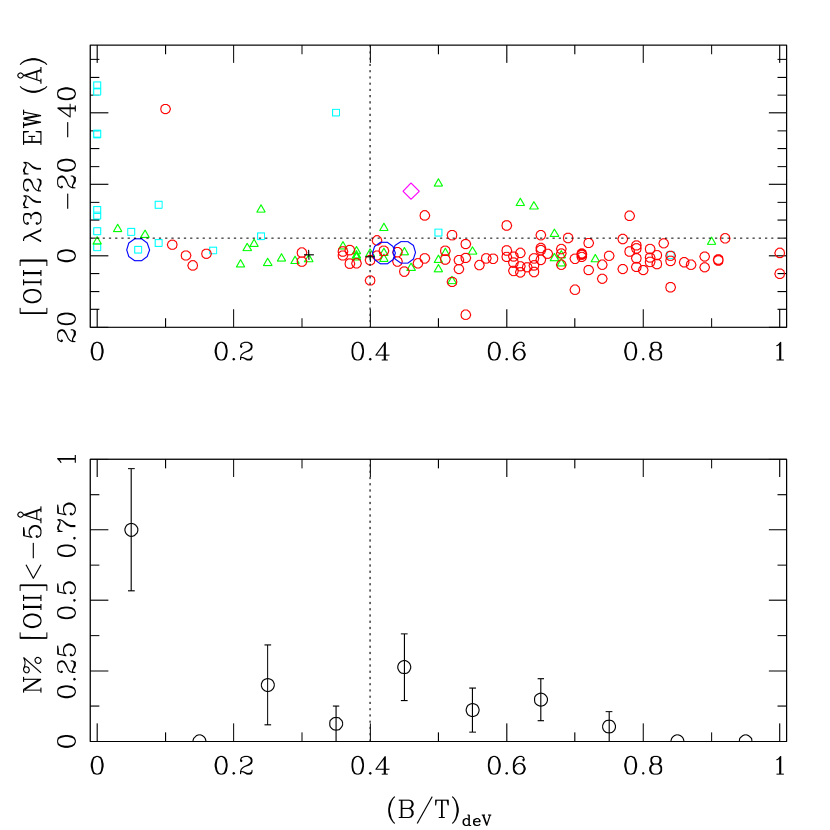
Figure 9 shows the distribution of the galaxies’ bulge fractions versus their [OII] equivalent widths; negative [OII] EW values correspond to emission. Of the 26/155 galaxies with significant [OII] emission ([OII] EWÅ), % are disk-dominated galaxies (). Even more compelling, 4 of the 7 galaxies with the highest star formation rates ([OII]Å) have , , completely disk-dominated systems.
Current star formation in cluster galaxies, as traced by [OII] emission, is not confined to only disk-dominated systems (see bottom panel, Fig. 9). Interestingly, % of galaxies with significant [OII] emission are bulge-dominated (). These galaxies span the range of luminosity ( mass), having , and include the BCG. We discuss this population in more detail in §4.2.
Comparison of the [OII] emission line strength to bulge fraction finds it to be correlated strongly with . Table 2 shows the average [OII] EW in four bins. The average [OII] emission is dramatically higher for galaxies with , dropping to zero for galaxies. Like Balogh et al. (1998), we find that the most bulge-dominated members () have [OII] EQW consistent with zero.
3.4.2 Current Star Formation vs. Galaxy Residuals
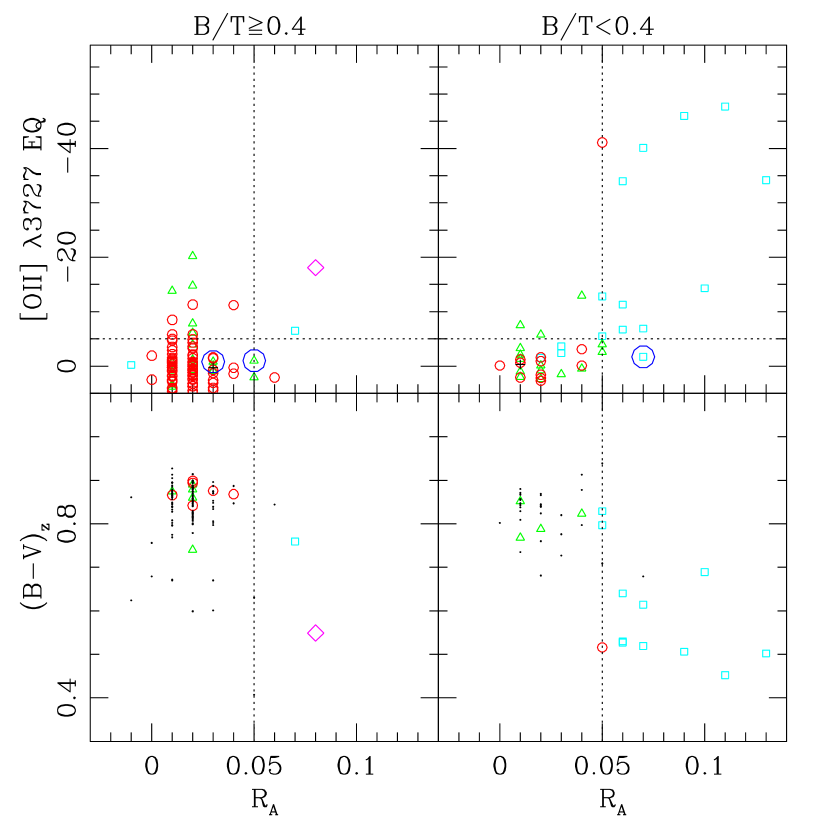
The correlation between high galaxy asymmetry and strong [OII] emission for bulge and disk-dominated galaxies is shown in Fig. 10. Approximately 70% of the high asymmetry galaxies have significant [OII] emission. For the disk-dominated members, there is a strong trend (99% confidence) of increasing [OII] emission with increasing ; most of these galaxies have high asymmetry and/or high total residuals and are blue. We find that current star formation in the disk-dominated population is highly correlated with measureable morphological disturbances.
Although 11 of the bulge-dominated galaxies do have strong [OII] emission, only three of these galaxies have and/or . Assuming the [OII] emission is due to star formation, active star formation tends to be distributed in a smooth and uniform manner when it occurs in members. Alternatively, these members may harbor active galactic nuclei (Martini et al. 2002); we discuss this possibility in greater detail in §4.2. Using the high total residual population instead of the high asymmetry one, we find essentially the same results.
4 Towards Understanding Different Galaxy Populations
4.1 E’s vs. S0’s: A Matter of Viewing Angle?
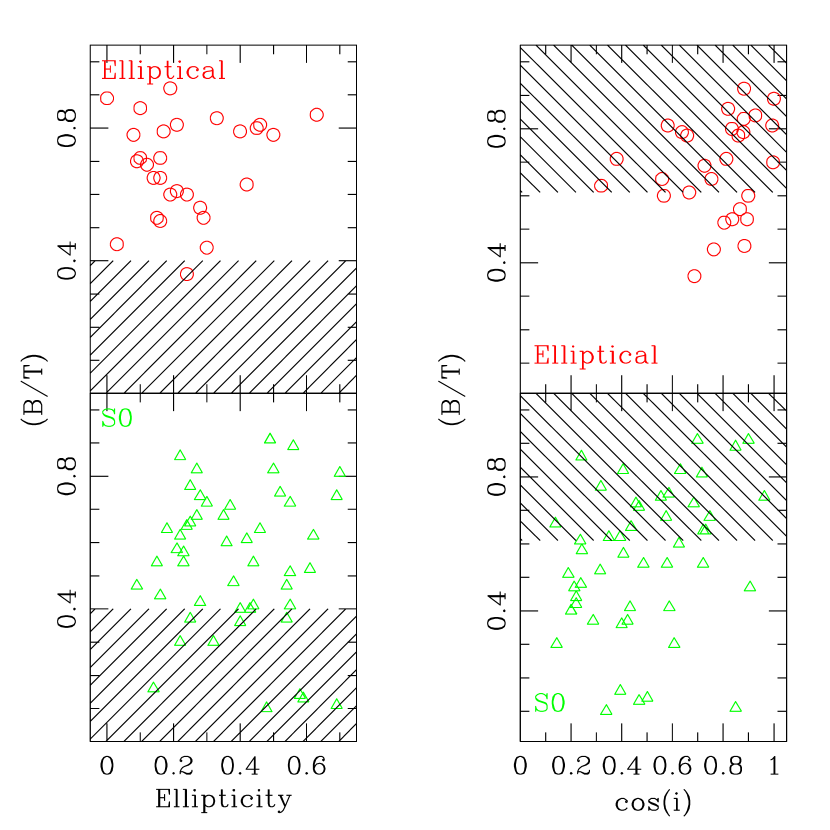
Jorgensen & Franx (1994) suggest that ellipticals and S0’s form the same galaxy class, such that ellipticals tend to be face-on members of this class while S0’s are more edge-on members. Our measurements of bulge ellipticity and disk inclination enable us to test this hypothesis. If the ellipticity and inclination distributions of these two populations are completely different but they span the same range in other physical properties, this would be strong evidence for these ellipticals being face-on S0’s. However, as the most luminous E/S0 galaxies ( BCGs) are hypothesized to have different formation histories (Kormendy & Bender 1996; Naab et al. 1999), we restrict our analysis to .
Classically, ellipticals can be circular (E0; axis ratio is 1) to cigar-shaped (E6; axis ratio is 0.4). Thus, visually typed ellipticals in CL 1358+62 (FFvD00) should span the range in bulge ellipticity and, for systems with disks, inclination; the same is true for S0 and even Sa galaxies. To test this, we plot in Fig. 11 the bulge ellipticity and disk inclination versus measured of E’s and S0’s. We include all visually typed E’s and S0’s in Fig. 11 for completeness but note that ellipticity and inclination measurements are robust only for and systems respectively.
Applying a K-S test to both the bulge ellipticity and disk inclination distributions of E’s and S0’s confirms they are different, yet their distributions (for ) are indistinguishable. Note also the conspicuous lack of round () S0’s, a population that should exist due to projection effects alone. To strengthen our argument, we compare the internal velocity dispersion333From Kelson et al. (2000b) we have for four ellipticals and 11 S0’s; for the rest, we use derived velocity dispersions (Tran et al. 2003)., half-light radius, projected cluster radius, [OII]3727, magnitude, and distributions of the E’s and S0’s. Using the K-S test, we find the distributions to be indistinguishable for all these parameters.
The fact that visually typed E’s and S0’s share similar properties with the exception of bulge ellipticity and disk inclination strongly suggests that these ellipticals are likely to be face-on S0’s. In addition, the range in for members classified as ellipticals (Fig. 11, top panel) shows that these are not pure galaxies. This supports results from recent observations and modeling (Rix et al. 1999; Burkert & Naab 2001) that a disk component exists in most ellipticals.
4.2 AGN’s in Cluster Ellipticals?
We find % of the total cluster population are bulge-dominated galaxies () with significant [OII] emission (Å) that, unlike their disk-dominated counterparts, display little morphological disruption (). A possible explanation for these unusual systems is that they are similar to the blue field ellipticals studied by Menanteau et al. (1999, 2001), bulge-dominated systems still forming stars in their cores. In this cluster, however, the majority of these systems are as red as the absorption population (see Fig. 10) even though their average [OII] emission is significantly higher ( Å vs. Å). Their bulge components are equally as red, these objects do not have blue cores and it is highly unlikely that their [OII] emission is due to a central starburst.
Our sample finds that the undisturbed, high [OII] emission, bulge-dominated members are not low mass objects. Comparison of internal velocity dispersions measured for half of this population (6/11) from Kelson et al. (2000b) shows ranges from km/s to with the BCG at km/s. While it could be argued that velocity dispersions are measured most easily for massive galaxies, thus introducing a bias exists against low mass () objects, the sample published by Kelson et al. (2000b) includes robust velocity dispersions to km/s.
These points suggest that the [OII] emission in these red, bulge-dominated galaxies originates from AGN activity rather than star formation. In Abell 2104, Martini et al. (2002) find a surprisingly high number of X-ray sources associated with red cluster galaxies; their lower limit on the AGN fraction of 5% is remarkably similar to our cluster fraction of low asymmetry, [OII] emitting, bulge-dominated members. Unlike the AGN candidates in this cluster, however, the majority of Martini et al. (2002)’s AGN candidates lack significant optical emission. It may be that the number of AGN candidates identified via [OII] emission only places a lower limit on the cluster AGN fraction.
4.3 E+A Galaxies
Following F98, we select post-starburst (“E+A”) galaxies as having no [OII] emission (Å) and strong Balmer absorption [(HHH Å). The nine spectroscopically confirmed E+A galaxies on the HST mosaics span the range in bulge fraction () but these are not bright galaxies (). Virtually all of them are blue (see Fig. 7, also Bartholomew et al. 2001), and a third of them show significant asymmetry or total residual (see Fig. 10). A detailed analysis of the cluster E+A population is presented in Tran et al. (2003).
5 Simulations: Robustness of Surface Brightness Models
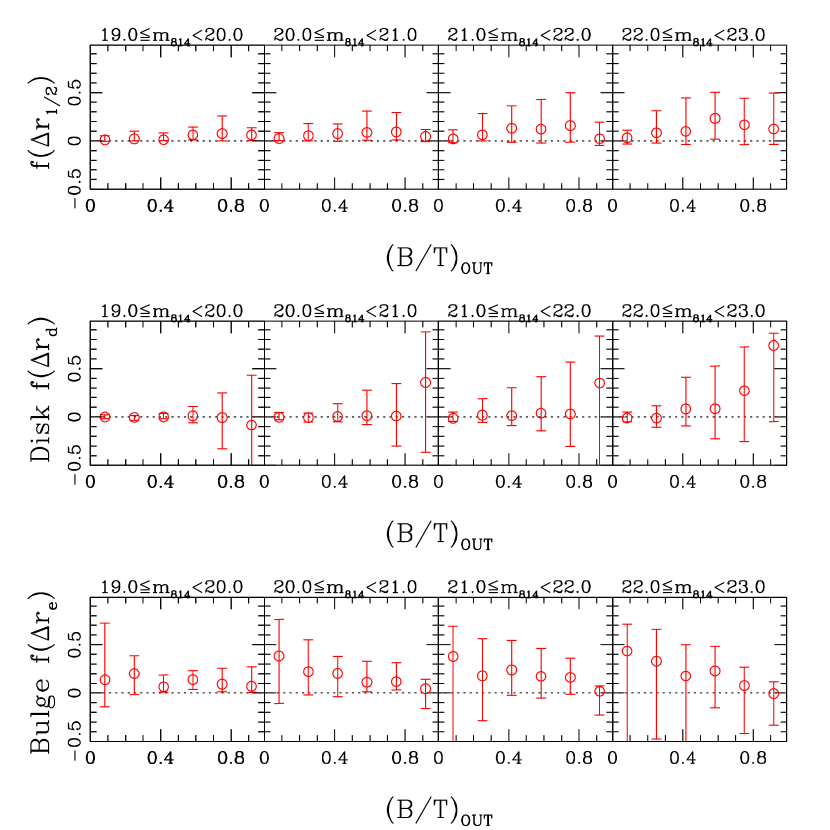
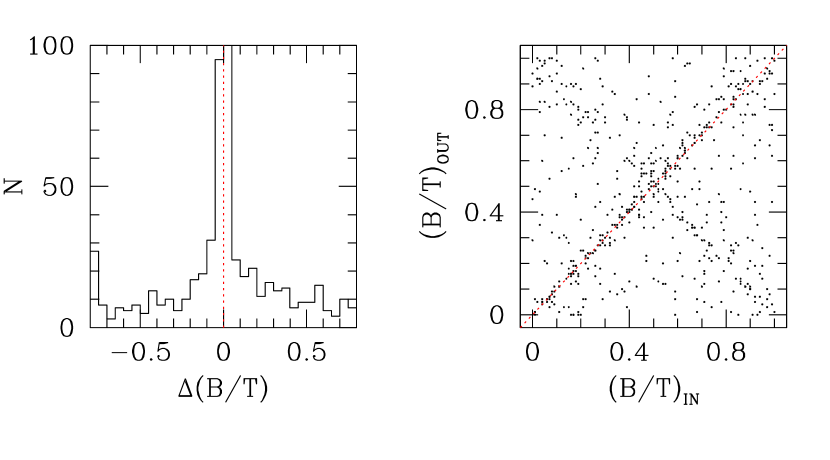
To test the robustness of structural parameters determined by fitting de Vaucouleurs bulge+exponential disk surface brightness models, we generate several thousand artificial galaxies and apply the same analysis. Note that we assume throughout this section that galaxies are described exactly by an bulge+exponential disk profile. In the following, we focus on errors associated with incorrect measurements of flux, , bulge ellipticity, disk inclination, half-light radius, and the scale lengths of the two profile components. We also include short discussions on the reliability of fitting Sérsic and exponential bulges.
5.1 Determining de Vaucouleurs Bulges
Artificial de Vaucouleurs bulge+exponential disk galaxies are generated uniformly to cover the same range in flux, bulge/total luminosity, scale lengths (, ), bulge eccentricity, and disk inclination as the cluster sample in the F814W filter (3600s integration). For simplicity, the bulge and disk position angles are fixed at . Once the smooth galaxy image is created, it is convolved with the appropriate TinyTim PSF, Poisson noise is added, and it is imbedded in a WF2 image section that is free of any detectable objects. At this point, the artificial galaxy catalog is analyzed in exactly the same manner as the observed sample.
By comparing measured to input values of the structural parameters for the artificial galaxies, we can map systematic and random errors due to the galaxy’s position in the multi-dimensional structural space. Systematic error is the median difference between the input and measured value for a parameter, and random error is the width of the distribution associated with the median difference. Statistics drawn from the simulations are robust across the range of and as the artificial catalog is well-sampled in each of these bins.
5.1.1 Total Magnitude
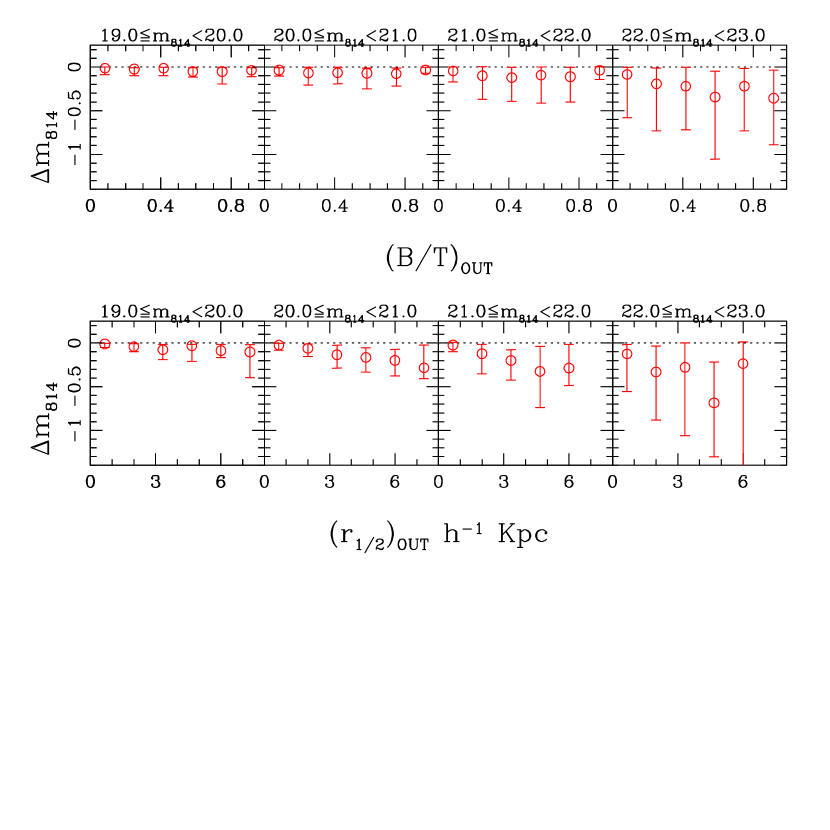
The top panel of Fig. 12 shows the median fractional difference between input and measured magnitude (F814) over the range of for the artificial catalog. For the brightest galaxies, the measured flux does not deviate significantly from the input value. At mags, however, we systematically underestimate the input flux by mags and maximum random errors increase to across the range of . With the exception of three galaxies (of 173), all of the CL 1358+62 sample are brighter than mags.
The bottom panel of Fig. 12 emphasizes how faint galaxies, and in particular low surface brightness ones, are adversely affected by decreasing signal-to-noise ratios. In each subpanel, we underestimate the total flux as measured increases, as the average surface brightness decreases. Even at fairly bright magnitudes ( mags), flux loss can be significant for galaxies with kpc. Fortunately, the median half-light radius of the CL 1358+62 cluster sample is kpc so this should not affect our conclusions.
5.1.2 Bulge/Total Luminosity
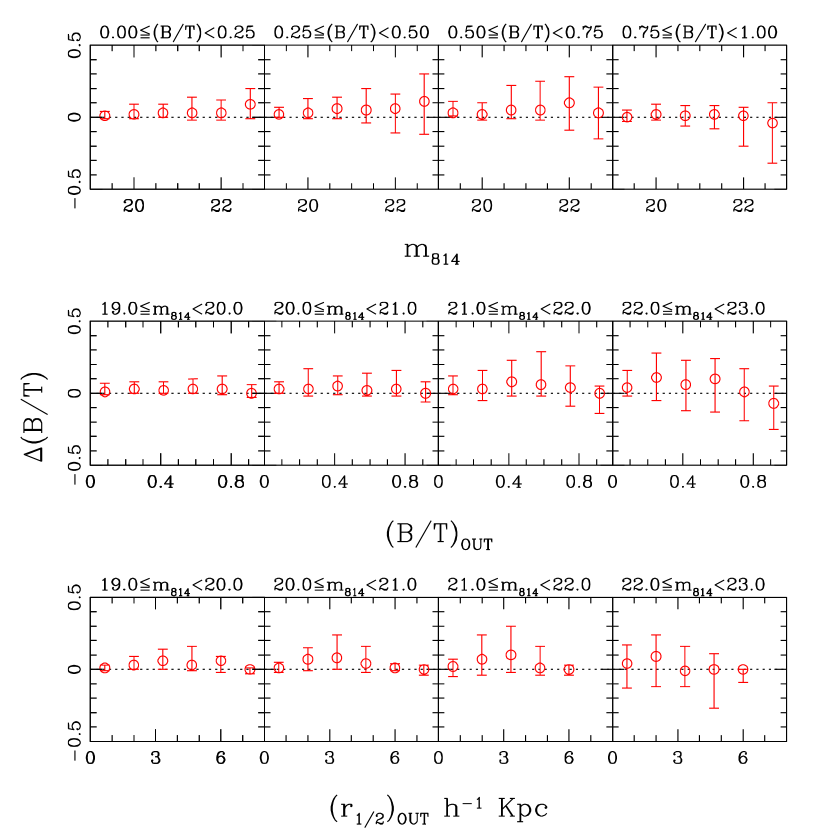
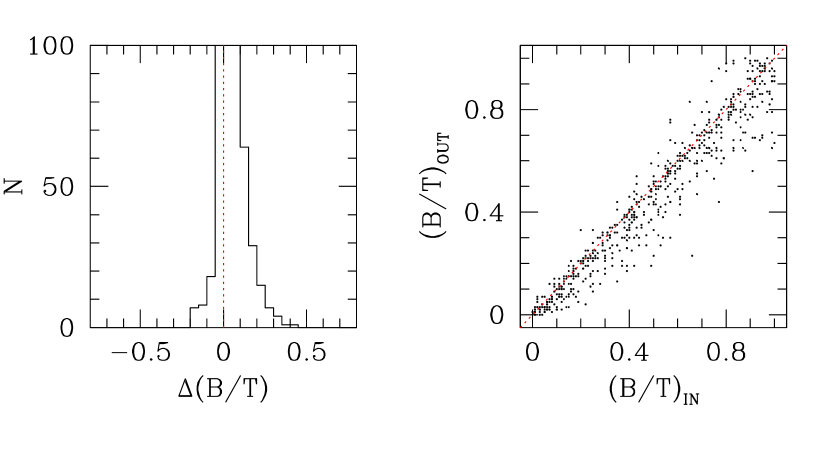
Figure 13 illustrates how the measured bulge fraction [] differs from its input value as a function of measured , , and . Above our magnitude cut of , the systematic differences between input and measured are negligible and the random errors are (see Fig. 14). These results lend confidence to measurement of the bulge/total luminosity for galaxies in our cluster sample.
5.1.3 Half-Light Radius and Bulge/Disk Scale Lengths
Figure 15 (top panel) shows the fractional difference between input and measured values of as a function of bulge fraction. Recovery of the half-light radius is robust for mags galaxies with systematic and random errors of less than 10% and 20% respectively. This is reiterated in the top panel of Fig. 16. Here we show the average input and measured values as a function of input bulge fraction. Only for the most bulge-dominated systems () are the differences systematically larger than as due to the long wings of the de Vaucouleurs profile, flux at large radii can be lost in the sky background.
Recovery of disk exponential scale length for galaxies is excellent. At mags, systematic and random errors for disk-dominated objects () are zero and respectively (middle panel, Fig. 15). In fact, the simulations show that measurements are robust up to (middle panel, Fig. 16).
In comparison, measurements of the bulge scale length are not as robust: tends to be underestimated (%) at all magnitudes (bottom panel, Figs. 15 & 16). Random errors, even for the most bulge-dominated systems, also are larger than those associated with the disk scale length. While this result is not surprising when considering the shape of the de Vaucouleurs profile, it can introduce a bias that would be particularly detrimental to large, bulge-dominated, low luminosity systems.
From these simulations, we determine that for the CL 1358+62 cluster sample: 1) Measurements of half-light radius across the range of are robust; 2) Disk scale lengths are reliable for galaxies with substantial disks (); and 3) The systematic uncertainties associated with measuring bulge scale lengths requires that care be applied in their interpretation, especially for galaxies with a small bulge component ().
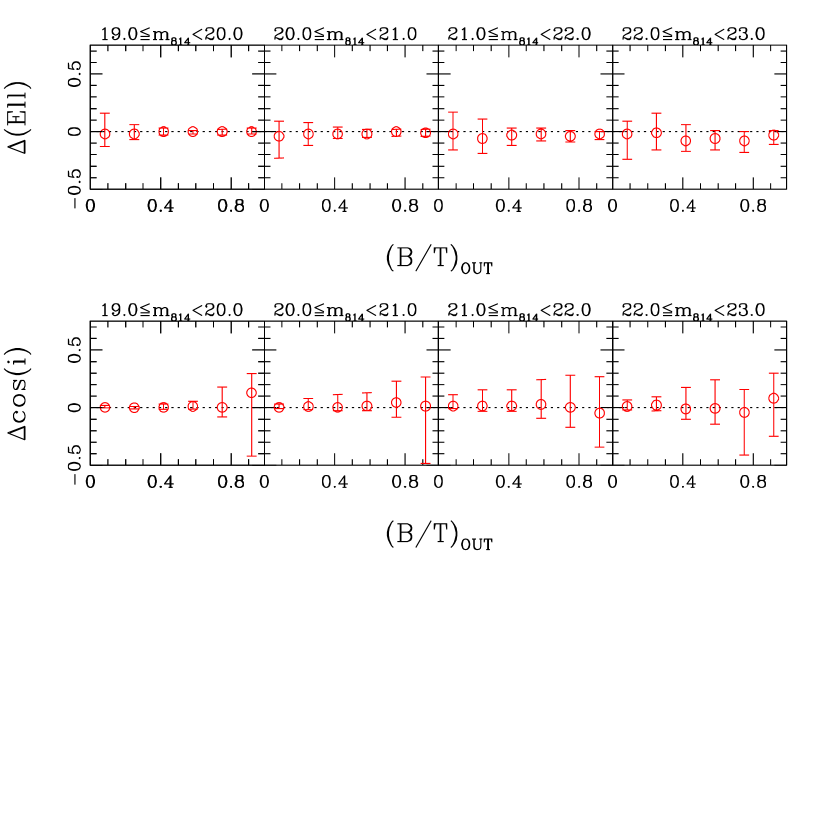
5.1.4 Bulge Ellipticity & Disk Inclination
To test the robustness of our results concerning ellipticals and S0’s, we compare input and measured values of bulge ellipticity and disk inclination. Figure 17 shows the average differences in bulge ellipticity and disk inclinations for artificial galaxies as a function of measured and apparent magnitude. At , both parameters are recovered well with median differences between input and measured values of approximately zero. The associated random errors in both ellipticity and cos are . As expected, random errors in the bulge ellipticity are largest for disk-dominated systems, and errors in cos largest in bulge-dominated systems.
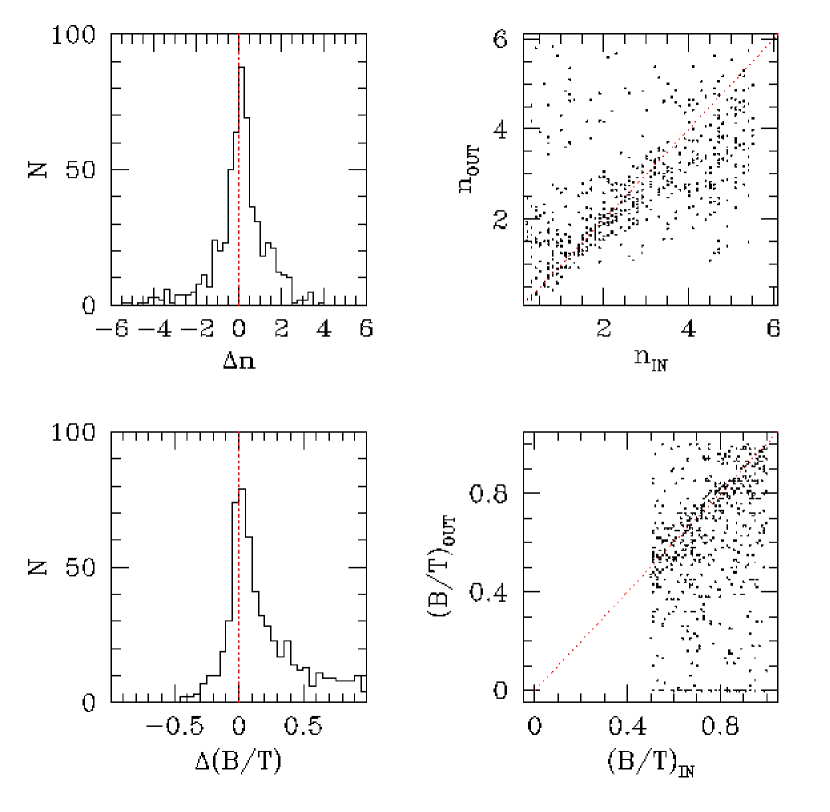
5.2 Determining Sérsic Bulges
We find that fitting Sérsic bulges with exponential disks to the cluster members results in a significant correlation between visual type and bulge fraction (see Fig. 1). By fitting Sérsic profiles, however, we must test our ability to recover the true bulge power . To do so, we create an artificial galaxy catalog of galaxies in the F814W filter with bulge fraction and bulge power between 0.2 and 6; all other structural parameters are the same as for the deVaucouleurs bulge+exponential disk artificial catalog. As before, we discuss results only for galaxies with mags.
5.2.1 Recovery of the Sérsic Index
For most galaxies (70%), we are within 0.5 of the true Sérsic bulge power (Fig. 18; top panel). Approximately 20% of the catalog, however, has and, in some cases, can be as much as . Even more disconcerting is the comparison of input versus measured bulge fraction (Fig. 18; lower panel). The distribution is skewed heavily towards underestimating the true bulge fraction (median ), and 23% of the galaxies are now considered disk-dominated systems even though none have input .
These simulations emphasize that measuring reliable Sérsic and the corresponding bulge fraction requires 1) a combination of excellent resolution and high signal-to-noise; 2) understanding how noise affects the measurements; and 3) rigorous testing of structural parameters derived for each galaxy.
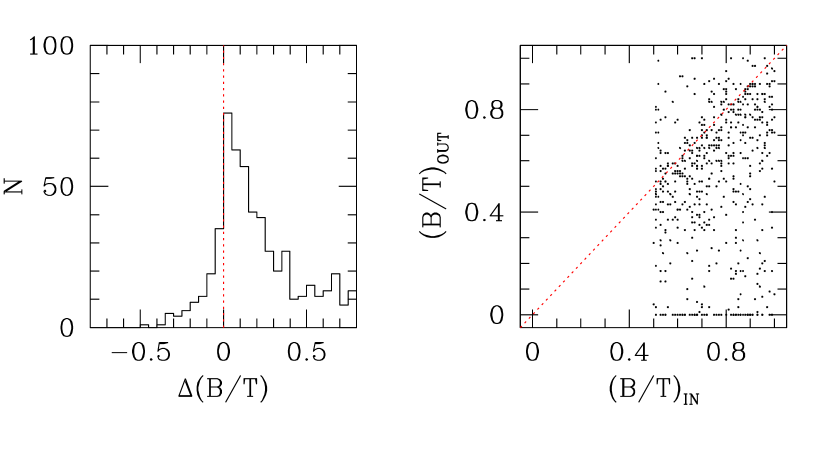
5.2.2 Fitting Sérsic Bulges with Profiles
With the artificial catalog of Sérsic bulge+exponential disk galaxies, we address the question of how serious the errors would be if we modeled them as de Vaucouleurs ( bulges. Figure 19 compares the input Sérsic compared to that recovered using the de Vaucouleurs profile. The distribution is as skewed towards underestimating the true bulge fraction as in Fig. 18; this is due primarily to high systems with bulge being confused as disk-dominated systems (see §5.3). Even for galaxies with higher Sérsic indices (), the average is still larger than if the true bulge profile is .
However, we find that the half-light radii (sizes) are robust. As for bulge ellipticities and bulge scale lengths of bulge-dominated [] galaxies, the systematic errors are still negligible but the random errors are larger by and respectively. Despite the uncertainty in , certain structural parameters such as half-light radius as well as bulge ellipticity and scale length [for ] are reliable.
5.3 Determining Exponential Bulges
Although the correlation between visual type and bulge fraction as determined using a double exponential profile is poor (see Fig.1), we test our ability to recover this profile for completeness. We create an artificial galaxy catalog of 1500 galaxies with exponential bulges and disks in the F814W filter that spans the range of . Again, we limit our discussion to galaxies with mags.
Figure 20 illustrates how the bulge/disk components often are reversed such that bulge-dominated systems become disk-dominated ones and vice versa. This ambiguity manifests as the long tails in the two panels of Fig. 20. While our inability to recover the true double exponential profile is not a compelling argument for not using it, these simulations demonstrate that a more sophisticated version of this profile is needed. For example, incorporating a truncation radius (van der Kruit & Searle 1982; van der Kruit 1987; de Grijs et al. 2001; Kregel et al. 2002) for the bulge component may alleviate the ambiguity.
6 Conclusions
Combining deep wide field HST imaging ( field; Mpc2) with ground-based spectroscopy, we characterize the physical properties of 173 cluster members in CL 1358+62 (). Our study is unique due to the large number of confirmed cluster members, the distance to the cluster, and the high physical resolution of the galaxies ( kpc). By fitting two component surface profiles directly to each galaxy, we measure their structural parameters and compare these results to current star formation, total galaxy colors, and cluster substructure. In this study, we examine the viability of three different bulge profiles (de Vaucouleurs, Sérsic, and exponential) paired with an exponential disk component.
We stringently test the robustness of our results by fitting thousands of artificial galaxies in the same manner as the sample; note that we assume galaxies are well-described by an bulge+exponential disk profile. As the artificial galaxy catalog spans the same range in luminosity, bulge fraction, half-light radius, and scale lengths as the cluster sample, we can quantify the systematic and random errors associated with the structural parameter measurements. From these simulations, we find that we tend to underestimate galaxy bulge fraction, especially for bulge-dominated objects. However, over the selected magnitude range ( mags; +5log) for the de Vaucouleurs bulge+exponential disk profile, measurements of have systematic errors of %.
Our conclusions are as follows:
-
1.
In this sample, the correlation between and Hubble type () is strong (99% confidence), but the scatter is large. In particular, early-type spirals cannot be distinguished from ellipticals and S0’s based on their bulge fraction.
-
2.
Using quantitative morphological parameters, we find a predominance of bulge-dominated (early-type) galaxies and an established morphology-density relation, both characteristics of a well-developped cluster.
-
3.
The physical properties, bulge ellipticities, disk inclinations, , half-light radii, and internal velocity dispersions, of the low luminosity () ellipticals and S0’s in our sample suggest that these ellipticals are likely to be face-on S0 galaxies.
-
4.
We find a population (%) of bulge-dominated, massive ( km s-1 ) members with significant [OII] emission (Å), morphologically smooth profiles, and colors as red as the absorption galaxies; the latter is true for both their total and bulge component. These physical characteristics suggest they harbor AGN.
-
5.
The most disk-dominated members () have significantly higher average [OII] equivalent widths than members with . Disk-dominated galaxies also tend to have high degrees of structural asymmetry.
-
6.
Mimicking the sample with thousands of artificial galaxies is integral in understanding how robust correlations between physical and spectral properties are. In particular, measuring accurate Sérsic indices at these redshifts requires significantly higher signal-to-noise and/or resolution than that of our WFPC2 imaging.
References
- Andredakis (1998) Andredakis, Y. C. 1998, MNRAS, 295, 725
- Andredakis et al. (1995) Andredakis, Y. C., Peletier, R. F., & Balcells, M. 1995, MNRAS, 275, 874A
- Balogh et al. (2002) Balogh, M., Bower, R. G., Smail, I., Ziegler, B. L., Davies, R. L., Gaztelu, A., & Fritz, A. 2002, MNRAS, 337, 256
- Balogh et al. (1998) Balogh, M. L., Schade, D., Morris, S. L., Yee, H. K. C., Carlberg, R. G., & Ellingson, E. 1998, ApJ, 504, L75
- Bartholomew et al. (2001) Bartholomew, L. J., Rose, J. A., Gaba, A. E., & Caldwell, N. 2001, AJ, 122, 2913
- Bertin & Arnouts (1996) Bertin, E. & Arnouts, S. 1996, A&A, 117, 393
- Binggeli & Cameron (1991) Binggeli, B. & Cameron, L. M. 1991, A&A, 252, 27
- Burkert & Naab (2001) Burkert, A. & Naab, T. 2001, astro-ph/0101553
- Caon et al. (1993) Caon, N., Capaccioli, M., & D’Onofrio, M. 1993, MNRAS, 265, 1013+
- Capaccioli (1989) Capaccioli, M. 1989, in The World of Galaxies, ed. H. G. Corwin & L. Bottinelli (Springer-Verlag), 208
- Conselice et al. (2000) Conselice, C. J., Bershady, M. A., & Jangren, A. 2000, ApJ, 529, 886
- Couch et al. (2001) Couch, W. J., Balogh, M. L., Bower, R. G., Smail, I., Glazebrook, K., & Taylor, M. 2001, ApJ, 549, 820
- Courteau et al. (1996) Courteau, S., de Jong, R. S., & Broeils, A. H. 1996, ApJ, 457L, 73
- de Grijs et al. (2001) de Grijs, R., Kregel, M., & Wesson, K. H. 2001, MNRAS, 324, 1074
- de Jong (1996) de Jong, R. S. 1996, A&AS, 118, 557
- de Vaucouleurs (1948) de Vaucouleurs, G. 1948, Ann. d’Astrophys., 11, 247
- Dressler (1980) Dressler, A. 1980, ApJ, 236, 351
- Dressler et al. (1997) Dressler, A., Oemler, A. J., Couch, W. J., Smail, I., Ellis, R. S., Barger, A., Butcher, H., Poggianti, B. M., & Sharples, R. M. 1997, ApJ, 490, 577
- Dressler & Shectman (1988) Dressler, A. & Shectman, S. A. 1988, AJ, 95, 985
- Fabricant et al. (2000) Fabricant, D., Franx, M., & van Dokkum, P. 2000, ApJ, 539, 577
- Fabricant et al. (1991) Fabricant, D. G., McClintock, J. E., & Bautz, M. W. 1991, ApJ, 381, 33
- Fisher et al. (1998) Fisher, D., Fabricant, D., Franx, M., & van Dokkum, P. 1998, ApJ, 498, 195+
- Graham (2001) Graham, A. W. 2001, AJ, 121, 820
- Graham & Prieto (1999) Graham, A. W. & Prieto, M. 1999, ApJ, 524, L23
- Hubble (1926) Hubble, E. P. 1926, ApJ, 64, 321
- Hutchings et al. (2002) Hutchings, J. B., Saintonge, A., Schade, D., & Frenette, D. 2002, AJ, 123, 1826
- Im et al. (2001) Im, M., Simard, L., Koo, D. C., Faber, S. M., Gebhardt, K., Willmer, C. N. A., Phillips, A., Illingworth, G., Vogt, N. P., & Sarajedini, V. L. 2001, AJ, 122, 750
- Jorgensen & Franx (1994) Jorgensen, I. & Franx, M. 1994, ApJ, 433, 553
- Kelson et al. (2001) Kelson, D. D., Illingworth, G. D., Franx, M., & van Dokkum, P. G. 2001, ApJ, 552, L17
- Kelson et al. (2000a) Kelson, D. D., Illingworth, G. D., van Dokkum, P. G., & Franx, M. 2000a, ApJ, 531, 137
- Kelson et al. (2000b) —. 2000b, ApJ, 531, 159
- Kelson et al. (2000c) —. 2000c, ApJ, 531, 184
- Kormendy & Bender (1996) Kormendy, J. & Bender, R. 1996, ApJ, 464, L119
- Kregel et al. (2002) Kregel, M., van der Kruit, P. C., & de Grijs, R. 2002, MNRAS, 334, 646
- Krist (1993) Krist, J. 1993, in ASP Conf. Ser. 52: Astronomical Data Analysis Software and Systems II, Vol. 2, 536+
- La Barbera et al. (2002) La Barbera, F., Busarello, G., Merluzzi, P., Massarotti, M., & Capaccioli, M. 2002, ApJ, 571, 790
- MacArthur et al. (2003) MacArthur, L. A., Courteau, S., & Holtzman, J. A. 2003, ApJ, in press
- Marleau & Simard (1998) Marleau, F. R. & Simard, L. 1998, ApJ, 507, 585
- Martini et al. (2002) Martini, P., Kelson, D. D., Mulchaey, J. S., & Trager, S. C. 2002, ApJ, submitted, astro
- Menanteau et al. (1999) Menanteau, F., Ellis, R. S., Abraham, R. G., Barger, A. J., & Cowie, L. L. 1999, MNRAS, 309, 208
- Menanteau et al. (2001) Menanteau, F., Jimenez, R., & Matteucci, F. 2001, ApJ, 562, L23
- Metropolis et al. (1953) Metropolis, N., Rosenbluth, A., Rosenbluth, M., Teller, A., & Teller, E. 1953, Journal of Chemical Physics, 21, 1087
- Naab et al. (1999) Naab, T., Burkert, A., & Hernquist, L. 1999, ApJ, 523, L133
- Nieto & Bender (1989) Nieto, J.-L. & Bender, R. 1989, A&A, 215, 266
- Poggianti et al. (1999) Poggianti, B. M., Smail, I., Dressler, A., Couch, W. J., Barger, A. J., Butcher, H., Ellis, R. S., & Oemler, A. 1999, ApJ, 518, 576
- Press et al. (1992) Press, W. H., Teukolsky, S. A., Vetterling, W. T., & Flannery, B. P. 1992, Numerical recipes in FORTRAN. The art of scientific computing (Cambridge: University Press, —c1992, 2nd ed.)
- Rix et al. (1999) Rix, H., Carollo, C. M., & Freeman, K. 1999, ApJ, 513, L25
- Rix & White (1990) Rix, H. & White, S. D. M. 1990, ApJ, 362, 52
- Ryden et al. (1999) Ryden, B. S., Terndrup, D. M., Pogge, R. W., & Lauer, T. R. 1999, ApJ, 517, 650
- Saha & Williams (1994) Saha, P. & Williams, T. B. 1994, AJ, 107, 1295
- Sandage & Visvanathan (1978) Sandage, A. & Visvanathan, N. 1978, ApJ, 225, 742
- Schade et al. (1995) Schade, D., Lilly, S. J., Crampton, D., Hammer, F., Le Fèvre, O., & Tresse, L. 1995, ApJ, 451, L1
- Sersic (1968) Sersic, J. L. 1968, Atlas de galaxias australes (Cordoba, Argentina: Observatorio Astronomico)
- Simard et al. (1999) Simard, L., Koo, D. C., Faber, S. M., Sarajedini, V. L., Vogt, N. P., Phillips, A. C., Gebhardt, K., Illingworth, G. D., & Wu, K. L. 1999, ApJ, 519, 563
- Simard et al. (2002) Simard, L., Willmer, C. N. A., Vogt, N. P., Sarajedini, V. L., Phillips, A. C., Weiner, B. J., Koo, D. C., Im, M., Illingworth, G. D., & Faber, S. M. 2002, ApJS, 142, 1
- Tran et al. (2003) Tran, K. H., Franx, M., Illingworth, G. D. I., van Dokkum, P., & Kelson, D. 2003, ApJ, in prep
- Tran et al. (1999) Tran, K. H., Kelson, D. D., van Dokkum, P., Franx, M., Illingworth, G. D., & Magee, D. 1999, ApJ, 522
- Tran et al. (2001) Tran, K. H., Simard, L., Zabludoff, A. I., & Mulchaey, J. S. 2001, ApJ, 549, 172
- Trujillo et al. (2001) Trujillo, I., Aguerri, J. A. L., Gutiérrez, C. M., & Cepa, J. 2001, AJ, 122, 38
- van der Kruit (1987) van der Kruit, P. C. 1987, A&A, 173, 59
- van der Kruit & Searle (1982) van der Kruit, P. C. & Searle, L. 1982, A&A, 110, 61
- van Dokkum & Franx (2001) van Dokkum, P. G. & Franx, M. 2001, ApJ, 553, 90
- van Dokkum et al. (2000) van Dokkum, P. G., Franx, M., Fabricant, D., Illingworth, G. D., & Kelson, D. D. 2000, ApJ, 541, 95
- van Dokkum et al. (1999) van Dokkum, P. G., Franx, M., Fabricant, D., Kelson, D. D., & Illingworth, G. D. 1999, ApJ, 520, L95
- van Dokkum et al. (1998a) van Dokkum, P. G., Franx, M., Kelson, D. D., & Illingworth, G. D. 1998a, ApJ, 504, L17
- van Dokkum et al. (1998b) van Dokkum, P. G., Franx, M., Kelson, D. D., Illingworth, G. D., Fisher, D., & Fabricant, D. 1998b, ApJ, 500, 714+


| ID | TypeaaHubble types from FFvD00. Here, morphological types are represented as E (-5), S0 (-2), Sa (1), Sb (3), Sc(5), Sd (7), Sm (9), and Im (10); mergers are indicated with (99), conflicted types as 999, and non-typed galaxies () with (-99). | bbMeasured in the F814W filter using a de Vaucouleurs bulge with exponential disk profile. | ccConverted to rest-frame and using transforms from vD98. | ccConverted to rest-frame and using transforms from vD98. | bbMeasured in the F814W filter using a de Vaucouleurs bulge with exponential disk profile. | bbMeasured in the F814W filter using a de Vaucouleurs bulge with exponential disk profile. | bbMeasured in the F814W filter using a de Vaucouleurs bulge with exponential disk profile. | bbMeasured in the F814W filter using a de Vaucouleurs bulge with exponential disk profile. | bbMeasured in the F814W filter using a de Vaucouleurs bulge with exponential disk profile. |
|---|---|---|---|---|---|---|---|---|---|
| 92 | –2 | 0.75 | 21.49 | 0.85 | 0.47 | 0.51 | 0.25 | 0.02 | 0.09 |
| 95 | –2 | 0.54 | 21.02 | 0.89 | 0.47 | 0.19 | 0.55 | 0.02 | 0.06 |
| 97 | 1 | 0.24 | 21.06 | 0.82 | 1.17 | 0.49 | 0.81 | 0.04 | 0.10 |
| 105 | –4 | 0.52 | 22.26 | 0.87 | 0.34 | 0.11 | 0.43 | 0.01 | 0.05 |
| 108 | –4 | 0.81 | 21.22 | 0.87 | 0.76 | 0.55 | 1.25 | 0.01 | –0.17 |
| 109 | –2 | 0.41 | 21.95 | 0.67 | 0.46 | 0.16 | 0.41 | 0.01 | 0.07 |
| 110 | 0 | 0.40 | 20.56 | 0.85 | 0.77 | 0.28 | 0.66 | 0.01 | 0.06 |
| 126 | –2 | 0.38 | 20.71 | 0.85 | 0.66 | 0.16 | 0.62 | 0.01 | 0.06 |
| 129 | 0 | 0.90 | 20.66 | 0.83 | 0.41 | 0.34 | 1.39 | 0.02 | 0.06 |
| 132 | 3 | 0.05 | 22.58 | 0.64 | 0.72 | 0.60 | 0.43 | 0.05 | 0.12 |
| 135 | –2 | 0.41 | 21.40 | 0.83 | 0.41 | 0.10 | 0.41 | 0.02 | 0.06 |
| 137 | 3 | 0.00 | 22.04 | 0.80 | 0.54 | 0.32 | 0.05 | 0.14 | |
| 142 | 0 | 0.31 | 20.82 | 0.86 | 0.96 | 0.40 | 0.71 | 0.01 | 0.07 |
| 143 | –4 | 0.60 | 21.73 | 0.87 | 0.38 | 0.29 | 0.29 | 0.01 | 0.04 |
| 149 | –4 | 0.80 | 21.59 | 0.84 | 0.56 | 0.45 | 0.56 | 0.01 | 0.06 |
| 164 | 0 | 0.42 | 20.36 | 0.87 | 1.19 | 0.45 | 1.05 | 0.03 | 0.10 |
| 167 | –2 | 0.72 | 22.07 | 0.60 | 0.53 | 0.38 | 0.54 | 0.02 | 0.08 |
| 171 | 0 | 0.42 | 22.47 | 0.74 | 0.48 | 0.13 | 0.48 | 0.02 | 0.09 |
| 178 | 5 | 0.00 | 20.98 | 0.50 | 1.06 | 0.63 | 0.13 | 0.18 | |
| 182 | –2 | 0.71 | 21.77 | 0.84 | 0.41 | 0.32 | 0.36 | 0.01 | 0.04 |
| 190 | 4 | 0.09 | 22.42 | 0.82 | 0.93 | 0.65 | 0.56 | 0.03 | 0.10 |
| 192 | 6 | 0.00 | 21.71 | 0.53 | 1.15 | 0.68 | 0.06 | 0.11 | |
| 200 | 0 | 0.00 | 20.45 | 0.71 | 1.42 | 0.85 | 0.05 | 0.15 | |
| 203 | –2 | 0.37 | 21.41 | 0.84 | 0.92 | 0.33 | 0.75 | 0.02 | 0.07 |
| 205 | –2 | 0.52 | 22.57 | 0.80 | 0.23 | 0.07 | 0.32 | 0.02 | 0.07 |
| 206 | 0 | 0.03 | 22.12 | 0.77 | 0.83 | 0.50 | 0.50 | 0.01 | 0.10 |
| 207 | –2 | 0.13 | 22.48 | 0.80 | 0.72 | 0.12 | 0.48 | 0.00 | 0.05 |
| 209 | 1 | 0.42 | 20.47 | 0.60 | 0.99 | 0.87 | 0.62 | 0.03 | 0.08 |
| 210 | –5 | 0.89 | 21.05 | 0.89 | 0.55 | 0.55 | 0.34 | 0.02 | 0.06 |
| 211 | –2 | 0.48 | 20.82 | 0.87 | 0.71 | 0.30 | 0.67 | 0.03 | 0.07 |
| 212 | –5 | 0.79 | 20.65 | 0.87 | 0.71 | 0.48 | 1.43 | 0.01 | 0.07 |
| 215 | –2 | 0.57 | 21.54 | 0.84 | 0.37 | 0.16 | 0.44 | 0.02 | 0.06 |
| 226 | 1 | 0.27 | 21.79 | 0.68 | 0.86 | 0.60 | 0.55 | 0.02 | 0.08 |
| 227 | 0 | 0.38 | 21.73 | 0.91 | 0.73 | 0.40 | 0.53 | 0.04 | 0.08 |
| 233 | –4 | 0.84 | 19.97 | 0.85 | 0.95 | 0.71 | 2.03 | 0.04 | 0.09 |
| 234 | 3 | 0.09 | 20.17 | 0.69 | 1.66 | 0.08 | 1.09 | 0.10 | 0.17 |
| 235 | –2 | 0.91 | 22.33 | 0.81 | 0.70 | 0.74 | 0.32 | 0.03 | 0.13 |
| 236 | –2 | 0.62 | 20.83 | 0.89 | 0.74 | 0.36 | 1.01 | 0.01 | 0.06 |
| 239 | –4 | 0.53 | 21.48 | 0.90 | 0.33 | 0.15 | 0.33 | 0.02 | 0.06 |
| 242 | –5 | 1.00 | 20.21 | 0.88 | 1.45 | 1.45 | 0.02 | 0.13 | |
| 243 | 1 | 0.68 | 21.99 | 0.41 | 0.48 | 0.55 | 0.25 | 0.05 | –0.02 |
| 246 | 1 | 0.46 | 21.72 | 0.84 | 0.65 | 0.36 | 0.52 | 0.01 | 0.09 |
| 248 | –2 | 0.68 | 21.15 | 0.93 | 0.32 | 0.18 | 0.44 | 0.01 | 0.04 |
| 254 | –4 | 0.61 | 20.65 | 0.87 | 0.68 | 0.55 | 0.49 | 0.01 | 0.04 |
| 256 | –5 | 0.70 | 19.36 | 0.88 | 1.20 | 0.74 | 1.49 | 0.01 | 0.04 |
| 264 | –99 | 0.00 | 22.41 | 0.06 | 0.85 | 0.51 | 0.10 | 0.17 | |
| 265 | 0 | 0.67 | 21.28 | 0.88 | 0.60 | 0.41 | 0.55 | 0.02 | –0.03 |
| 269 | –4 | 0.79 | 19.61 | 0.91 | 1.07 | 0.81 | 1.29 | 0.01 | 0.04 |
| 271 | –99 | 0.78 | 22.36 | 0.40 | 0.24 | 0.22 | 0.18 | 0.02 | 0.06 |
| 272 | –5 | 0.83 | 21.77 | 0.89 | 0.29 | 0.23 | 0.36 | 0.01 | 0.05 |
| 278 | –2 | 0.82 | 21.42 | 0.88 | 0.39 | 0.41 | 0.21 | 0.02 | 0.07 |
| 279 | –5 | 0.86 | 21.32 | 0.80 | 0.49 | 0.41 | 0.54 | 0.02 | 0.05 |
| 285 | 1 | 0.52 | 22.47 | 0.87 | 0.41 | 0.24 | 0.34 | 0.02 | 0.07 |
| 288 | –2 | 0.61 | 21.53 | 0.87 | 0.38 | 0.21 | 0.41 | 0.01 | –0.06 |
| 290 | 6 | 0.00 | 21.70 | 0.61 | 0.71 | 0.42 | 0.07 | 0.12 | |
| 292 | 0 | 0.29 | 20.76 | 0.78 | 0.57 | 0.33 | 0.39 | 0.03 | 0.07 |
| 293 | –2 | 0.64 | 22.43 | 0.85 | 0.25 | 0.10 | 0.57 | 0.03 | 0.09 |
| 295 | –2 | 0.86 | 20.89 | 0.86 | 0.72 | 0.71 | 0.47 | 0.02 | 0.06 |
| 298 | –2 | 0.68 | 20.20 | 0.91 | 0.78 | 0.93 | 0.38 | 0.02 | 0.05 |
| 299 | –5 | 0.45 | 21.98 | 0.83 | 0.61 | 0.16 | 0.67 | 0.03 | 0.09 |
| 300 | –2 | 0.77 | 20.85 | 0.88 | 0.40 | 0.31 | 0.39 | 0.01 | 0.04 |
| 303 | –5 | 0.84 | 20.70 | 0.86 | 0.62 | 0.47 | 1.15 | 0.02 | 0.05 |
| 305 | 3 | 0.24 | 21.56 | 0.83 | 0.90 | 0.29 | 0.65 | 0.05 | 0.05 |
| 309 | –4 | 0.79 | 20.58 | 0.90 | 0.54 | 0.39 | 0.71 | 0.02 | 0.05 |
| 311 | –2 | 0.65 | 22.14 | 0.84 | 0.25 | 0.15 | 0.28 | 0.02 | 0.05 |
| 318 | –2 | 0.68 | 21.75 | 0.81 | 0.44 | 0.27 | 0.51 | 0.02 | 0.08 |
| 323 | –2 | 0.37 | 21.91 | 0.84 | 0.44 | 0.14 | 0.38 | 0.02 | 0.07 |
| 328 | 1 | 0.45 | 20.62 | 0.63 | 0.68 | 0.47 | 0.47 | 0.05 | 0.09 |
| 329 | –2 | 0.66 | 21.43 | 0.82 | 0.77 | 0.59 | 0.61 | 0.02 | 0.09 |
| 331 | –99 | 0.84 | 22.77 | 0.86 | 0.11 | 0.08 | 0.38 | 0.01 | 0.06 |
| 335 | 0 | 0.62 | 21.28 | 0.86 | 0.62 | 0.37 | 0.60 | 0.02 | 0.09 |
| 343 | –2 | 0.91 | 21.35 | 0.67 | 0.50 | 0.52 | 0.25 | 0.01 | 0.06 |
| 344 | 0 | 0.38 | 21.42 | 0.83 | 0.94 | 0.63 | 0.63 | 0.01 | 0.07 |
| 346 | –2 | 0.62 | 20.53 | 0.78 | 0.53 | 0.25 | 0.70 | 0.02 | 0.05 |
| 347 | –5 | 0.51 | 20.61 | 0.86 | 0.98 | 0.34 | 1.15 | 0.01 | 0.01 |
| 349 | 0 | 0.50 | 22.21 | 0.83 | 0.69 | 0.32 | 0.63 | 0.01 | 0.06 |
| 350 | –2 | 0.74 | 22.18 | 0.89 | 0.21 | 0.18 | 0.16 | 0.03 | 0.08 |
| 351 | 3 | 0.50 | 20.67 | 0.76 | 0.86 | 0.52 | 0.67 | 0.07 | 0.13 |
| 352 | –5 | 0.70 | 21.92 | 0.88 | 0.31 | 0.19 | 0.40 | 0.01 | 0.05 |
| 354 | –5 | 0.92 | 22.03 | 0.87 | 0.20 | 0.19 | 0.13 | 0.02 | 0.04 |
| 356 | 1 | 0.50 | 20.25 | 0.89 | 0.97 | 0.39 | 0.99 | 0.02 | 0.08 |
| 357 | –5 | 0.78 | 21.39 | 0.87 | 0.21 | 0.13 | 0.70 | 0.04 | 0.19 |
| 358 | –5 | 0.84 | 21.82 | 0.87 | 0.44 | 0.34 | 0.74 | 0.03 | 0.07 |
| 359 | –2 | 0.87 | 20.55 | 0.85 | 0.56 | 0.44 | 1.28 | 0.02 | 0.08 |
| 361 | 1 | 0.39 | 21.81 | 0.85 | 0.55 | 0.21 | 0.46 | 0.01 | 0.06 |
| 366 | –4 | 0.71 | 21.01 | 0.86 | 0.57 | 0.38 | 0.63 | 0.01 | 0.07 |
| 368 | 2 | 0.84 | 21.18 | 0.86 | 2.69 | 2.14 | 3.55 | –0.01 | 0.18 |
| 369 | 0 | 0.67 | 21.06 | 0.88 | 0.86 | 0.61 | 0.77 | 0.02 | 0.07 |
| 371 | 1 | 0.22 | 20.05 | 0.87 | 1.41 | 0.38 | 1.01 | 0.01 | 0.06 |
| 375 | –5 | 0.48 | 19.20 | 0.89 | 2.90 | 1.25 | 2.73 | 0.02 | –0.01 |
| 376 | –2 | 0.47 | 21.30 | 0.88 | 0.36 | 0.10 | 0.44 | 0.03 | 0.06 |
| 377 | 5 | 0.05 | 20.43 | 0.64 | 1.84 | 1.32 | 1.10 | 0.06 | 0.16 |
| 380 | 6 | 0.00 | 21.28 | 0.53 | 1.14 | 0.68 | 0.06 | 0.15 | |
| 381 | –4 | 0.64 | 20.72 | 0.87 | 0.94 | 0.44 | 1.52 | 0.01 | 0.09 |
| 383 | 999 | 0.40 | 22.08 | 0.84 | 0.58 | 0.33 | 0.43 | 0.03 | 0.07 |
| 388 | 8 | 0.25 | 22.76 | 0.86 | 0.49 | 0.35 | 0.31 | 0.01 | 0.05 |
| 394 | 0 | 0.21 | 22.07 | 0.84 | 0.51 | 0.07 | 0.39 | 0.02 | 0.02 |
| 396 | 8 | 0.00 | 21.46 | 0.45 | 1.02 | 0.61 | 0.11 | 0.18 | |
| 400 | –2 | 0.54 | 22.38 | 0.85 | 0.15 | 0.04 | 0.24 | 0.01 | 0.05 |
| 406 | –5 | 0.81 | 22.57 | 0.76 | 0.38 | 0.33 | 0.34 | 0.00 | 0.07 |
| 408 | –2 | 0.89 | 21.02 | 0.86 | 0.44 | 0.43 | 0.29 | 0.01 | 0.06 |
| 409 | –5 | 0.61 | 21.90 | 0.90 | 0.49 | 0.27 | 0.50 | 0.01 | 0.06 |
| 410 | –2 | 0.58 | 21.43 | 0.87 | 0.53 | 0.24 | 0.64 | 0.02 | 0.07 |
| 411 | 0 | 0.50 | 21.80 | 0.80 | 0.58 | 0.38 | 0.44 | 0.01 | 0.07 |
| 416 | –2 | 0.64 | 22.33 | 0.84 | 0.20 | 0.12 | 0.20 | 0.02 | 0.04 |
| 420 | –99 | 0.45 | 22.71 | 0.62 | 0.52 | 0.35 | 0.37 | –0.01 | 0.04 |
| 421 | –5 | 0.65 | 21.59 | 0.90 | 0.43 | 0.23 | 0.56 | 0.03 | 0.08 |
| 434 | –5 | 0.79 | 22.50 | 0.88 | 0.12 | 0.07 | 0.32 | 0.02 | 0.04 |
| 440 | 0 | 0.38 | 21.60 | 0.84 | 0.53 | 0.20 | 0.44 | 0.02 | 0.07 |
| 442 | 0 | 0.71 | 23.23 | 0.85 | 0.24 | 0.18 | 0.21 | 0.02 | 0.07 |
| 444 | –2 | 0.60 | 21.01 | 0.90 | 0.70 | 0.67 | 0.43 | 0.01 | 0.06 |
| 447 | –2 | 0.44 | 21.58 | 0.90 | 0.52 | 0.21 | 0.46 | 0.02 | 0.08 |
| 453 | 5 | 0.35 | 20.78 | 0.52 | 1.37 | 2.02 | 0.73 | 0.07 | 0.15 |
| 454 | 0 | 0.51 | 20.55 | 0.81 | 0.95 | 1.41 | 0.46 | 0.02 | 0.07 |
| 457 | 0 | 0.23 | 21.72 | 0.85 | 0.56 | 0.11 | 0.42 | 0.01 | 0.07 |
| 460 | –2 | 0.36 | 22.26 | 0.84 | 0.37 | 0.11 | 0.32 | 0.01 | 0.05 |
| 463 | –2 | 0.77 | 20.59 | 0.88 | 0.71 | 0.59 | 0.59 | 0.02 | 0.05 |
| 465 | 1 | 0.64 | 21.26 | 0.87 | 0.63 | 0.41 | 0.59 | 0.01 | 0.08 |
| 468 | –2 | 0.30 | 21.36 | 0.87 | 0.48 | 0.06 | 0.43 | 0.02 | 0.06 |
| 470 | –5 | 1.00 | 20.05 | 0.87 | 0.96 | 0.96 | 0.01 | 0.10 | |
| 473 | –2 | 0.40 | 21.88 | 0.82 | 0.52 | 0.26 | 0.40 | 0.02 | 0.06 |
| 481 | –2 | 0.40 | 22.04 | 0.81 | 0.54 | 0.39 | 0.36 | 0.02 | 0.06 |
| 482 | –5 | 0.60 | 22.16 | 0.86 | 0.23 | 0.14 | 0.21 | 0.01 | 0.04 |
| 492 | 1 | 0.36 | 21.37 | 0.94 | 0.90 | 0.31 | 0.73 | 0.05 | 0.14 |
| 493 | –4 | 0.78 | 22.50 | 0.81 | 0.26 | 0.18 | 0.35 | 0.01 | 0.08 |
| 498 | –2 | 0.14 | 22.04 | 0.82 | 0.59 | 0.05 | 0.41 | 0.02 | 0.07 |
| 507 | 2 | 0.06 | 20.91 | 0.68 | 1.17 | 0.08 | 0.74 | 0.07 | 0.11 |
| 510 | –2 | 0.51 | 21.35 | 0.86 | 0.47 | 0.25 | 0.41 | 0.02 | 0.05 |
| 514 | –2 | 0.72 | 21.89 | 0.80 | 0.47 | 0.34 | 0.47 | 0.03 | 0.07 |
| 519 | –2 | 0.10 | 22.19 | 0.52 | 0.60 | 0.20 | 0.38 | 0.05 | 0.06 |
| 523 | 0 | 0.73 | 20.83 | 0.91 | 0.99 | 0.75 | 0.91 | 0.01 | 0.05 |
| 525 | 0 | 0.68 | 21.17 | 0.85 | 0.62 | 0.41 | 0.63 | 0.03 | 0.14 |
| 528 | 15 | 0.00 | 21.23 | 0.51 | 1.24 | 0.74 | 0.09 | 0.18 | |
| 534 | –5 | 0.44 | 21.58 | 0.89 | 0.40 | 0.14 | 0.37 | 0.01 | 0.06 |
| 536 | –5 | 0.65 | 19.84 | 0.87 | 1.21 | 0.72 | 1.30 | 0.02 | 0.05 |
| 537 | –2 | 0.82 | 21.46 | 0.89 | 0.31 | 0.27 | 0.26 | 0.02 | 0.07 |
| 539 | –2 | 0.81 | 22.24 | 0.82 | 0.23 | 0.16 | 0.46 | 0.02 | 0.08 |
| 540 | –2 | 0.54 | 21.70 | 0.89 | 0.35 | 0.12 | 0.49 | 0.02 | 0.06 |
| 542 | –5 | 0.53 | 20.98 | 0.88 | 0.45 | 0.20 | 0.47 | 0.02 | 0.04 |
| 544 | –2 | 0.42 | 21.16 | 0.88 | 0.73 | 0.23 | 0.69 | 0.03 | 0.13 |
| 546 | –4 | 0.56 | 21.82 | 0.80 | 0.28 | 0.10 | 0.40 | 0.03 | 0.07 |
| 549 | 2 | 0.17 | 21.09 | 0.76 | 0.94 | 0.15 | 0.66 | 0.02 | 0.11 |
| 553 | 5 | 0.00 | 22.27 | 0.73 | 0.51 | 0.31 | 0.03 | 0.24 | |
| 554 | –5 | 0.71 | 20.55 | 0.90 | 0.66 | 0.39 | 0.94 | 0.02 | 0.15 |
| 555 | –2 | 0.30 | 22.35 | 0.87 | 0.37 | 0.08 | 0.31 | 0.02 | 0.05 |
| 560 | 0 | 0.55 | 21.01 | 0.85 | 0.82 | 0.37 | 0.89 | 0.02 | 0.07 |
| 565 | –2 | 0.74 | 22.50 | 0.68 | 0.44 | 0.48 | 0.23 | 0.00 | 0.11 |
| 572 | –2 | 0.11 | 22.43 | 0.88 | 0.73 | 0.98 | 0.42 | 0.04 | 0.07 |
| 584 | –5 | 0.65 | 22.18 | 0.84 | 0.37 | 0.18 | 0.54 | 0.01 | 0.10 |
| 587 | 1 | 0.07 | 22.30 | 0.79 | 0.84 | 0.41 | 0.52 | 0.02 | 0.07 |
| 591 | 99 | 0.46 | 22.24 | 0.55 | 1.17 | 2.01 | 0.55 | 0.08 | 0.20 |
| 594 | –99 | 0.60 | 22.64 | 0.71 | 0.13 | 0.13 | 0.08 | 0.02 | 0.05 |
| 626 | 1 | 0.25 | 20.94 | 0.88 | 1.03 | 0.29 | 0.76 | 0.01 | 0.07 |
| 1414 | 3 | 0.65 | 22.79 | 0.78 | 0.45 | 0.75 | 0.16 | 0.01 | 0.11 |
| 1455 | –99 | 0.73 | 22.78 | 0.82 | 0.33 | 0.27 | 0.26 | 0.02 | 0.08 |
| 1461 | –99 | 0.40 | 23.00 | 0.77 | 0.67 | 0.59 | 0.41 | 0.01 | 0.07 |
| 1475 | –2 | 0.47 | 21.82 | 0.84 | 0.61 | 0.34 | 0.48 | 0.06 | 0.09 |
| 1487 | –99 | 0.00 | 24.06 | 0.46 | 0.61 | 0.36 | 0.03 | 0.01 | |
| 1524 | –2 | 0.16 | 22.72 | 0.84 | 0.43 | 0.15 | 0.28 | 0.01 | 0.03 |
| 1563 | –5 | 0.79 | 22.34 | 0.67 | 0.62 | 0.52 | 0.56 | 0.03 | 0.08 |
| 1594 | 1 | 0.63 | 24.38 | 0.80 | 0.66 | 0.31 | 0.96 | –0.12 | 0.12 |
| 1616 | –99 | 0.29 | 22.81 | 0.81 | 0.46 | 0.07 | 0.39 | 0.01 | 0.05 |
| 1630 | –2 | 0.00 | 22.70 | 0.57 | 0.46 | 0.27 | 0.03 | 0.09 | |
| 1649 | –4 | 0.63 | 22.37 | 0.82 | 0.34 | 0.24 | 0.29 | 0.02 | 0.07 |
| 1775 | –4 | 0.36 | 22.38 | 0.80 | 0.83 | 0.58 | 0.55 | 0.04 | 0.12 |
| 1806 | –2 | 0.62 | 22.59 | 0.83 | 0.54 | 0.55 | 0.32 | 0.01 | 0.08 |
| 1816 | –99 | 0.69 | 23.03 | 0.80 | 0.48 | 0.47 | 0.29 | 0.01 | 0.11 |
| 1829 | –99 | 0.12 | 24.40 | 0.43 | 0.44 | 0.67 | 0.26 | 0.05 | 0.18 |
| 1842 | –4 | 0.11 | 23.42 | 0.73 | 1.06 | 0.93 | 0.64 | 0.01 | 0.18 |
| 1865 | –5 | 0.69 | 22.22 | 0.80 | 0.54 | 0.43 | 0.43 | 0.01 | 0.11 |
| 1871 | –5 | 0.71 | 21.02 | 0.89 | 0.77 | 0.47 | 1.04 | 0.04 | 0.07 |
| 1897 | 999 | 0.31 | 22.34 | 0.87 | 0.76 | 0.67 | 0.47 | 0.01 | 0.11 |
| 1978 | –99 | 0.15 | 23.23 | 0.90 | 0.48 | 0.24 | 0.31 | 0.03 | 0.10 |
| N | EQ (Å) | ||
|---|---|---|---|
| 26 | |||
| 37 | |||
| 60 | |||
| 32 |