A two-component ionized reflection model of MCG–6-30-15
Abstract
Ionized reflection has often been considered as the explanation for the unusual Fe K variability observed in MCG–6-30-15. In this paper, we test this model using a 325 ks observation of MCG–6-30-15 by XMM-Newton and BeppoSAX. The data are fit between 2.5 and 80 keV with the constant density models of Ross & Fabian. The best fit ionized reflection model requires the Fe K line to be split into two reprocessing events: one from the inner disc to build up the red wing, and the other from the outer accretion disc to fit the blue horn. The implied geometry is a disc which becomes strongly warped or flared at large radii. A good fit was obtained with a solar abundance of iron and a reflection fraction () of unity for the inner reflector. The combination of the two reflection spectra can appear to have as required by the BeppoSAX data. The inner reflector has an ionization parameter , but the outer one is neutral with an inner radius gravitational radii (), corresponding to a light crossing time of about an hour for a 107 M⊙ black hole. Applying this model to time-resolved spectra shows that the inner reflector becomes more ionized as the source brightens. This reduces the strength of the red wing at high flux states. The X-ray source is constrained to arise from a narrow annulus at , with only 6 per cent of the 2–10 keV flux due to the outer reprocessor. This amount of localized energy generation is extremely difficult to produce without resorting to other energy sources such as the black hole spin. In fact, all the Fe K models fit to XMM-Newton spectra of MCG–6-30-15 require a large increase in energy production at the inner edge of the accretion disc.
keywords:
galaxies: active – galaxies: Seyfert: general – galaxies: individual: MCG–6-30-15 – X-rays: galaxies1 Introduction
X-ray observations of active galactic nuclei (AGN) allow for an unparalleled probe of the physics at the inner edge of the accretion disc. Spectral features such as a strong Fe K line at 6.4 keV (see Reynolds & Nowak (2003) for a recent review) and a flattening of the power-law slope above 10 keV (Pounds et al., 1990; Nandra & Pounds, 1994) are indications that some fraction of the X-radiation is being reprocessed (or reflected) in optically-thick material (e.g., George & Fabian, 1991; Matt, Perola & Piro, 1991). Using the ASCA observatory Tanaka et al. (1995) discovered a broad, asymmetric Fe K line in the bright Seyfert 1 galaxy MCG–6-30-15 () that was consistent with the profile expected from an emission line produced near 6 gravitational radii (6 ; ) from the black hole (Fabian et al., 1989; Laor, 1991). Therefore, the reflection signatures observed in X-ray spectra of AGN are likely caused by reprocessing within the accretion disc – a plausible scenario if the X-ray source resides in a hot corona above the disc (Galeev, Rosner & Vaiana, 1979; Haardt & Maraschi, 1991; Haardt & Maraschi, 1993).
In the disc-corona geometry it is expected that the Fe K line will respond rapidly ( s for a 107 M⊙ black hole) to any change in the continuum (Stella, 1990; Matt & Perola, 1992). Thus, the expectation is to observe a correlation between the line flux and the continuum flux, and a constant Fe K equivalent width (EW). However, many long observations of MCG–6-30-15 have shown that the Fe line exhibits little variability (Lee et al., 2000; Reynolds, 2000; Shih, Iwasawa & Fabian, 2002; Fabian et al., 2002b) despite large (factors of 2–3) changes in the continuum flux, and an EW that decreases as the source brightens. Moreover, when variations were detected they were found to be uncorrelated with the continuum variability (Iwasawa et al., 1996, 1999; Vaughan & Edelson, 2001). This perceived lack of Fe K reverberation is a major challenge to the disc-corona model of X-ray production in AGN.
A possible solution to this problem is if the Fe line arises from the surface of a strongly photoionized accretion disc (Iwasawa et al., 1996; Lee et al., 2000; Reynolds, 2000; Ballantyne & Ross, 2002). When iron is highly ionized then increasing the strength of the illumination will result in a weaker Fe K line relative to the continuum (see Fig. 2 in Matt, Fabian & Ross 1996). The flux of the line can thus remain approximately constant despite variations in the driving continuum. This situation can occur when helium-like Fe is the dominant ionization state (Matt, Fabian & Ross, 1993; Ballantyne, Fabian & Ross, 2002), and thus requires the disc surface to have a high ionization parameter, , where . The major difficulty with this solution is that the He-like Fe K line occurs at 6.7 keV, but the line core of MCG–6-30-15 is well established to be at 6.4 keV, and does not arise from very distant material (Lee et al., 2002). Therefore, at first glance it seems unlikely that the Fe K line arises from an ionized disc.
One way to check this interpretation is to compare the entire spectrum to models of X-ray reflection from accretion discs. Calculations of X-ray reprocessing have shown that the shape of the spectrum is sensitive to the ionization state of the material (Ross & Fabian, 1993; Ross, Fabian & Young, 1999), its density distribution (Nayakshin, Kazanas & Kallman, 2000; Ballantyne, Ross & Fabian, 2001; Dumont et al., 2002; Różańska et al., 2002), and the properties of the illuminating radiation (Ballantyne & Ross, 2002). These models self-consistently calculate the strength of the Fe K line which changes as a function of ionization state and abundance (Ballantyne et al., 2002), so the line and the entire continuum can be fit simultaneously with only a few parameters.
This exercise was previously performed for MCG–6-30-15 by Ballantyne & Fabian (2001) using ASCA data. They found that the data between 3 and 10 keV (the 3 keV cut-off was used to avoid the warm absorber) was well fit by an ionized reflector, but required the addition of a separate line component further out along the disc. However, a good fit was also obtained by a single, neutral constant density reflector with twice the solar iron abundance. From those data it was unclear which interpretation was more plausible.
Producing a physical model for the X-ray spectrum and spectral variability of MCG–6-30-15 is highly involved and there is no unique solution to this problem. In this paper we explore the implications for models in which the spectrum is dominated by features from a photoionized accretion disc. Specifically, we improve on the results of Ballantyne & Fabian (2001) and develop a model for the spectrum of MCG–6-30-15 in terms of reflection from two distinct sites on the disc and test this model against the observed spectral variability. An alternative model, in which the reflection spectrum is physically disconnected from the continuum due to relativistic effects, is discussed by Fabian & Vaughan (2003). We make use of data obtained from a 325 ks observation of MCG–6-30-15 by XMM-Newton and from a simultaneous observation by BeppoSAX (Fabian et al., 2002b).
In the next section, the data and models are briefly introduced. In Section 3 we use the broad-band BeppoSAX data to constrain the reflection spectrum in a manner independent of the iron line. Section 4 presents the results of the ionized disc fits. The findings are discussed in Section 5 before conclusions are presented in Section 6.
2 Data and Models
Details of the observations are given in Fabian et al. (2002b). For the present paper the data were processed using XMM-Newton Science Analysis System (SAS) v5.3.3, with source data extracted from circular regions of radius 35′′ from the EPIC MOS and pn. Background events were extracted from off-source regions. Events corresponding to patterns 0–12 (single–quadruple pixel events) were extracted from MOS and patterns 0–4 (singles and doubles) were used for the pn analysis, after checking for consistency with the data extracted using only single pixel events (pattern 0). Standard redistribution matrices (m1_r6_all_15.rmf) for MOS1 (similarly for MOS2) and (epn_sw20_sdY9.rmf) for the pn were used, and ancillary response files were generated using arfgen v1.48.8.
The additional calibration information included in this version of the SAS now allow the use of the pn data (in Fabian et al. (2002b) only the MOS data was analyzed). However, it was found there was a small but significant difference in photon-index () between the MOS and pn spectra even after removing the small amount of pile-up in the MOS data. Since the value of obtained from the pn data was more consistent with that from the MECS and PDS instruments, we ignored the MOS data in this analysis (see Fabian & Vaughan (2003) for further discussion on the EPIC data).
The constant density ionized reflection models of Ross & Fabian (1993) and Ross et al. (1999) were used in the spectral fitting, as these are the most useful in parameterizing the shape of the spectrum. Models where the accretion disc atmosphere is in hydrostatic balance (e.g., Nayakshin et al., 2000; Ballantyne et al., 2001; Różańska et al., 2002) were not used because they are dependent on the unknown accretion disc structure. However, Ballantyne et al. (2001) found that the hydrostatic models could be fit with dilute versions of the constant density ones. Therefore, there is not a significant difference in the shape of the reflection spectrum between the two cases.
xspec v11.2 (Arnaud, 1996) was used for all spectral fitting, and we use the 90 per cent confidence level to compute errorbars for the fit parameters.
3 The Reflection Strength
As a first step toward determining the properties of the reflection spectrum in MCG–6-30-15, the high-energy BeppoSAX PDS data were examined in order to constrain the strength of the Compton reflection “hump.” In this analysis models of the reflected continuum were compared to the PDS data over the 14–200 keV range, which includes the peak of the reflection spectrum. The MECS data were included in the fitting to better constrain the slope of the underlying continuum. Only MECS data in the ranges 2.5–3.5 keV and 7.5–10.0 keV were used as these should be dominated by the primary X-ray continuum; the spectrum is complicated by absorption below 2.5 keV and the strong, broad iron line in the – keV range. The normalization of the PDS data was tied to 0.86 times the MECS value (Fiore, Guainazzi & Grandi, 1999). The EPIC data were not included in these fits as the much higher signal-to-noise ratio of these data would mean the model parameters would be determined almost entirely by the low-energy EPIC data, not the PDS.

A simple power-law model for the broad-band continuum provided a poor fit to the data ( degrees of freedom, d.o.f.), with a photon index of . The residuals from this fit showed the PDS data were systematically in excess of this model in the 14–40 keV range, a strong indication of the presence of an additional Compton reflection continuum, which peaks at keV. Allowing for an exponential cut-off in the power-law continuum did not improve the fit ( d.o.f.) and gave a best-fitting cut-off energy keV, i.e. above the band-pass of the data, implying that the high energy spectral curvature is not the result of a roll-over in the power-law continuum. This fit is illustrated in Fig. 1. The earlier BeppoSAX observation reported by Guainazzi et al. (1999) also clearly detected the reflection continuum of MCG–6-30-15.
The broad-band spectrum was therefore modeled in terms a power-law plus Compton reflection continuum. The pexrav model (Magdziarz & Zdziarski, 1995) was used to compute the spectrum. Specifically, this computes the spectrum resulting from an exponentially cut-off power-law continuum incident on a slab of optically thick, neutral material, accounting for Compton reflection and bound-free absorption. Unlike the Ross & Fabian (1993) ionized disc model, pexrav does not account for discrete emission features (specifically, fluorescence and recombination emission). However, it does account for the angular dependence of the reflected spectrum and the reflection of incident photons with energies keV (which requires relativistic corrections to the scattering cross-section; White, Lightman & Zdziarski 1988). This model should therefore be appropriate for the energy ranges included in the fitting, which extend above keV and ignore regions containing strong atomic emission features.
Including a pexrav reflection component in the model improved the fit substantially ( d.o.f.) and gave the following fit parameters: , keV and a normalization of the reflected spectrum relative to the primary continuum of , where . The inclination angle of the reflector was fixed at (Tanaka et al., 1995; Fabian et al., 2002b) and the abundances were assumed to be solar. This fit suggests rather strong reflection; an isotropic continuum source illuminating a flat accretion disc would be expected to yield a relative reflection strength of (i.e. the reflector subtends a solid angle as seen by the continuum source).
The exact strength and shape of the observed reflection spectrum does however also depend on the abundances of the reflector, its inclination and and its ionization state. The effects of these parameters on the measured value of were investigated as follows. The pexrav model was re-fitted to the data with the Fe abundance fixed at and then solar and also with the Fe abundance as a free parameter. The solar model made the largest improvement to the fit (compared to the solar case) and the best-fitting abundance value was . This gave d.o.f. and the reflection fraction was constrained to be (this fit is shown in the bottom panel of Fig. 1). Allowing the abundances of elements lighter the Fe to vary did not improve the fit further. The Fe abundance was therefore fixed to be solar in the remaining pexrav models. Lee et al. (1999) previously presented evidence for an enhanced iron abundance in MCG–6-30-15.
The apparent strength of the reflected spectrum, for a given value of , is also dependent upon the inclination angle of the reflector with respect to the line-of-sight (e.g., Fig. 5 of Magdziarz & Zdziarski, 1995). Allowing the inclination angle to be a free parameter gave only a small improvement in the quality of the fit ( d.o.f.) with and similar constraints on the reflection strength .
The final possibility explored to explain the high value of was ionization of the reflector. This was performed by using the pexriv model and allowing the ionization parameter to vary (with solar Fe and ). This gave only a slight improvement in the fit ( d.o.f.) with and (this has been corrected for the different energy ranges used in pexriv and the Ross & Fabian (1993) model). The low value of means that the lack of Comptonization of the Fe K edge in this model will not affect the limit on . Thus, even allowing for the possible effects of non-solar abundances, angular-dependence and ionization on the reflection spectrum, the strength of the reflection measured using the high-energy PDS data appeared to be . This constraint on is independent of the possible presence of a roll-over in the power-law continuum, since the cut-off energy of the power-law was a free parameter in the above fits.
4 Ionized Reflection Results
The BeppoSAX constraint on is difficult to explain in terms of the standard disc-corona geometry which predicts . A large reflection strength can be generated if the X-ray emitting plasma is moving toward the accretion disc at mildly relativistic velocities (Reynolds & Fabian, 1997; Beloborodov, 1999; Malzac, Beloborodov & Poutanen, 2001). However, this model would predict an extremely soft spectrum for MCG–6-30-15, which is not observed. Another method of obtaining a large value of was given by Fabian et al. (2002a) who considered the results of reflection from a lumpy or corrugated accretion disc (see also Ross, Fabian & Ballantyne 2002). In this scenario, the optically thick disc may subtend a solid angle larger than 2 as seen from the X-ray source. Again, softer spectra are naturally predicted from such geometry, as the hard X-ray source ‘sees’ more UV photons from the disc.
When fitting the ASCA spectra of MCG–6-30-15, Ballantyne & Fabian (2001) found that it was very difficult for an ionized Fe K line to fully account for both the strength and width of the observed feature. On the other hand, an ionized reflection continuum provided a good fit to the observed one, including the red wing of the Fe K line. Thus, Ballantyne & Fabian (2001) were forced to consider a two component model, where the red wing was fit by the ionized reflector, and the line core by a neutral diskline at 6.4 keV. Misra (2001) has also considered a two component model of the MCG–6-30-15 iron line. A superposition of more than one reflection event may also account for the observed reflection strength. In this section, we investigate the validity of such a model with our high signal-to-noise XMM-Newton data.
4.1 The time-averaged spectrum
MCG–6-30-15 has a strong warm absorber that significantly affects the continuum below 2–3 keV (Nandra & Pounds, 1992; Reynolds et al., 1995; Lee et al., 2001; Sako et al., 2002). Therefore, the use of the full pn spectrum would necessitate a complete model of the warm absorber from analysis of the Reflection Grating Spectrometer (RGS) data. However, the strongest reflection features are not affected by the warm absorber, so, following Ballantyne & Fabian (2001) and Fabian et al. (2002b), we only considered data above 2.5 keV. The MECS and pn data were cut-off at 10 and 12 keV, respectively. The PDS data were cut-off at 80 keV because the Ross & Fabian (1993) models have a high energy limit of 100 keV. All fits included the Galactic absorbing column of cm-2 (Elvis, Wilkes & Lockman, 1989). Data from the three instruments were fit simultaneously with the normalizations free except for the PDS which was fixed to be 0.86 times the MECS value as in Sect. 3.
The model consisted of the sum of two reflection spectra with solar iron abundance. The first of these components was relativistically blurred with a Laor (1991) kernel that had a power-law emissivity () with the index frozen at . The second component was also blurred, but with a flatter index of appropriate for the case when the disc is warped and emission from large radii is non-negligible. Both reflectors were illuminated by the same power-law spectrum, but this primary emission was included only in the first component where it was added in so that was unity. Thus, the second component was reflection dominated. In this way, a total observed can be obtained, as required by the BeppoSAX data (Sect. 3). Following Fabian et al. (2002b) a Gaussian with zero width was included at 6.9 keV to fit an additional spectral feature.

We find a very good fit to the data (d.o.f.=1600/1879) with an ionized reflector located at about 5 and a neutral reflector outside of 70 . The photon index is consistent with the results of Fabian et al. (2002b) (; see their Table 1). The inner radius found here ( ) is farther out than that found by Wilms et al. (2001) or Fabian et al. (2002b) ( ). This is because the ionized reflection model has both a curved spectrum and an intrinsically broadened Fe K line (due to Comptonization). The ionization parameter of the inner reflector () is such that He-like iron is the dominant ion at the surface of the disc. Therefore, the rest energy of the Fe K line is at 6.7 keV, but is gravitationally redshifted down to below 6 keV.
Examining the residuals to this fit in Fig. 2 shows that the reflection hump is not accurately reproduced. This problem is due to the fact that the Ross et al. (1999) reflection models are angle-averaged rather than computed for a specific inclination angle (as is done in pexrav). For angles degrees, angle-averaging results in a weaker reflection hump at 20–30 keV (Magdziarz & Zdziarski, 1995). A possible secondary effect is the hard 100 keV cut-off in the Ross et al. (1999) models causing the spectrum to turn downwards faster than is observed. However, cutting off the PDS data at lower energies (say, 40–50 keV) makes little impact on the model parameters. Despite these issues, Fig. 2 illustrates that more than one reprocessing event can account for the strong reflection hump observed in the BeppoSAX data.
Allowing for the inner reflector to be a free parameter does not improve the fit for any value between 10 and 10 because the inner and outer radii are so close together (see below). Doing the same for the outer component improves the fit only slightly with . This result emphasizes that the model requires a flat emissivity at large radii, consistent with a strongly warped or concave disc. Allowing the reflection fraction to be free does drop the by 8, which is significant at 99.8% according to the F-test. The best fit value of in this case is 1.98. This additional reflection only affected the fit around the Fe K line, and did not alter the residuals at higher energies.
| Inner reflector | Outer reflector | |||||||||
|---|---|---|---|---|---|---|---|---|---|---|
| EW | EW | d.o.f. | ||||||||
| 1.92 | 3.82 | 4.93 | 5.012 | 71 | 1822 | 31.6 | 450 | 29 | 1600/1879 | |
In this model, the large red wing of the Fe line and the 2–10 keV continuum are due to the inner ionized reflector, while the blue core of the line and the reflection hump is dominated by the outer reprocessor. The most striking feature of this fit is that the radii over which the inner component originates is restricted to a narrow annulus only 0.08 wide. In Sect. 5.2 we discuss the implications of this model and attempt to evaluate if it is physically plausible.
4.2 Time resolved spectra
In order to investigate whether the double reflector model can explain the spectral variability properties of MCG–6-30-15, we split the XMM-Newton dataset into 32 10 ks segments (see Figure 3).
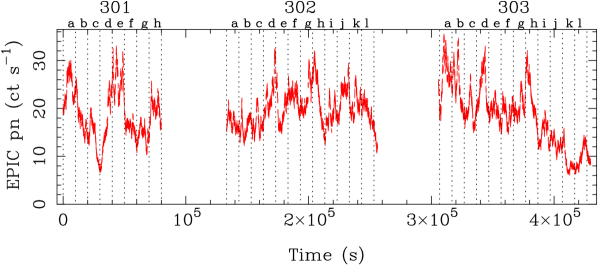
Source and background spectra were extracted from the pn for each interval. Due to the 71% observing efficiency of the pn (Strüder et al., 2001), the exposure time of each spectrum was 7.1 ks.
Each of the 32 spectra were fit with the double reflection model between 2.5 and 12 keV using the time-averaged results (Table 1) as a template. All parameters were allowed to float, except for the inner and outer radii of the distant reflector, the reflection fraction , and the inclination angle which were all fixed at the values listed in Table 1. Keeping fixed allows us to test whether the data are consistent with the innermost reflection component varying (in flux) along with the continuum (allowing for changes in the ionization parameter). The emissivity indices also remained unchanged from the time-averaged fitting. The model provided an acceptable fit (reduced ) to the continuum and Fe K line for each spectrum.


The results from this fitting are shown in Figure 4. The left panel shows the ionization parameter of the two reflectors as a function of the total 2–10 keV flux calculated from the model. This plot clearly shows that the inner reprocessor at 5 becomes more ionized as MCG–6-30-15 becomes brighter. The relationship between and the flux is roughly linear over most of the plot. The red wing of the Fe K line (which is fit by this reflector) will therefore be weak at high flux levels. In contrast, the ionization parameter of the outer reflector is uncorrelated with the 2–10 keV flux and remains small, consistent with predominantly neutral reflection. The right panel in Fig. 4 plots as a function of 2–10 keV flux. Here, we see that we have recovered the well known property that the spectrum of MCG–6-30-15 softens as it becomes brighter (e.g., Vaughan & Edelson, 2001; Shih et al., 2002).
5 Discussion
XMM-Newton has observed MCG–6-30-15 twice. The first observation showed the broad iron line likely extends down below 4 keV, implying emission from within , and also showed a narrower core to the line (Wilms et al., 2001). This apparent two component line may suggest that there is reflection from two distinct sites. The second reprocessing site is unlikely to be very distant (e.g., the molecular torus postulated in Seyfert unification schemes) as the high resolution Chandra HETGS spectrum showed little flux from an intrinsically narrow line component (Lee et al., 2002). The second, longer XMM-Newton observation also appeared to show line emission extending down to low energies. Fabian et al. (2002b) modeled this in terms of neutral reflection from an accretion disc with a broken power-law emissivity profile. In this model the extended red wing of the line is produced by emission within , while the core of the line profile (which was resolved) is produced from reflection beyond and with a relatively flat emissivity profile. These analyses both suggest that the core of the line around 6.4 keV is mostly produced by reflection off material at distances of , while the red wing of the line is produced by emission from within . Such an interpretation is consistent with the ionized reflection results found above. In this section we consider the two component ionized disc model in detail.
5.1 General comments
In Section 4 it was found that ionized reflection models can fit the XMM-Newton data of MCG–6-30-15 but only with some difficulty. As was found previously (Ballantyne & Fabian, 2001), it is difficult for the predicted spectrum to account for the strength and width of the Fe K line, as well as the smooth continuum. The most tenable model required a secondary reflector from farther out on the disc, but, more worrying, the region of primary X-ray generation is confined to a very narrow annulus. Are there limitations in our reflection spectra which is resulting in these extreme models? Although it is difficult to answer this question definitively because the detailed physics of AGN is relatively unknown, the Ross & Fabian (1993) reflection models have been very successful in fitting the X-ray spectra of many different Seyferts (Ballantyne, Iwasawa & Fabian, 2001; Orr et al., 2001; De Rosa et al., 2002; De Rosa, Fabian & Piro, 2002). On the computational side, the code has been compared with similar angle-averaged reflection calculations (Péquignot et al., 2001) and there was good agreement at hard X-rays, particularly around the Fe K line. The models used here assume reflection from a constant density slab, rather than a variable density atmosphere, as was done in Ballantyne & Fabian (2001). In these variable density models weaker Fe K lines are expected due to the smaller density at the surface of the disc; therefore, a constant density slab, although perhaps unrealistic, is the “best case scenario” for producing strong Fe K lines. Thus, it seems unlikely that this extreme fit is a result of limitations in the reflection models.
It is worth pointing out that, consistent with the results of Wilms et al. (2001) and Fabian et al. (2002b), the Fe K line profile in this model suggests a concentration of emission from within 5 . It is unknown whether this is from the plunge region of a Schwarzschild black hole, or from the disc around a spinning Kerr hole. In either case, it seems as though additional physics must be included into our thinking of energy generation in AGN.
5.2 Implications of a double reflection model
5.2.1 Observational testable predictions
In Figure 5 the double reflection model is broken into its components and plotted between 0.3 and 80 keV. Absorption from the Galaxy has been removed so that the soft X-ray spectral features can be seen unhindered.

The total 2–10 keV flux given by the model is erg cm-2 s-1, of which only 6% is contributed by the distant component. When the energy range is extended to 100 keV, the outer reflector provides 21% of the total flux. Thus, if this model is viable we would expect a decrease in rapid continuum variability at higher energies, as the more distant emission would contribute to a larger fraction of the total spectrum. Furthermore, there may be a detectable lag in variations at high energies compared to those occurring between 2 and 10 keV. These predictions could be tested by Integral or ASTRO-E2.
Another observationally testable aspect of this model are the soft X-ray spectral features. The ionization parameter of the outer reflector is constrained to be small enough for iron to be only weakly ionized, but in these cases recombination emission from ions of highly ionized metals such as C, N and O are common at lower energies (Ross & Fabian, 1993). As there is only an upper limit on the of the outer component, we cannot predict the exact lines which may be present in the total spectrum. However, as an example, the EWs of the soft X-ray lines relative to the total predicted continuum are shown in Table 2 for the case when .
| Line | EW (eV) |
|---|---|
| Si K | 6 |
| Mg K | 4 |
| O viii Ly | 9 |
| O vii | 36 |
| N vi | 6 |
| C vi Ly | 9 |
The strongest line is predicted to come from O vii with an EW of 36 eV. Once an accurate model for the warm absorber has been determined it should be possible to search for such a line in the current dataset. The line is not extremely relativistically blurred, so may even stand out in the RGS spectra and would be unrelated to the relativistic soft X-ray line model of Branduardi-Raymont et al. (2001).
In Sect. 4.2 it was found that the ionization parameter of the inner reflector was correlated with the 2–10 keV flux and was always greater than 1000. This implies that the strength of the iron line (which comprises the red wing of the observed Fe K line) is anticorrelated with the flux (Matt et al., 1996; Ballantyne et al., 2002). However, if the flux of MCG–6-30-15 drops to about one-half of the faintest level observed here so that , then the strength of the red wing correlates with . This is another observational testable feature.
5.2.2 Geometry
The geometry implied by the double reflector fit requires two different changes in curvature in the accretion disc. First, the disc must become strongly concave at a radius of 50–70 to provide the surface for the second reflection component. A standard Shakura-Sunyaev gas-pressure dominated accretion disc is already mildly concave with the scale height (Shakura & Sunyaev, 1973), but a warp much larger than this is required to substantially increase the reprocessed flux (see Fig. 2 in Blackman, 1999). A possible mechanism may be warping due to radiation pressure on the disc (Pringle, 1996, 1997), however the typical transition radius for this instability is for an AGN disc (Pringle, 1997). The Bardeen-Petterson effect (Bardeen & Petterson, 1975; Kumar & Pringle, 1985), which aligns the inner part of an accretion disc so that it is perpendicular to the spin axis of the central object, is another possible method to warp a disc if the outer regions are not in the equatorial plane. The transition radius for this mechanism is (Ivanov & Illarionov, 1997; Nelson & Papaloizou, 2000), so the Bardeen-Petterson effect can account for the outer disc geometry implied by the double reflection model. Of course, a spinning black hole would be needed to cause this effect.
Another constraint on the geometry is provided by the inner reflector. Here, the emission is confined to a narrow ring at 5 (see Sect. 5.2.4) and there is no reprocessing between that point and the outer disc, ten times further away. This implies that the inner X-ray source is hidden from most of the inner accretion disc, which requires the scale height to rise quickly at 5 . A schematic diagram illustrating this geometry is shown in Figure 6.

The increase in disc thickness could be due to an increase in the radiation pressure support in the innermost region of the accretion flow.
5.2.3 Fe K variability
The most intriguing aspect of the double reflector model is its potential to possibly explain the puzzling variability of the Fe K line profile (Iwasawa et al., 1996, 1999). Analysis of the long (4.5 day) 1994 ASCA observation of MCG–6-30-15 by Iwasawa et al. (1996) considered the variability of the line core separately from the broad red wing. They found that on timescales greater than a few s, the narrow component seemed to increase with the continuum flux, while the strength of the broad component decreased. On shorter timescales of a few seconds the broad component varied, but the narrow core was consistent with staying constant. Reinforcing these trends was the spectral evidence provided by examining the data during flares or dips in the light curve. Iwasawa et al. (1996) found that during a bright flare, the spectrum (integrated over 36 ks) showed a strong line core, but a very weak red wing. In contrast, a 15 ks deep minimum at the end of the observation showed a strong red wing and a weak blue core. Another interesting line profile was found during a bright, hour long flare in the 1997 long ASCA observation of MCG–6-30-15. Iwasawa et al. (1999) reported that the spectrum extracted from the flare had line emission only from within 5 . There was little evidence for a core at 6.4 keV, with a limit on the EW of 60 eV.
A long 400 ks RXTE observation also illustrated the strange behaviour of the Fe K line in MCG–6-30-15. Although the PCA on RXTE could not resolve the line into a core and wing, these data were used by Lee et al. (2000) and Reynolds (2000) to search for variations in the line flux with the continuum. Both studies found that much of the line flux was constant and unresponsive to large continuum changes down to timescales as low as perhaps 0.5 ks. Vaughan & Edelson (2001) fit these data on the orbital timescale of RXTE and found variations in the line flux, but these were also uncorrelated with the continuum. Fabian et al. (2002b) found a similar result using this XMM-Newton observation. These authors subtracted a 10 ks low flux state spectrum from a 10 ks high flux state one and found that the difference was well fit by a power-law. The constancy of the Fe K line flux, which has been seen in other Seyfert 1s (e.g., NGC 5548; Chiang et al. 2000), is hard to understand if the entire line arises from close to the primary X-ray source.
Analysis of time-resolved XMM-Newton spectra using the double reflection model found that the inner component became more ionized when MCG–6-30-15 was brighter (the left panel of Fig 4). Recall from Fig. 5 that the spectrum between 2.5 and 12 keV is dominated by emission from the inner zone. Also, the shape of an ionized reflection spectrum changes with (Ross et al., 1999). Thus, the change in ionization parameter found in the inner reflector is due to variations in the shape of the spectrum, and not just the Fe K line. This is not necessarily an obvious result. MCG–6-30-15 softens as it becomes brighter (see the right panel of Fig. 4), and a steeper illuminating power-law will decrease the ionization state of the reflector at a constant irradiating flux. Therefore, in order for to increase the incident flux must grow at a rate fast enough to offset the changes in the spectral slope.
As the ionized reflector is nearly coincident with the X-ray source in this model, reverberation would be large on short timescales, adjusting the shape of the line. Therefore, assuming a constant , the changes in the Fe K line profile observed by ASCA can be explained by changes in the ionization state of the inner reflector (see also Reynolds, 2000). When the source is bright, the reprocessing zone becomes highly ionized and the amplitude of the red wing diminishes. On the other hand, when the source is in a low state, the ionization parameter drops and there is more emission from the red wing explaining the results of Iwasawa et al. (1996). However, can the blue core from the distant, neutral reflector respond on the correct timescale to explain its variations? The best fit inner radius for the outer reflector is 71 (Table 1). This corresponds to a light crossing time of 3.5 ks, where M⊙. Iwasawa et al. (1999) saw no blue core in their 1997 ASCA flare spectrum which lasted about an hour – the same timescale estimated above. Therefore, increasing the black hole mass by only a small amount will comfortably explain this observation. Yet Fabian et al. (2002b) found that the difference between a high-state and low-state spectrum of MCG–6-30-15 is consistent with a power-law. The conclusion from that test is that the Fe K line must not have changed strength or shape between the two states.
To investigate the line variability predicted by the ionized disc model more closely, we show in Figure 7 three examples of a difference spectrum obtained by subtracting the best-fitting double reflector model for a low flux state segment from the model of a high-state segment.


Dips in these spectra correspond to regions where the feature was stronger in the low flux state than in the high flux state, and bumps correspond to areas where the high flux model was stronger than the low flux model. The difference spectra obtained from the data were unfolded and plotted in Fig. 7 to illustrate their statistical quality.
The bottom panel shows the difference between the models for Rev. 301:e and 301:f (see Fig. 3). At the end of 301:e there is sudden drop from a 2–10 keV flux of erg cm-2 s-1 to erg cm-2 s-1 in s. The ionization parameter of the inner reflector fell from to over that interval, as did the photon index: to . The overall negative slope of the difference spectrum is due to that change in photon index. At the energy of the red wing of the Fe K line there is a slight deficit with respect to the continuum. This implies that the red wing was stronger in the low flux state spectrum (as a result of the lower ) than in the high flux state spectrum. This feature is weak and very broad and is difficult to detect in the data. The difference spectrum also shows a hump at the position of the line core. This means that the 6.4 keV core was weaker in the low flux state than in the high flux state. If the distant reflector had equilibrated at the high flux state in segment 301:e, it would have not yet responded to the rapid decrease in flux unless the black hole mass was M⊙; alternatively, it may be reacting to changes before the flare in 301:e, as it lasted only 10 ks (see Fig. 3).
The middle panel of Fig. 7 plots the difference between Rev. 302:d and 302:c, which illustrates the case of the source moving from a “steady” low-state (Rev. 302:a,b,c all have roughly the same flux) to a bright flare that occurs at the end of the Rev. 302:d. Fig. 3 shows that the pn count rate increased by nearly a factor of 2 over the 10 ks interval. The difference spectrum of these two segments shows a large (factor of 10) drop at keV implying that the core of the Fe K line was stronger in 302:c than in 302:d, opposite to what is expected if the line core was responding to the continuum on timescales of ks.
The top panel of Fig. 7 shows the difference spectrum between two segments which are separated by 70 ks. The ionization parameter for the data of Rev. 303:b is while it is for segment 303:j. Thus, the red wing of the Fe K line, which originates from the ionized reflector should be stronger in the low flux state spectrum. This does seem to be the case, as the difference spectrum shows the profile of the red wing as a deficit between 3 and 6.4 keV which means that this part of the spectrum is stronger in the low flux state spectrum than in the high flux state. The core of the line is marginally weaker in the low state than in the high flux state, consistent with the lower flux level. Yet, both of these features are 10% from the continuum, and again, as seen from the data points, difficult to detect unambiguously. The 2-sigma upper-limit on the EW of any Gaussian feature at 6.5 keV in the data difference spectrum of 303:b and 303:j is 120 eV (it is 230 eV for 301:e and 301:f).
The conclusion from these tests is that this model does predict changes in the line profile on short timescales, in particular around the red wing. However, these changes will be slight due to the breadth of the feature and that is why they have not been detected before. Unfortunately, higher signal-to-noise data at small timescales will be needed to check these predictions. Finally, the model also finds that small changes in the 6.4 keV line core are consistent with the data, but we are unable to determine a timescale for the changes. Such variations have not been seen before (e.g., Reynolds, 2000), and will need to be found for this multiple reflection model to be viable, although the signature may be complex. For example, a warped accretion disc is subject to Lense-Thirring precession, and this would cause variability in the outer reflector. Although a numerical simulation is needed to fully model the dynamics of such systems (Armitage & Natarajan, 1999), the precession period can be estimated from (Bardeen & Petterson, 1975)
| (1) |
where is the black hole spin parameter. Therefore, precession can only cause long timescale variability in this model.
5.2.4 The inner annulus
Thus far we have ignored the problem that this model predicts that the primary X-ray emission originates from within a tiny annulus at 5 . The fit converged to this value by fitting a notch in the spectrum at 3.6 keV; in order for this to remain unblurred, the outer radius was forced to be close to the inner radius, which is constrained by the width of the red wing. Replacing the pn data with the MOS data does not affect this result. It is possible that this feature is an emission line from hydrogenic Argon from the outer reflector which is not included in the reflection models. Further work needs to be done to eliminate this possibility.
The requirement for the emission to be constrained to an annulus is very extreme as viscous dissipation throughout the accretion disc should go as (Shakura & Sunyaev, 1973). If most of the accretion energy is transported to a magnetic corona above the disc then it could only be efficient in this small annulus which seems highly unlikely given that magnetic fields will be present throughout the flow. In the 1997 flare spectrum reported by Iwasawa et al. (1999), they also found that the line emission seemed to arise from an annulus around 5 . One explanation considered by these authors was that this emission was caused by a flare rotating along the very inner edge of the disc. But, as these authors pointed out, this implied a black hole mass greater than 108 M⊙ as well as theoretical problems about the height of the flare. In the model considered here, emission from an annulus at 5 is required at nearly every point in the observation, and cannot be due to a transient event such as a flare.
One possible explanation for this energy generation is a connection between a spinning black hole and the accretion disc (e.g. Blandford & Znajek, 1977; Li, 2000, 2002a, 2002b). This was considered by Wilms et al. (2001) to explain the steep emissivity profile found in an earlier XMM-Newton observation of MCG–6-30-15. Since emission is required from within 6 it is likely that the black hole is spinning, and is therefore a source of energy that can be transformed into radiation. Returning radiation is another method to increase the emissivity of the inner disc (Martocchia, Matt & Karas, 2002; Fabian & Vaughan, 2003).
6 Conclusions
Making progress in the study of accretion discs and AGN can only be made by comparing models with data. Here, we have used the sophisticated ionized disc models of Ross & Fabian (1993) to fit the latest XMM-Newton and BeppoSAX spectrum of MCG–6-30-15. An ionized disc has often been considered as a possible explanation for the strange variability behavior of the broad Fe K line.
We found that an ionized disc model can fit the data and account for the spectral variability if there are two distinct reflection regions on the disc. This model requires a very specific geometry in order to be viable, but can be tested by searching for soft X-ray emission lines that are broadened to a few 10s of eV, but are not asymmetric, and, in the future, by the continuum variability properties above 30 keV. An apparent problem of this scenario is that it constrains 80% of the total X-ray flux of MCG–6-30-15 to be produced within a very narrow annulus only 5 from the black hole. This is a stringent requirement that is difficult to explain with standard AGN theory. Nevertheless, the advantage of the double reflection model is that it can naturally explain the strange Fe K line variability that has been previously observed. Time-resolved spectral fitting found that the inner reflector becomes more ionized as the source brightens, weakening the red wing of the iron line. Changes in the 6.4 keV line core are also found in the time-resolved fitting, but they do not necessarily correlate with the continuum. The model can also account for the constraint implied by the BeppoSAX data by combining the reflection humps of multiple reprocessors.
One similarity that the model presented here has with previous work (Wilms et al., 2001; Fabian et al., 2002b) is the need for extra production of radiation within 6 . Therefore, irrespective of the number of reflectors or the ionization state of the disk, it seems likely there is some new physical process near the black hole of MCG–6-30-15 that needs to be untangled.
Acknowledgments
Based on observations obtained with XMM-Newton, an ESA science mission with instruments and contributions directly funded by ESA Member States and the USA (NASA). DRB acknowledges financial support from the Commonwealth Scholarship and Fellowship Plan and the Natural Sciences and Engineering Research Council of Canada. ACF thanks the Royal Society for support. We thank the anonymous referee for useful comments.
References
- Armitage & Natarajan (1999) Armitage P.J., Natarajan P., 1999, ApJ, 525, 909
- Arnaud (1996) Arnaud K.A., 1996, in Jacoby G., Barnes J., eds, Astronomical Data Analysis Software and Systems V, ASP Conf. Ser. Vol. 101, 17
- Ballantyne & Fabian (2001) Ballantyne D.R., Fabian A.C., 2001, MNRAS, 328, L11
- Ballantyne & Ross (2002) Ballantyne D.R., Ross R.R., 2002, MNRAS, 332, 777
- Ballantyne et al. (2001) Ballantyne D.R., Iwasawa K., Fabian A.C., 2001, MNRAS, 323, 506
- Ballantyne et al. (2001) Ballantyne D.R., Ross R.R., Fabian A.C., 2001, MNRAS, 327, 10
- Ballantyne et al. (2002) Ballantyne D.R., Fabian A.C., Ross R.R., 2002, MNRAS, 329, L67
- Bardeen & Petterson (1975) Bardeen J.M., Petterson J.A., 1975, ApJ, 195, L65
- Beloborodov (1999) Beloborodov A.M., 1999, ApJ, 510, L123
- Blackman (1999) Blackman E.G., 1999, MNRAS, 306, L25
- Blandford & Znajek (1977) Blandford R.D., Znajek R.L., 1977, MNRAS, 179, 433
- Branduardi-Raymont et al. (2001) Branduardi-Raymont, G., Sako, M., Kahn, S.M., Brinkman, A.C., Kaastra, J.S. & Page, M., 2001, A&A, 365, L140
- Chiang et al. (2000) Chiang J., Reynolds C.S., Blaes O.M., Nowak M.A., Murray N., Madajski G., Marshall H.L., Magdziarz P., 2000, ApJ, 528, 292
- De Rosa, Fabian & Piro (2002) De Rosa A., Fabian A.C., Piro L., 2002, MNRAS, 334, L21
- De Rosa et al. (2002) De Rosa A., Piro L., Fiore F., Grandi P., Maraschi L., Matt G., Nicastro F., Petrucci P.O., 2002, A&A, 387, 838
- Dumont et al. (2002) Dumont A.-M., Czerny B., Collin S., Życki P.T., 2002, A&A, 387, 63
- Elvis, Wilkes & Lockman (1989) Elvis M., Wilkes B.J., Lockman F.J., 1989, AJ, 97, 777
- Fabian & Vaughan (2003) Fabian A.C., Vaughan S., 2003, MNRAS Lett., in press (astro-ph/0301588)
- Fabian et al. (1989) Fabian A.C., Rees M.J., Stella L., White N.E., 1989, MNRAS, 238, 729
- Fabian et al. (2002a) Fabian A.C., Ballantyne D.R., Merloni A., Vaughan S., Iwasawa K., Boller Th., 2002a, MNRAS, 331, L35
- Fabian et al. (2002b) Fabian A.C., et al., 2002b, MNRAS, 335, L1
- Fiore et al. (1999) Fiore F., Guainazzi M., Grandi P., 1999, Cookbook for BeppoSAX NFI Spectral Analysis. Available from http://www.asdc.asi.it/bepposax/software/index.html
- Galeev et al. (1979) Galeev A.A., Rosner R., Vaiana G.S., 1979, ApJ, 229, 318
- George & Fabian (1991) George I.M., Fabian A.C., 1991, MNRAS, 249, 352
- Guainazzi et al. (1999) Guainazzi M., et al., 1999, A&A, 341, L27
- Haardt & Maraschi (1991) Haardt F., Maraschi L., 1991, ApJ, 380, L51
- Haardt & Maraschi (1993) Haardt F., Maraschi L., 1993, ApJ, 413, 507
- Ivanov & Illarionov (1997) Ivanov P.B., Illarionov A.F., 1997, MNRAS, 285, 394
- Iwasawa et al. (1996) Iwasawa K., et al., 1996, MNRAS, 282, 1038
- Iwasawa et al. (1999) Iwasawa K., Fabian A.C., Young A.J., Inoue H., Matsumoto C., 1999, MNRAS, 306, L19
- Kumar & Pringle (1985) Kumar S., Pringle J.E., 1985, MNRAS, 213, 435
- Laor (1991) Laor A., 1991, ApJ, 376, 90
- Lee et al. (1999) Lee J.C., Fabian A.C., Brandt W.N., Reynolds C.S., Iwasawa K., 1999, MNRAS, 310, 973
- Lee et al. (2000) Lee J.C., Fabian A.C., Reynolds C.S., Brandt W.N., Iwasawa K., 2000, MNRAS, 318, 857
- Lee et al. (2001) Lee J.C., Ogle P.M., Canizares C.R., Marshall H.L., Schulz N.S., Morales R., Fabian A.C., Iwasawa K., 2001, ApJ, 554, L13
- Lee et al. (2002) Lee J.C., Iwasawa K., Houck J.C., Fabian A.C., Marshall H.L., Canizares C.R., 2002, ApJ, 570, L47
- Li (2000) Li L.-X., 2000, ApJ, 533, L115
- Li (2002a) Li L.-X., 2002a, ApJ, 567, 463
- Li (2002b) Li L.-X., 2002b, A&A, 392, 469
- Magdziarz & Zdziarski (1995) Magdziarz P., Zdziarski A.A., 1995, MNRAS, 273, 837
- Malzac, Beloborodov & Poutanen (2001) Malzac J., Beloborodov A.M., Poutanen J., 2001, MNRAS, 326, 417
- Martocchia, Matt & Karas (2002) Martocchia A., Matt G., Karas V., 2002, A&A, 383, L23
- Matt & Perola (1992) Matt G., & Perola G.C., 1992, MNRAS, 259, 433
- Matt, Perola & Piro (1991) Matt G., Perola G.C., Piro L., 1991, A&A, 247, 25
- Matt et al. (1993) Matt G., Fabian A.C., Ross R.R., 1993, MNRAS, 262, 179
- Matt et al. (1996) Matt G., Fabian A.C., Ross R.R., 1996, MNRAS, 278, 1111
- Misra (2001) Misra R., 2001, MNRAS, 320, 445
- Nandra & Pounds (1992) Nandra K., Pounds K.A., 1992, Nature, 359, 215
- Nandra & Pounds (1994) Nandra K., Pounds K.A., 1994, MNRAS, 268, 405
- Nayakshin et al. (2000) Nayakshin S., Kazanas D., Kallman T., 2000, ApJ, 537, 833
- Nelson & Papaloizou (2000) Nelson R.P., Papaloizou J.C.B., 2000, MNRAS, 315, 570
- Orr et al. (2001) Orr A., Barr P., Guainazzi M., Parmar A.N., Young A.J., 2001, A&A, 376, 413
- Péquignot et al. (2001) Péquignot D. et al., 2001, in Ferland G.J., Savin D.W., eds., Spectroscopic Challenges of Photoionized Plasmas, ASP Conf. Ser. Vol. 247, 533
- Pounds et al. (1990) Pounds K.A., Nandra K., Stewart G.C., George I.M., Fabian A.C., 1990, Nature, 344, 132
- Pringle (1996) Pringle J.E., 1996, MNRAS, 281, 357
- Pringle (1997) Pringle J.E., 1997, MNRAS, 292, 136
- Reynolds (2000) Reynolds C.S., 2000, ApJ, 533, 811
- Reynolds & Fabian (1997) Reynolds C.S., Fabian A.C., 1997, MNRAS, 290, L1
- Reynolds & Nowak (2003) Reynolds C.S., Nowak M.A., 2003, Phys. Reports, in press (astro-ph/0212065)
- Reynolds et al. (1995) Reynolds C.S., Fabian A.C., Nandra K., Inoue H., Kunieda H., Iwasawa K., 1995, MNRAS, 277, 901
- Ross & Fabian (1993) Ross R.R., Fabian A.C., 1993, MNRAS, 261, 74
- Ross et al. (1999) Ross R.R., Fabian A.C., Young A.J., 1999, MNRAS, 306, 461
- Ross, Fabian & Ballantyne (2002) Ross R.R., Fabian A.C., Ballantyne D.R., 2002, MNRAS, 336, 315
- Różańska et al. (2002) Różańska A., Dumont A.-M., Czerny B., Collin S., 2002, MNRAS, 332, 799
- Sako et al. (2002) Sako M., et al., 2002, ApJ, submitted (astro-ph/0112436)
- Shakura & Sunyaev (1973) Shakura N.L., Sunyaev R.A., 1973, A&A, 24, 337
- Shih et al. (2002) Shih D.C., Iwasawa K., Fabian A.C., 2002, MNRAS, 333, 687
- Stella (1990) Stella L., 1990, Nature, 344, 747
- Strüder et al. (2001) Strüder L., et al., 2002, A&A, 365, L27
- Tanaka et al. (1995) Tanaka Y., et al., 1995, Nature, 375, 659
- Vaughan & Edelson (2001) Vaughan S., Edelson R., 2001, ApJ, 548, 694
- White, Lightman & Zdziarski (1988) White T.R., Lightman A.P. & Zdziarski A.A., 1988, ApJ, 331, 939
- Wilms et al. (2001) Wilms J., Reynolds C.S., Begelman M.C., Reeves J., Molendi S., Staubert R., Kendziorra E., 2001, MNRAS, 328, L27