Transition from L to T Dwarfs on the Color-Magnitude Diagram
Abstract
The color-magnitude (CM) diagram of cool dwarfs and brown dwarfs based on the recent astrometry data is compared with the CM diagram transformed from the theoretical evolutionary tracks via the unified cloudy models (UCMs) of L and T dwarfs. A reasonable agreement between the models and observations is shown for the whole regime of ultracool dwarfs covering L and T dwarfs, and this is achieved, for the first time, with the use of a single grid of self-consistent nongray model photospheres accommodating dust cloud (UCMs; K). A distinct brightening at the band in the early T dwarfs revealed by the recent parallax measurements is explained as a natural consequence of the migration of the thin dust cloud to the inner region of the photosphere and should not necessarily be evidence for Burgasser et al.’s proposition that the dust cloud breaks up in the L/T dwarf transition. Also, the rapid bluing from the late L to the early T dwarfs is a direct result of the transition of the thin dust cloud from the optically thin () to thick () regimes while and lower only slightly. Thus, the theoretical evolutionary models, the cloudy models of the photospheres (UCMs), and the observed fundamental stellar parameters are brought into a consistent picture of the newly defined L and T dwarfs.
1 INTRODUCTION
Since the discovery of the genuine brown dwarf Gl 229B (Nakajima et al., 1995), a large number of ultracool dwarfs have been discovered (e.g. Strauss et al., 1999; Kirkpatrick et al., 2000; Burgasser et al., 2002a). The newly discovered ultracool dwarfs are now classified into the new spectral classes L and T (Geballe et al., 2002), which are characterized by the very red colors due to dust extinction and by the strong bands of methane and water, respectively. Extensive efforts have been made to interpret these new objects in terms of atmospheric chemistry including formation of dust clouds, as reviewed recently by Burrows et al. (2001). Although L and T dwarfs appear to be quite different, we proposed that they can be understood consistently with the unified cloudy models (UCMs) in which a thin dust cloud is formed always near the dust condensation temperature and hence will be located relatively deep in the photosphere for the cooler T dwarfs while will appear in the optically thin regime in the warmer L dwarfs (Tsuji, 2002). The presence of the dust cloud deep in the photospheres was also shown by an application of the planetary theory (Marley et al., 2002). It is interesting that the presence of the thin dust cloud deep in the photospheres of ultracool dwarfs has been concluded from the quite different approaches.
The nature of the cloud, however, is by no means clear yet. One major interest is if the cloud is subject to the meteorological activities familiar with the planets in the solar system. Such a possibility has so far been suggested by observing photometric variabilities which may be due to the inhomogeneity of the dust clouds (e.g. Bailer-Jones & Mundt, 2001; Martín, Zapatero Osorio, & Lehto, 2001). Also, an interesting finding of the recent parallax measurements is that the magnitude shows a large brightening in the early T dwarfs (Dahn et al., 2002). This result was interpreted as evidence for the disruption of the dust cloud in the L/T dwarf transition (Burgasser et al., 2002b).
Before such a possibility is explored, however, it is important to remember a more classical application of the CM diagram; namely as a touchstone of stellar models. For this purpose, the observed CM diagram of ultracool dwarfs including brown dwarfs is now accurate enough to be confronted with the theoretical evolutionary models (e.g. Dahn et al., 2002). On the other hand, theoretical evolutionary tracks of the substellar mass objects have been discussed by Hayashi & Nakano (1963) already in the 1960’s, and recent developments with improved input physics have been discussed by Burrows et al. (1997) and by Chabrier et al. (2000). Given that the observed CM diagram and theoretical evolutionary models are both reasonably well established, a missing link between them is a realistic model photosphere to be used for the conversion of the fundamental stellar parameters to the observables. We show in this letter that the missing link might be found in the UCMs (Tsuji 2002).
2 COLOR-MAGNITUDE DIAGRAM
We applied the UCMs to convert the and of the evolutionary models to more easily observable monochromatic absolute magnitudes and color indices; we discuss and as an example. In the UCMs, we assume that the dust grains formed at the condensation temperature () are in detailed balance with the ambient gaseous mixture so long as the grain sizes are smaller than the critical radius () and hence can be sustained in the photosphere. Dust grains soon grow to be larger than at a slightly lower temperature which we refer to as the critical temperature () and the dust grains are stabilized. Such stable grains may segregate from the gaseous mixture and can no longer be sustained in the photosphere. The exact value of is difficult to know but we assume it to be quite small in the sub-micron regime (e.g. m), since astronomical grains prevailing in the universe (and hence these grains are already larger than ) are well above this size as can be inferred from the reddening law. For this reason, only dust grains smaller than survive in the temperature range of . This means a formation of a dust cloud with a rather high temperature (note that K) independently of . Since at , the dust cloud appears in the optically thin region () in L dwarfs whose ’s are relatively high and in the optically thick region () in T dwarfs whose ’s are lower. As a result, the thin dust cloud formed in the photosphere of ultracool dwarfs moves from the optically thin region in L dwarfs to the deeper optically thick region in T dwarfs. This migration of the dust cloud in the photospheres of ultracool dwarfs has observable effects to be reflected on the observed CM diagram, as we will show below.
In discussing model photosphere, one important input parameter is the chemical composition. After the first version of the UCMs (Tsuji, 2002), an important revision of the solar carbon and oxygen abundances was proposed by Allende Prieto, Lambert, & Asplund (2001, 2002), who showed that the C and O abundances are about 50% lower than those by Anders & Grevesse (1989). In view of the decisive role of C and O in the chemical equilibrium in cool dwarfs (Lodders & Fegley, 2002), we have computed a new grid of the UCMs with the new C and O abundances. The other abundances are by Anders & Grevesse (1989) and we assumed that the abundant refractory elements Fe, Si, Mg, and Al are condensed into iron, enstatite (MgSiO3), and corundum (Al2O3). The extinction coefficients of these dust species are evaluated with the use of the measured optical constants and they do not depend on the grain size so far as the grains are as small as we have assumed (Tsuji 2002).
To convert predicted from the evolutionary models to , we apply the bolometric correction for the magnitude defined by
with
and
where is the emergent flux calculated from our UCM with the use of the molecular linelist, and are constants which depend on the zero-points of the magnitude systems, is the stellar radius, and is the distance to the object corresponding to 10 pc. We used the filter response function given by Persson et al. (1998), which is normalized as
Then
where . We first apply eqn.(5) to determine by the use of the model flux of Vega with K, log , and km s-1 (Kurucz, 1993). The value of for Vega is from (Code et al., 1976) and . We found , with which eqn.(5) is applied to the model fluxes of L and T dwarfs.
The resulting values of against are shown in Fig. 1a for the four values of , the fully dusty models (case B; ), dust segregated models (case C; and hence effectively dust-free), and the blackbody (BB) radiation. We assumed log which is the median value of log extending from 4.5 to 5.5 in brown dwarfs (Fig. 9 of Burrows et al. 1997). The changes of log by at K ( K), for example, result in the changes of by about (Fig. 1a). The can be regarded as a generalized color index and the larger of the case C compared with the case of BB for the lower is due to the large nongray opacity which is relatively transparent in the band region compared to the longer wavelength region dominated by the increasingly larger absorption due to H2 CIA (collision-induced absorption) as well as CH4 and H2O ro-vibration bands. If the thin cloud is introduced, the dust extinction at the band region first increases from the early L to late L dwarfs and decreases. The dust column density in the observable photosphere attains the maximum value of gram cm-2 at K which corresponds to the late L dwarfs. In T dwarfs, however, the cloud moves into the optically thick region of the photosphere, and the observable effect of the dust extinction decreases in the L/T transition objects and further in T dwarfs, resulting in the re-increase of . The values of depend on , which is essentially a measure of the thickness of the dust cloud in the observable photosphere ; the lower value of implies the thicker cloud and hence a larger dust extinction, resulting in the smaller values of . For the case B, the dust extinction is so large that the flux is suppressed below the case of BB and hence the values of tend to be smaller than those for the case of BB at K.
Next, we evaluate based on the predicted fluxes of the UCMs, and the resulting is reduced to the empirical system so that for A0V star, again by the use of the model flux of Vega by Kurucz (1993). We used the filter response function of Persson et al. (1998) and their transform equation to the CIT system. The resulting calibrations are shown in Fig. 1b for the four values of , the cases B and C, and the case of BB. The red limit of depends on and is larger (redder) for the lower value of , which implies the larger dust column density of the cloud in the photosphere; & 1.4 for & 1900 K, respectively (Fig. 1b). On the other hand, the observed red limit of is about 1.9 from Fig. 4 of Dahn et al. (2002). Thus we suggest that K in agreement with the previous analyses based on the different color systems (Tsuji 2001, 2002). This result is based on the grid of UCMs with log , the changes of which by result in (Fig. 1b), and this may partly explain the scatter in the observed colors (Fig. 4 of Dahn et al. 2002).
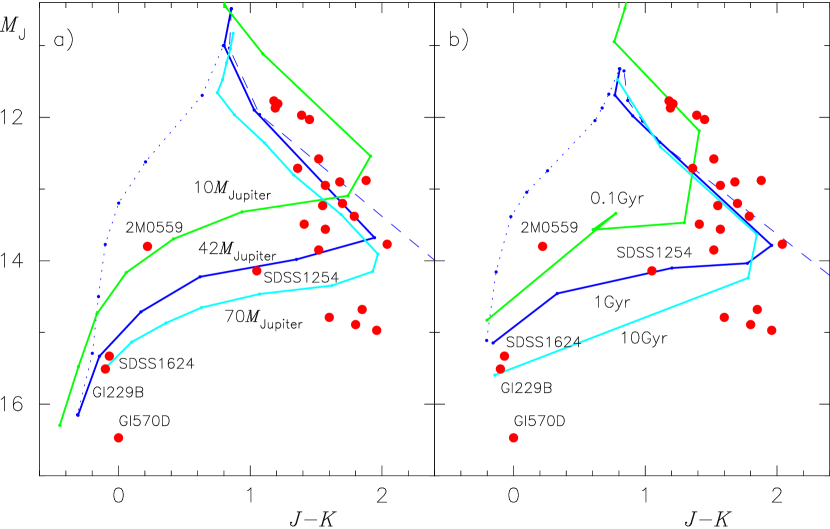
We now transform and of the evolutionary models to and via Figs. 1a and 1b with K throughout. We first apply this procedure to the cooling tracks of the brown dwarfs with 10, 42, and 70 by Burrows et al. (1997), and the results are shown in Fig. 2a with the observed and values (Dahn et al., 2002). It is to be noted that the red limit of L dwarfs as well as the rapid bluing of T dwarfs is well reproduced by the cooling tracks of the substellar mass objects. The position of the T2 dwarf SDSS J1254-0122 is well accounted for by the cooling track of the moderate mass brown dwarf and this fact confirms that this object is in fact a transition object from L to T dwarf (Leggett et al., 2000). The high luminosity of the T5 dwarf 2MASS J0559-1404 at the band is also accounted for by the cooling track of the low mass brown dwarfs. A few objects near may be accounted for by the models of higher masses while the observed photometric data of the very faint Gl 570D may not be well fixed yet.
Next, we repeat the same analysis on the theoretical isochrones for 0.1, 1 and 10 Gyr by Chabrier et al. (2000) and the results are shown in Fig. 2b with the observed data. The observed position of 2M 0559 is still higher than the isochrone of 0.1 Gyr, but a possibility of a binary was suggested (Burgasser, 2002) and then the observed position may be shifted downward by 0.75 mag. The results shown in Figs. 2a and 2b are not fully self-consistent in that the model photospheres used in computing the evolutionary models are not the same as those used in converting the resulting diagrams to the CM diagrams. According to Burrows et al. (1997), however, by replacing gray models with nongray models, the evolutionary tracks have changed, but generally by no more than 10% in luminosity at any time, for any given mass. Also, the effect of the photospheric models on was shown to be no larger than about 100 K (Fig. 2 of Chabrier et al. 2000). With these reservations in mind, we conclude that the general trend of the observed CM diagram can be reasonably well fitted with the predicted ones based on the evolutionary models and the photospheric models (and Figs. 1a & 1b can also be applied to any other evolutionary track).
It is to be noted that the “brightening” of the flux in the early T dwarfs is an artifact of observing objects with different masses and/or ages, and it should not imply that a single cooling track of a given mass shows the “brightening”. Nevertheless the rather high luminosity at the band reflects the re-increase of at the L/T transition noted before and this is a natural consequence of the migration of the dust cloud from the optically thin region in L dwarfs to the optically thick region in T dwarfs. This migration of the dust cloud recovers the gaseous opacities including H2 CIA at the band region and makes the flux large enough to compensate for the decreasing bolometric flux in the early T dwarfs. Also, the rapid transition from L to T dwarfs on the CM diagram is simply because the cloud moves from the optically thin to thick regions for only a small change of during the L/T transition. It is to be emphasized here that the migration of the dust cloud to the deeper photosphere in the cooler brown dwarfs is simply a consequence of the dust formation at the condensation temperature ( K) irrespective of , and no other mechanism is needed at all to explain the migration of the dust cloud.
3 DISCUSSION AND CONCLUDING REMARKS
We have shown that the observed CM diagram extending from L to T dwarfs can be well fitted with the theoretical diagram converted to ( diagram via UCMs. This is the first successful application of the model photospheres to the CM diagram of the ultracool dwarfs which show rapid bluing and unexpected “brightening” at the magnitude in T dwarfs after passing the red limit in L dwarfs. So far, other model photospheres including the cloudy models by Marley et al. (2002) as well as the dusty and clear models by Chabrier et al. (2000) could not be fitted to the observed CM diagram (Fig. 1 of Burgasser et al. 2002b). Although the cloudy models of Marley et al. (2002) have essentially the same feature as our UCMs in that the thin dust cloud is formed deep in the photosphere, yet their models failed to account for the observed diagram, even if their free parameter referred to as the sedimentation efficiency, , was changed.
The difficulty of the Marley et al’s cloudy models led Burgasser et al. (2002b) to suggest that the dust cloud should subject to disruption. Then the breaks between the clouds could explain the brightening of as well as the bluing of of the T5 dwarf 2M 0559, but only by introducing an additional free parameter, the cloud coverage fraction, besides the sedimentation efficiency, . Also, the position of the L/T transition object SDSS 1254 on the CM diagram could be explained only if the cloud coverage of 40% was assumed. However, the argument based on the failure of the Marley et al’s cloudy models to explain the observed CM diagram cannot be the evidence for the dust cloud disruption, since our simpler cloudy models, the UCMs, easily explain the observed diagram including the key objects SDSS 1254 and 2M 0599 without any additional ad-hoc assumption, as shown in Sect.2. As to an additional argument for the cloud disruption, namely the non-monotonic behavior of the FeH (0 - 0) band at 0.9896 m (Burgasser et al., 2002b), further observational confirmation will be needed since no FeH (1 - 0) band at 0.8692 m can be seen in the spectrum of the T5 dwarf 2M 0559 (Fig. 6.4 of Burgasser 2002).
In conclusion, the observed CM diagram based on the recent parallax measurements can be fitted with the predicted CM diagrams based on the evolutionary models and UCMs of the photospheres. Since the theoretical evolutionary models and observed CM diagram can now be deemed as reasonably well established, this success in fitting the theoretical and observed CM diagrams can be regarded as an observational confirmation of the model photospheres we have applied, namely the UCMs. This success of the UCMs may be significant especially because the UCMs are based on the very simple thermodynamical argument that the dust formed at can survive only to where , resulting in the formation of a thin dust cloud between and . Then, possibly complicated processes including condensation, growth, segregation, and precipitation of dust grains in the cloud are all absorbed in the , which is determined empirically. Such a semi-empirical approach plays an important role in stellar modeling, and a well known example of a useful empirical parameter is the so-called mixing length in the theory of stellar convection. Now our simplified treatment of the dust cloud has been shown to be successful for the interpretation of the CM diagram and will hopefully be useful for the interpretation and analysis of other observed data as well.
References
- Allende Prieto et al. (2001) Allende Prieto, C., Lambert, D. L. & Asplund, M. 2001, ApJ, 556, L63
- Allende Prieto et al. (2002) Allende Prieto, C., Lambert, D. L. & Asplund, M. 2002, ApJ, 573, L137
- Anders & Grevesse (1989) Anders, E., & Grevesse, N. 1989, Geochim. Cosmochim. Acta, 53, 197
- Bailer-Jones & Mundt (2001) Bailer-Jones, C. A. L., & Mundt, R. 2001, A&A, 367, 218
- Burgasser (2002) Burgasser, A. J. 2002, Ph. D. thesis, California Institute of Technology
- Burgasser et al. (2002a) Burgasser, A. J., et al. 2002a, ApJ, 564, 421
- Burgasser et al. (2002b) Burgasser, A. J., et al. 2002b, ApJ, 571, L151
- Burrows et al. (2001) Burrows, A., Hubbard, W. B., Lunine, J. I., & Liebert, J. 2001, Rev. Mod. Phys., 73, 719
- Burrows et al. (1997) Burrows, A., et al. 1997, ApJ, 491, 856
- Chabrier et al. (2000) Chabrier, G., Baraffe, I., Allard, F., & Hauschildt, P. 2000, ApJ, 542, 464
- Code et al. (1976) Code, A. D., Davis, J., Bless, R. C., & Hanbury Brown, R. 1976, ApJ, 203, 417
- Dahn et al. (2002) Dahn, C. C., et al. 2002, AJ, 124, 1170
- Geballe et al. (2002) Geballe, T. R., et al. 2002, ApJ, 564, 466
- Hayashi & Nakano (1963) Hayashi, C., & Nakano, T. 1963, Prog. Theor. Phys., 30, 460
- Kirkpatrick et al. (2000) Kirkpatrick, J. D., et. al. 2000, AJ, 120, 447
- Kurucz (1993) Kurucz, R. L. 1993, Kurucz CD-ROM 13, ATLAS9 Stellar Atmosphere Programs and 2 km/s Grid (Cambridge: SAO)
- Leggett et al. (2000) Leggett, S. K., et al. 2000 ApJ, 536, L35
- Lodders & Fegley (2002) Lodders, K., & Fegley, B., Jr. 2002, Icarus, 155, 393
- Marley et al. (2002) Marley, M. S., Seager, S., Saumon, D., Lodders, K., Ackerman, A. S., Freedman, R., & Fan, X. 2002, ApJ, 568, 335
- Martín, Zapatero Osorio, & Lehto (2001) Martín, E, L., Zapatero Osorio, M. R., & Lehto, H. J. 2001, ApJ, 557, 822
- Nakajima et al. (1995) Nakajima, T., Oppenheimer, B. R., Kulkarni, S. R., Golimowski, D. A., Matthews, K., & Durrance, S. T. 1995, Nature, 378, 463
- Persson et al. (1998) Persson, S. E., Murphy, D. C., Krzeminski, W., Roth, M., & Rieke, M. J. 1998, AJ, 116, 2475
- Strauss et al. (1999) Strauss, M. A., et al. 1999, ApJ, 522, L61
- Tsuji (2001) Tsuji, T. 2001, in Ultracool Dwarfs: New Spectral Types L and T, ed. H. R. A. Jones & I. A. Steele (Berlin: Springer-Verlag), 9
- Tsuji (2002) Tsuji, T. 2002, ApJ, 575, 264