The mineralogy, geometry and mass-loss history of
IRAS 16342-3814
††thanks: Based on observations with ISO, an ESA project with instruments
funded by ESA Member States (especially the PI countries: France,
Germany, the Netherlands and the United Kingdom) with the
participation of ISAS and NASA. The SWS is a joint project of
SRON and MPE. Also based on observations obtained at the
European Southern Observatory (ESO).
We present the m Infrared Space Observatory (ISO) spectrum and m ISAAC and TIMMI2 images of the extreme OH/IR star IRAS 16342-3814. Amorphous silicate absorption features are seen at and m, together with crystalline silicate absorption features up to almost m. No other OH/IR star is known to have crystalline silicate features in absorption up to these wavelengths. This suggests that IRAS 16342-3814 must have, or recently had, an extremely high mass-loss rate. Indeed, preliminary radiative transfer calculations suggest that the mass-loss rate may be as large as . The m ISAAC image shows a bipolar reflection nebula with a dark equatorial waist or torus, similar to that seen in optical images taken with the Hubble Space Telescope (HST). The position angle of the nebula decreases significantly with increasing wavelength, suggesting that the dominant source of emission changes from scattering to thermal emission. Still, even up to m the nebula is oriented approximately along the major axis of the nebula seen in the HST and ISAAC images, suggesting that the torus must be very cold, in agreement with the very red ISO spectrum. The m image shows a roughly spherically symmetric extended halo, approximately in diameter, which is probably due to a previous phase of mass-loss on the AGB, suggesting a transition from a (more) spherically symmetric to a (more) axial symmetric form of mass-loss at the end of the AGB. Using a simple model, we estimate the maximum dust particle sizes in the torus and in the reflection nebula to be and m respectively. The size of the particles in the torus is large compared to typical ISM values, but in agreement with high mass-loss rate objects like AFGL 4106 and HD161796. We discuss the possible reason for the difference in particle size between the torus and the reflection nebula.
Key Words.:
circumstellar matter – infrared: stars – stars: AGB and post-AGB – stars: imaging – stars: mass-loss1 Introduction
As a Main Sequence star with an initial mass between and about ages, it eventually evolves into an Asymptotic Giant Branch (AGB) star. An AGB star is a luminous cool giant star in which a dust driven wind expels matter from its envelope at a high rate ( to ). Mass-loss increases over time as the AGB star evolves. This eventually ends in an episode of extremely high mass-loss, the so-called superwind (SW) phase, in which the mass-loss rate, , exceeds . The SW rapidly strips the star of virtually its entire envelope. The high mass-loss during the AGB phase (the total AGB phase lasts some ) creates a circumstellar envelope which may completely obscure the star. When the SW phase stops, the central star starts to shrink in radius at constant luminosity, getting hotter over time. The star is now said to be in the post-AGB phase. The old circumstellar envelope, which initially obscures the central star, becomes optically thin at optical wavelengths after because it is still expanding. Depending on the rate at which the central star evolves, the star may start to photoionize the material that was ejected during the AGB phase, creating a planetary nebula (PN). In this case the phase between the end of the AGB and the birth of the PN is called the proto-planetary nebula (proto-PN) phase.
In this paper we study the proto-PN IRAS 16342-3814 (hereafter: IRAS 16342; also OH 344.1+5.8 or ”the water-fountain nebula”). The evolutionary status of IRAS 16342 as a proto-PN is examined in detail by Sahai et al. (1999, hereafter: SAH99). They report the presence of an asymmetrical bipolar reflection nebula in Hubble Space Telescope (HST) images at and m. The two lobes of the nebula, where the eastern lobe is significantly redder than the western lobe, are separated by a dark equatorial waist. The nebula is illuminated by starlight escaping through the polar holes in this ‘optically thick, dense, flattened cocoon of dust’. The central star is completely obscured by the dust cocoon (hereafter called ‘the torus’). The individual symmetry axes of the lobes do not coincide, although their orientation and location with respect to the dark waist are centrally point symmetric. OH maser line data at 1612, 1665 and 1667 MHz overlaid on the m image suggest that the nebular axis is tilted such that the western lobe is nearest to us. Faint halos are seen around the lobes. The halo regions are illuminated by scattered light from the lobes, and possibly by heavily reddened, direct starlight (SAH99).
IRAS 16342 has been observed as part of a mid-infrared (Meixner et al. 1999) and optical imaging survey (Ueta et al. 2000). In the mid-infrared survey IRAS 16342 was observed at , , and m. At these wavelengths the star was classified as a core/elliptical source, i.e. a source with an unresolved, very bright core that is surrounded by a lower surface brightness elliptical nebula. At all mid-infrared wavelengths the source was found to extend northeast-southeast with the same position angle for all wavelengths.
Early studies on IRAS 16342 revealed the presence of extremely high velocity outflows in both () and OH () maser line emission (Zuckerman & Lo 1987; Likkel & Morris 1988). Likkel & Morris interpreted the masers as streams or clumps of molecular gas forced out at the polar axes, and believed the OH masers to originate from lower velocity material at intermediate latitudes. Likkel et al. (1992) suggested a binary star model for IRAS 16342, as this could account for both the bipolarity and the high outflow velocities of the masers.
Radiative transfer calculations on IRAS 16342 have been performed by Guertler et al. (1996) and Zijlstra et al. (2001). The latter authors found an inner radius of and an outer radius of for the torus, in agreement with the HST observations. The mass of the torus was found to be . The radiative transfer calculations by both groups suggest the presence of a (very cool) outer shell.
In this paper we present the m Infrared Space Observatory (ISO) spectrum and infrared ISAAC and TIMMI2 images ( to m) of IRAS 16342. The aim of this paper is to study the mineralogy, morphology and mass-loss history of IRAS 16342. The paper should also add to our understanding of proto-PNe in general and to the injection of matter into the ISM by AGB stars. The latter is important since AGB stars are among the main ‘factories’ of interstellar dust in galaxies. In Sect. 2 the data and data reduction procedures are described. In Sect. 3 we present and discuss the ISO spectrum. Based on the spectrum, we study the mineralogy and mass-loss history of IRAS 16342. The ISAAC and TIMMI2 images of IRAS16342 are presented in Sect. 4 and will be used to study the morphology of IRAS 16342 and set limits on the grain sizes in the torus and the lobes. The conclusions are listed in Sect. 5.
2 Data and data reduction
2.1 ISO data
The m spectrum was obtained with ISO (Kessler et al. 1996), using the Short Wavelength Spectrometer (SWS; de Graauw et al. 1996) for the m region and the Long Wavelength Spectrometer (LWS; Clegg et al. 1996) for the m region. The two spectra were reduced independently. For both the SWS and LWS reduction, we used pipeline version OLP 10 as the starting point. In both cases, individual subbands were cleaned from glitches, flatfielded (to the mean of all detectors), sigmaclipped (using the default values for SWS and for LWS) and rebinned ( for SWS and m for LWS). The subbands were scaled (to band 1 and/or 2 for SWS and detector 5 for LWS) to obtain a continuous spectrum. Finally, the LWS spectrum was scaled to the SWS spectrum to get one continuous spectrum. Without scaling, the flux levels of the two spectrographs matched at m to within . For LWS there was an off source spectrum available to correct for interstellar flux contributions. The flux levels in this spectrum were low (), showing that the on-source spectrum has no significant background contribution. We have compared our reduction with the available IRAS data. Between and m, the ISO spectrum overlaps the IRAS Low Resolution Spectrum (LRS) to within , while between and m the IRAS LRS flux is about higher than the ISO flux. The IRAS Point Source Catalog (PSC) fluxes match those derived from the ISO data to within (see Table 1).
2.2 ISAAC data
The IRAS 16342 m (L-band) image was obtained with the Infrared Spectrometer And Array Camera (ISAAC) 111http://www.eso.org/instruments/isaac/index.html at the Very Large Telescope (VLT) at Paranal, Chile, on August 6, 2000, using the Santa Barbara Research Center Aladdin 10241024 pixel InSb array. The pixel scale of this detector is 0.071 ′′ per pixel. The total field of view is 72′′ 72′′. The L-band filter has a central wavelength of 3.78 m and a width of 0.58 m. The optical seeing during the observations varied between 1.2′′ and 2.0′′.
The image was obtained using a 10′′ chop throw (perpendicular to the long axis of the source), while nodding was performed. In addition to the chopping, the source position was also jittered. The total integration time was 5.0 minutes, not considering the negative image in the chopped image. Only the positive image was used, since the PSF of the negative image was systematically wider. We used two photometric calibration stars: Y3501 and HR6736. The L-band magnitudes of these stars were measured by MSSSO photometry (McGregor 1994) and van der Bliek et al. (1996), respectively. As a reference for the point spread function (PSF), a nearby star, USNO 45024728679 () was used. The obtained PSF was used to deconvolve the ISAAC image of IRAS 16342. The FWHM of the PSF was calculated to be 0.35′′. The reduction was done using eclipse package version 4.1.2 (Devillard 1997), and DAOPHOTO under IDL.
2.3 TIMMI2 data
IRAS 16342 images at (narrow band), (narrow band), (broad band) and m (broad band) were observed with the Thermal Infrared Multi Mode Instrument (TIMMI2) at the ESO 3.60m telescope at La Silla, Chile, on August 11, 2001, using a Raytheon 240320 pixel AsSi array. The pixel scale of this detector is 0.202′′ per pixel. The recorded optical seeing during the observations varied between 0.92′′ and 2.0′′.
The images were obtained using a 15′′ chop throw in the north-south direction while nodding was performed. As a reference for the PSF, HD 124897 ( Boo) and HD 178345 were used. We combined individual chopped images into one image to improve the signal-to-noise. This was done by shifting the positive and negative images in each chopped frame to a prescribed position and then adding or subtracting them. Frames of poor quality were omitted. Finally, we deconvolved the resulting image, using either HD 124897 or HD 178345 as PSF. Due to non-photometric weather during the observations, the absolute flux calibration of the TIMMI2 images proved difficult and the results uncertain. Therefore, further attempts to do an absolute flux calibration on the images were not made. Moreover, we are mainly interested in the morphology of IRAS 16342 at different wavelengths, which does not require an accurate (absolute) calibration of the flux. We will use relative fluxes in the individual images only.
3 The ISO spectrum
3.1 Description of the spectrum
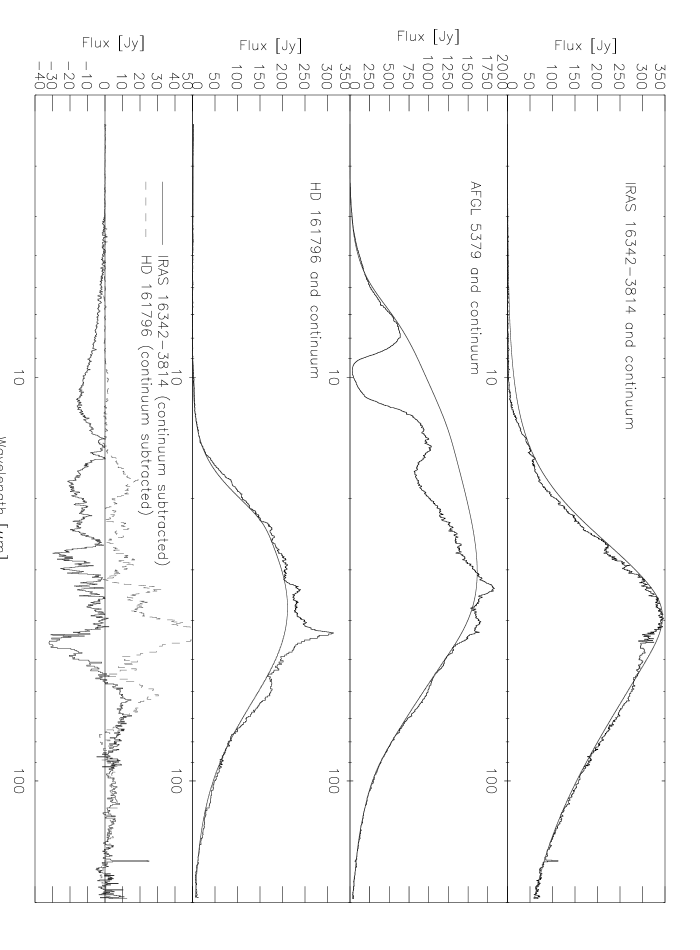
In the top panel of Fig. 1 we present the m ISO spectrum of IRAS 16342 (solid line). A possible continuum for the spectrum, which we will discuss below, is also given (smooth solid line). The second panel shows the spectrum of the OH/IR star AFGL 5379, studied in detail by Sylvester et al. (1999). The continuum for AFGL 5379 is taken from that paper. The and m amorphous silicate features are clearly visible. These absorption features are observed in many AGB stars, their strength depending on the optical depth of the dust, which is directly related to the mass-loss rate. The absorption features become stronger, and the spectrum redder, as increases (e.g. Bedijn, 1987). IRAS 16342 also shows the amorphous silicate features. The one at m was already detected in the IRAS LRS spectrum and fitted by Zijlstra et al. (2001). Compared to AFGL 5379, the amorphous silicate features in the spectrum of IRAS 16342 might seem to be absent at first glance! The spectrum of IRAS 16342-3814 is that of an extremely reddened OH/IR star. The third panel in Fig. 1 shows the spectrum of HD 161796. HD 161796 is another post-AGB object which has been studied in detail by Hoogzaad et al. (2002) and Meixner et al. (2002). The continuum for HD 161796 is taken from Hoogzaad et al. (2002).
A first inspection of the spectrum of IRAS 16342 suggests the presence of the characteristic features of crystalline silicates and crystalline water ice, though up to m they appear in absorption instead of in emission. To illustrate this, the continuum shown in the top panel of Fig. 1 has been drawn accordingly (smooth solid line). Following Molster et al. (2002b), we represented the continuum by a spline-fit and required it to be smooth and to maximize the continuum flux in both and . We emphasize that this continuum is used only to enhance the visibility of sharp features in the spectrum and has no physical meaning. In the lower panel of Fig. 1 we plot the continuum subtracted spectra of IRAS 16342 (solid line) and HD 161796 (dashed line). The continuum subtracted spectrum of HD 161796 is dominated by crystalline silicate and crystalline water ice emission features (Hoogzaad et al. 2002). A comparison of the suggested absorption features in IRAS 16342 with the emission features in HD 161796 shows an impressive agreement, indeed identifying the IRAS 16342 features as due to crystalline silicates and water ice, and justifying our original choice of the continuum. At wavelengths longwards of approximately m the features in the spectrum of IRAS 16342 are again in emission. Close to the peak of the SED, where the transition between absorption and emission occurs, the shape of the spectral features is less certain.
3.2 The mineralogy of IRAS 16342

-
†
By analogy with HD 161796 we tentatively identify clino-enstatite in the spectrum of IRAS 16342.
Table 2 lists the wavelength positions and identifications of the features found in the spectrum of IRAS 16342. We identify amorphous silicates, forsterite (), diopside (), crystalline water ice, and possibly clino-enstatite () as important solid state components of the circumstellar matter around this object. We also find [OI] and [CII] lines, indicating low density gas. The off source spectrum suggests that the [CII] line is largely interstellar, although a circumstellar contribution (up to in peak strength) may still be present. The [OI] line seems to be interstellar. After subtraction of the off source spectrum, in which the [OI] line is clearly seen, there is no clear evidence for a residual circumstellar component.
Fig. 2 shows part of the continuum subtracted spectrum of IRAS 16342 in more detail, together with the mass absorption coefficients for forsterite, clino-enstatite and diopside (Koike et al. 1999). Also shown is the absorbance of crystalline water ice measured at 50 K (Smith et al. 1994). The wavelength positions of the identified forsterite, diopside and crystalline water ice features are indicated with short vertical lines. We also indicate the positions of clino-enstatite bands. Due to blending with forsterite, and given that the bands are fairly weak, we cannot be certain that clino-enstatite is present. However, in most evolved stars both forsterite and enstatite are found together (Molster et al. 2002a), and we suggest this is also the case in IRAS 16342. The m amorphous silicate feature, the [OI] line and the unidentified m feature (e.g. Molster et al. 2002a) are also indicated.
The solid state materials found in the circumstellar environment of IRAS 16342 are also found around other (high mass-loss), oxygen rich, evolved stars (e.g. Koike et al. 2000; Molster et al. 2002a). The very red ISO spectrum suggests that the bulk of the material around IRAS 16342 must be cold. A low temperature may also be implied by the m feature of forsterite. This intrinsically weak feature is detected either when the forsterite is cold or very abundant. The feature at m has been found in the spectra of many sources (e.g. Molster et al. 2002a). Its nature is unclear at this time. FeSi has been proposed as a possible carrier (Ferrarotti et al. 2000), but this identification remains debatable (Molster et al. 2002a). The m feature is seen in emission, superposed on the m feature of crystalline water ice, which is in absorption. If real, this suggests that the carrier of the feature has a different spatial distribution than the crystalline water ice, otherwise both materials would be seen in absorption. An alternative explanation is that the feature is an artifact in the responsivity function of the ISO LWS detector. More study will be needed to explore this issue.
3.3 The Mass-loss history of IRAS 16342
No other OH/IR star known to us displays a spectrum reddened to the extent as is seen in IRAS 16342. Also, no other OH/IR star is known to have crystalline silicate features in absorption at wavelengths up to m. Though Sylvester et al. (1999) showed that crystalline silicate absorption features are present in OH/IR stars, they did not detect them longwards of m. The behaviour of the spectrum and the crystalline features in it is the result of a very high optical depth in the dust shell, which suggests that the star must have an extremely large mass-loss rate.
We modeled the spectrum of IRAS 16342 using the radiative transfer programme modust (Bouwman 2001). We did not try to make a detailed fit of the spectrum, but rather wanted to get an order of magnitude estimate on the mass-loss rate. We assumed an M9III AGB central star ( and ) surrounded by a spherical circumstellar envelope (composed of olivine and iron particles, following Kemper et al. (2002)) created by mass-loss from the central star. We derived . In this case the best match between the peak position of the synthetic spectrum and that of the data was obtained. Also, the lack of near infrared (m) flux was best modeled in this case.
The crystalline silicate absorption features in the ISO spectrum require that the envelope is optically thick up to about m. This implies that the lack of near infrared flux must be due to a large opacity towards the central star, contrary to other post-AGB objects where the lack of near infrared flux is due to the lack of dust close to the star (e.g. Hoogzaad et al. 2002). The high mass-loss rate suggested by our preliminary model is consistent with this large opacity, and can thus explain the lack of near infrared flux. However, more detailed modelling in the form of 2D radiative transfer calculations is needed in order to properly constrain the mass-loss rate of IRAS 16342.
The high mass-loss discussed above is only expected to occur during the SW phase of the AGB. Combined with the proto-PN nature of IRAS 16342, we conclude that IRAS 16342 must be a very young proto-PN, perhaps the youngest one observed so far. The star seems to be right at the transition point between the AGB phase (which explains its extreme OH/IR type spectrum) and the proto-PN phase. This makes IRAS 16342 a very interesting object for the study of the transition between OH/IR type AGB stars and proto-PN or post-AGB stars. The young proto-PN nature of IRAS 16342 is in agreement with SAH99. Still, the possibility of a more evolved central star can not be excluded, since the maser velocities in the lobes (see Sect. 1) are more in favour of an A or late type B star. It is difficult to understand how a later type star can drive such a fast wind.
4 The infrared images
4.1 Description of the images
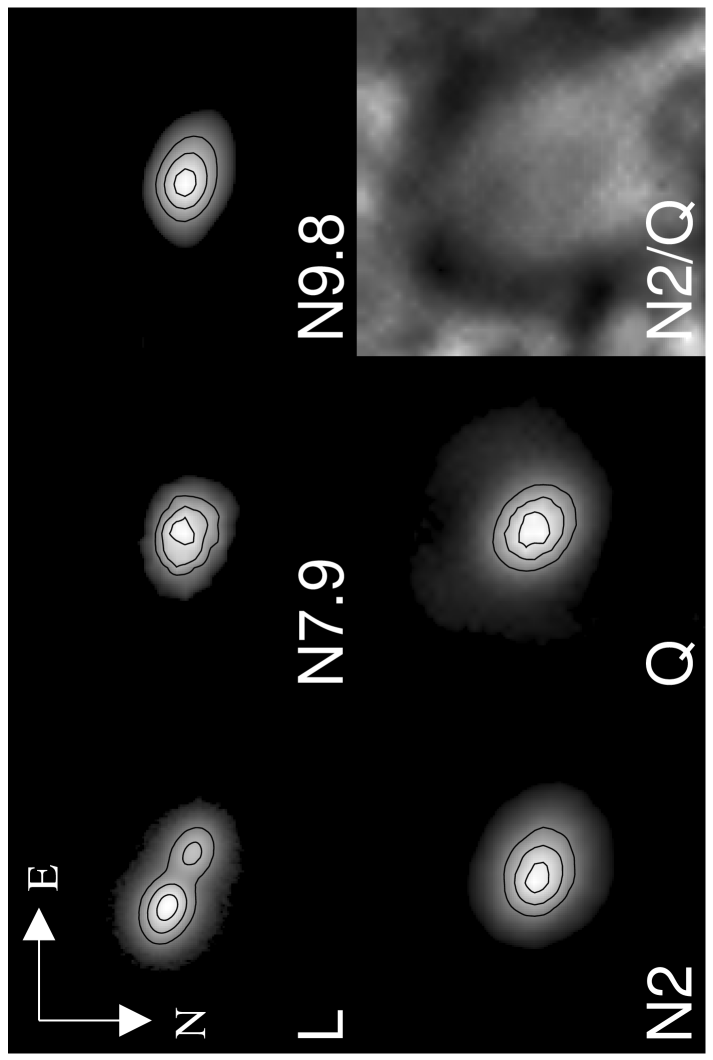
In Fig. 3 we present the deconvolved ISAAC and TIMMI2 images of IRAS 16342. The images were taken in the L, N7.9, N9.8, N2 and Q bands. The central wavelengths of these bands, , are given in Table 3. The lower right image shows the division of the N2 band image by the Q band image.
IRAS 16342 reveals a bipolar morphology in the L band. The bipolar nature is similar to that seen in the optical images taken with the HST by SAH99. In both cases we see two lobes, surrounded by a faint halo that follows the contours of the lobes. The TIMMI2 images reveal an ellipsoidal morphology, which may represent the bipolar nebula in the ISAAC and HST images, but at lower spatial resolution. Some caution is needed here however. The optical seeing during the observations with ISAAC and TIMMI2 were and respectively (see Sect. 2.2 and Sect. 2.3). In general, the seeing is better at longer wavelengths under the same optical seeing. Therefore we might also expect the TIMMI2 images to have an equal or even better spatial resolution than the ISAAC image, in which case differences seen between the images are intrinsic to IRAS 16342.
For each image, the size of the nebula along its major axis is listed in Table 3, together with , its position angle. We define the position angle as the angle between the major axis of the bipolar nebula and the north-south line, where represents north and represents east. Contrary to the size of the nebula, changes significantly as a function of wavelength, showing a decrease with increasing wavelength. For the TIMMI2 images, both and were measured by fitting two dimensional Gaussians to the images. The Full Width at Half Maximum (FWHM) of the Gaussian along its major axis and its tilt angle (i.e. ), were used to obtain d and respectively. For the ISAAC image we estimated and by eye, while for the HST image we either used values given by SAH99 or derived these values from their data.
The N7.9 band and the Q band reveal (sub)structure additional to the ellipsoidal structure mentioned in the previous paragraph. The N7.9 band shows some extra extended emission in the north-east direction. Also, compared to the other bands, the morphology in the N7.9 band seems to be less smooth, with more spatial brightness variations. However, due to the low signal-to-noise quality of the data it is difficult to determine if the structures are real. Therefore, they should be treated with caution. The Q band image reveals extended emission, or a halo, surrounding the central ellips. The halo is roughly spherically symmetric, with a gap in the north eastern direction, and approximately 6′′ in diameter, i.e. twice the size of the bipolar nebula. The halo can also be seen in the lower right part of Fig. 3, displaying the division of the N2 band and the Q band images. The division shows that the halo is not uniformly bright.
4.2 The morphology of IRAS 16342
4.2.1 The lobes
Given the similarities with the HST image, it seems natural to explain the bipolar nebula in the L band as due to reflection as well. Using this assumption, we will show in Sect. 4.3 that the dust particles in the lobes must be small (m). If scattering by small particles is indeed responsible for the presence of the bipolar nebula in the ISAAC image at m, a very red bright source is needed to illuminate the nebula, since small dust particles usually scatter poorly at wavelengths large compared to their radii. This very red source may either be the central star of IRAS 16342 or the inner regions of the torus. If it is the central star, this suggests that IRAS 16342 only recently entered the post-AGB phase, in agreement with our results from Sect. 3.3.
An alternative to the scattering scenario in the L band might be that the observed light is caused by thermal dust emission. This is unlikely however. The dust temperature in the lobes at a distance from the central star, , may be represented by . This expression assumes that the lobes are optically thin for photospheric radiation and that the dust emission efficiency scales as . Using Wiens law, we need to emit efficiently at m. With and (also see Sect. 3.3) we find that the radius of the region that can be heated to this temperature is . Using the distance of 2 kpc given by SAH99 and an angular diameter of 3′′, the observed radius of the lobes is 3000 AU. This is 50 times larger than the expected typical size of the emitting region derived above. We therefore exclude thermal dust emission as the source of radiation in the ISAAC image. Non equilibrium emission from small grains is also unlikely, since this requires the presence of UV photons (Andriesse 1978) and these are not likely to be present in the system. However, it can not be ruled out completely.
The behaviour of as a function of wavelength suggests that (as expected) the dominant source of radiation changes from scattering to thermal emission. At the shortest wavelengths the source is closely aligned in the direction of the bipolar scattering nebulae seen in the HST images; at longer wavelengths the source tends to align more with the torus described in Sect. 1, which is expected to be dominated by thermal emission. Still, even up to m the elongation is approximately along the major axis of the nebula seen with HST and ISAAC, suggesting that the torus must be very cold (). This is in agreement with the very red ISO spectrum, which is most likely dominated by thermal emission from the material in the torus.
4.2.2 The halo
We expect the halo in the Q band image to be due to a previous, more spherical, episode of mass-loss on the AGB. Given the size of the halo (6′′) and the bipolar nebula (3′′) and assuming an outflow velocity of during the AGB phase, and a distance of 2 kpc (SAH99), we find that the mass in the halo was ejected between approximately 950 and 1900 years ago. The Q band image therefore suggests that the transition from a (more) spherical to a more axial symmetric form of mass-loss for IRAS 16342 only occured near the very end of the AGB. We speculate that the non uniform brightness distribution may indicate that there are density enhancements in the halo, but this remains questionable. More observations are required to investigate this possibility.
4.3 Limits on grain sizes
Using a simple model, we can put constraints on the particle size of the dust in both the torus and the lobes. Now we will explain the model in detail and discuss its results. We will show that there are two independent methods that allow us to derive the optical depth in the torus along the line-of-sight towards the eastern lobe. The first method depends on the dust particle size in the lobes, while the second method depends on the particle size in the torus. Both methods must yield the same optical depth for a given wavelength. Applying this constraint and calculating the optical depth with both methods for three different wavelengths, yields the particle size in both the lobes and the torus.
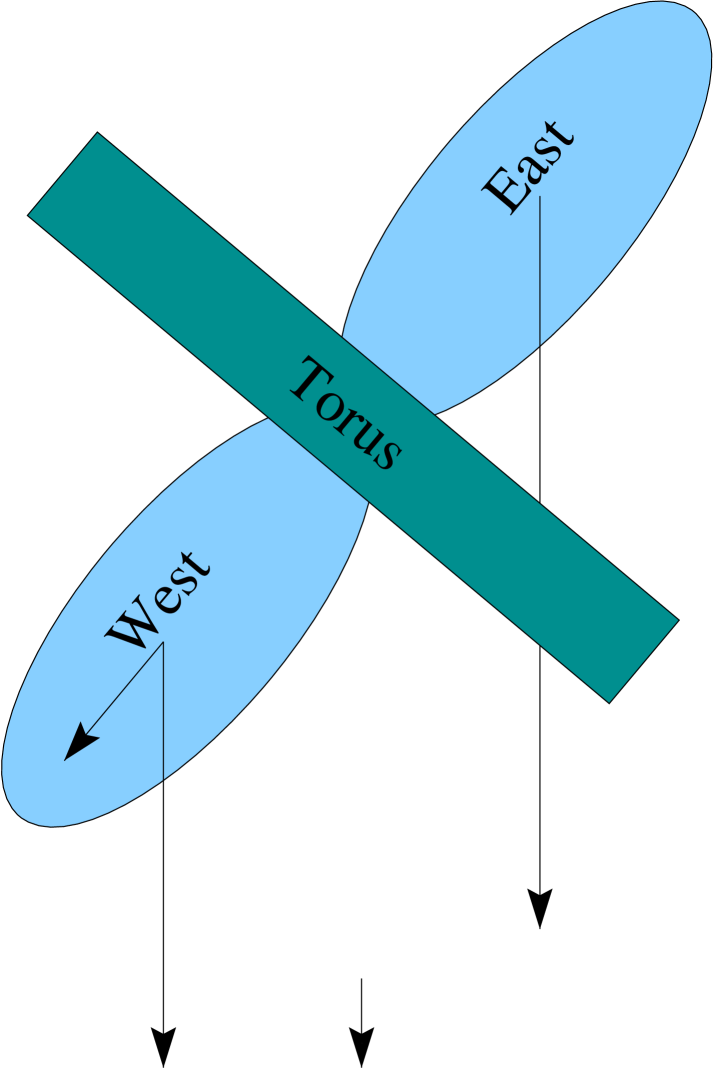
Our model makes use of the following assumptions. The eastern lobe in the HST and ISAAC images is significantly redder than the western lobe. In order to explain this additional reddening, we assume the eastern lobe to be located completely behind the torus, and the western lobe to be positioned completely in front of the torus (see Fig. 4). The torus acts as a screen that causes additional reddening of the eastern lobe with respect to the western lobe. We assume that scattering is the dominant source of emission in the lobes, and that both scattering lobes are intrinsically equally bright. Even in the absence of the (extinction due to the) torus, the lobes will not appear equally bright as seen from Earth, due to the orientation of the system. The orientation causes the eastern lobe to be dominated by back scattering, while the western lobe is dominated by forward scattering. As a result, the eastern lobe will appear less bright than the western lobe. Interstellar reddening is assumed to be the same for both lobes, and scattering of stellar radiation within the torus is assumed to be unimportant (due to its large radial optical depth).
In the first method to derive the optical depth in the torus we measure the intensities of the eastern and western lobes, and , as seen from Earth (see Fig. 4). These are given by
| (1) |
| (2) |
respectively, where is the intrinsic intensity of each lobe. is the characteristic particle size in the lobes, while is the scattering phase function of a particle with radius irradiated at wavelength and scattering at an angle . The phase function was calculated for size distributions of spherical grains using Mie theory (Bohren & Huffman 1983). Finally, is the inclination angle of the system, defined as the angle between the major axis of the nebula and the line-of-sight. We take (SAH99). is the optical depth of the torus along the line-of-sight towards the eastern lobe. From Eq. (1) and (2) we find
| (3) |
This yields for different values of .
The intensity ratio was determined from the magnitude difference between the lobes, , which was either given by SAH99 or we measured it ourselves. This implies that we replaced the intensity ratios by flux ratios. The values for the magnitude differences are listed in Table 4, together with the corresponding intensity ratios.
We describe the grain size distribution used in the calculation of by a power law with . This value was chosen for calculation conveniences. Differences with models using the more generally adopted ISM value of -3.5 (e.g. Mathis et al. 1977) are expected to be small. The effective width of the size distribution was kept fixed. The grains in the lobes were assumed to be composed of silicates, for which we used the optical constants of ‘cold’ silicates derived by Suh (1999). Using the optical constants of ‘warm’ silicates derived by Suh (1999) yields very similar results (not shown).
In the second method we derive from the well known relation
| (4) |
where is the dust particle number density in a dust column of length along the line-of-sight; and are the characteristic radius and extinction efficiency of the particles in the torus. For the calculation of the extinction efficiency we adopt the same dust properties as those assumed above for the calculation of the scattering phase functions.
Eq. (3) and (4) should yield the same result for at a given wavelength. Ratios between optical depths are independent of and and therefore allow a relatively easy derivation of the particle sizes in the lobes and the torus.
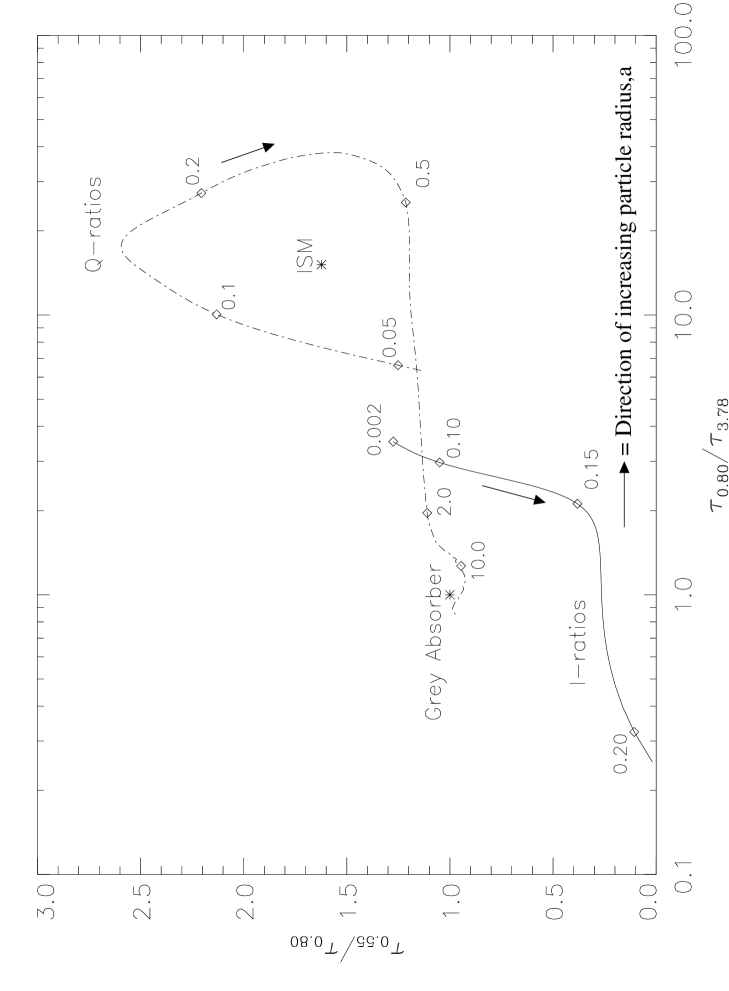
Using Eq. (3) and the appropriate intensity ratios (see Table 4) and phase functions, we measured at , and m for different assumptions for the characteristic particle size in the lobes, . In Fig. 5 is plotted versus with as a free parameter (see line indicated with ‘I-ratios’). We also calculated at the above wavelengths for different values of the characteristic particle size in the torus, . Since , we must have
| (5) |
and
| (6) |
independent of and . In Fig. 5 we again plot versus , this time with as a free parameter (see line indicated with ‘Q-ratios’). The intersection of the two curves provides a consistent set for and .
For the lobes we find that we have a size distribution with a maximum particle size m, while for the torus we find m. Both values are independent of the adopted effective width of the size distribution, which we take to be the same for particles in both the torus and the lobes. A test with amorphous olivines instead of the cold ‘Suh’ silicates yielded a similar result. The errors on the particle sizes are derived from an error analysis on Eq. (3) taking the errors on and into account for each wavelength (see Table 4). We are interested in the maximum particle size of the distribution instead of the typical (i.e. effective) particle size. This is because we want to set upper limits on the particle sizes found in the lobes and torus. The typical size simply scales linearly with the maximum particle size.
We thus derive that the maximum particle size in the torus is about an order of magnitude larger than the maximum particle size in the lobes. In an AGB outflow, the particle size of the grains formed in the outflow is proportional to the density of the envelope at the dust condensation radius (Dominik 1992). Larger densities provide larger grains. The spatial distribution of large particles in a torus geometry suggests that this material is expelled from the AGB star in an aspherical high density wind. In a natural way, this accounts for the presence of large grains in the torus and small grains in the lobes. However, the bipolar morphology of IRAS 16342 may also have originated from a later phase, i.e. after the AGB. In this case, the AGB wind may have been spherical, but due to the interaction of this wind with the (more recent) fast bipolar molecular outflow, the morphology may have changed into the observed torus like spatial distribution. The interaction of these two flows may have caused a shattering of the dust particles in the lobes into smaller ones, while leaving the grains in the torus intact. Regardless of the correct scenario, the presence of the bipolar nebula in IRAS 16342 at optical wavelengths suggests that the mass-loss rate near the central star very recently must have dropped, otherwise the optical photons in this nebula would not be able to escape. Obviously the star has already managed to create a bipolar cavity while the optical depth of the dust shell in the equatorial torus is still huge.
The derived particle size for the torus is large compared to the typical ISM values, which are of the order of to m (e.g. Mathis et al. 1977), but in agreement with other objects for which large mass-loss rates are expected. Examples of such sources are the binary system AFGL 4106 (Molster et al. 1999) and the post-AGB star HD161796 (Hoogzaad et al. 2002). The large grain size in the torus explains why the dust particles in the torus of IRAS 16342 are grey compared to the ISM.
We finally note that when the emission in the ISAAC image at m is caused by non equilibrium emission from small dust grains, as was considered in Sect. 4.2.1, the resulting particle sizes in the lobes and torus are very similar to those derived above. The possibility of non equilibrium emission by small grains at m can simply be modeled by leaving and out of equation 3 for , i.e. by assuming that at m there is no scattering.
5 Conclusions
The results of our study can be summarised as follows:
-
1.
The ISO spectrum of IRAS 16342 is that of an extremely reddened OH/IR star. In addition to amorphous silicate absorption features at and m, the spectrum shows crystalline silicate features in absorption at wavelengths up to m. Only at longer wavelengths the crystalline features are in emission. No other OH/IR star is known to show this behaviour. We estimate the mass-loss rate of IRAS 16342 may be as large as . This high rate explains the lack of flux in the near-IR as well as the peak wavelength in the SED.
-
2.
We identify forsterite (), diopside (), and possibly clino-enstatite () in the spectrum. Besides these crystalline silicates, also crystalline water ice is detected. All these materials are also found around other (high ), oxygen rich, evolved stars. At m a (to date) unidentified feature is seen.
-
3.
IRAS 16342 must be a very young proto-PN, perhaps the youngest one observed until present. The central star seems to be right at the transition point between the AGB phase and the proto-PN phase.
-
4.
The deconvolved L band ISAAC image of IRAS 16342 at m reveals a bipolar scattering nebula. Both lobes of the nebula are separated by a dark equatorial waist, or torus. This morphology is consistent with that found in HST images. The presence of the scattering nebula in the L band suggests that the central star of IRAS 16342 may be very red, which would be in agreement with the young proto-PN nature of the system. The TIMMI2 Q band image reveals thermal emission from an extended, roughly spherical halo of in diameter. We expect the halo to be due to a previous, more spherical, phase of mass-loss on the AGB. This halo material was ejected between approximately 950 and 1900 years ago.
-
5.
TIMMI2 images at wavelengths intermediate to the L and Q band reveal an ellipsoidal morphology, which may represent the bipolar nebula but at lower spatial resolution. The position angle of the nebula changes as a function of wavelength, suggesting that the nature of the radiation changes from scattered light to thermal emission (by cold material). Still, even up to m the elongation is approximately along the major axis of the nebula seen in the optical and near-IR, suggesting that the equatorial torus must be very cold. This is in agreement with the very red ISO spectrum, which is most likely dominated by thermal emission from this torus.
-
6.
Using a simple model for the geometry of IRAS 16342, we calculate the dust particle sizes in both the torus and the lobes. The grains in the lobes have a maximum particle size m, while for the torus we find m. The relatively large torus grains suggest that the bipolar morphology of IRAS 16342 may already have been created during the AGB phase.
Acknowledgements.
C. Dijkstra wishes to thank Sacha Hony for his help on the data reduction of the TIMMI2 data. We are grateful for the support by the staff of the ESO 3.6m telescope.References
- Andriesse (1978) Andriesse, C. D. 1978, A&A, 66, 169
- Bohren & Huffman (1983) Bohren, C. F. & Huffman, D. R. 1983, Absorption and Scattering of Light by Small Particles (New York: Wiley)
- Bouwman (2001) Bouwman, J. 2001, Ph.D. Thesis University of Amsterdam
- Clegg et al. (1996) Clegg, P. E., Ade, P. A. R., Armand, C., et al. 1996, A&A, 315, L38
- de Graauw et al. (1996) de Graauw, T., Haser, L. N., Beintema, D. A., et al. 1996, A&A, 315, L49
- Devillard (1997) Devillard, N. 1997, The Messenger, 87
- Dominik (1992) Dominik, C. 1992, Thesis Technischen Universität Berlin
- Ferrarotti et al. (2000) Ferrarotti, A., Gail, H.-P., Degiorgi, L., & Ott, H. R. 2000, A&A, 357, L13
- Guertler et al. (1996) Guertler, J., Koempe, C., & Henning, T. 1996, A&A, 305, 878
- Hoogzaad et al. (2002) Hoogzaad, S. N., Molster, F. J., Dominik, C., et al. 2002, A&A, 389, 547
- Kemper et al. (2002) Kemper, F., de Koter, A., Waters, L. B. F. M., Bouwman, J., & Tielens, A. G. G. M. 2002, A&A, 384, 585
- Koike et al. (2000) Koike, C., Tsuchiyama, A., Shibai, H., et al. 2000, A&A, 363, 1115
- Koike et al. (1999) Koike, C., Tsuchiyama, A., & Suto, H. 1999, Proc. of the 32nd ISAS Lunar and Planetary Symposium, 32, 175
- Likkel & Morris (1988) Likkel, L. & Morris, M. 1988, ApJ, 329, 914
- Likkel et al. (1992) Likkel, L., Morris, M., & Maddalena, R. J. 1992, A&A, 256, 581
- Mathis et al. (1977) Mathis, J. S., Rumpl, W., & Nordsieck, K. H. 1977, ApJ, 217, 425
- McGregor (1994) McGregor, P. J. 1994, PASP, 106, 508
- Meixner et al. (2002) Meixner, M., Ueta, T., Bobrowsky, M., & Speck, A. 2002, ApJ, 571, 936
- Meixner et al. (1999) Meixner, M., Ueta, T., Dayal, A., et al. 1999, ApJS, 122, 221
- Molster et al. (2002a) Molster, F. J., Waters, L. B. F. M., & Tielens, A. G. G. M. 2002a, A&A, 382, 222
- Molster et al. (2002b) Molster, F. J., Waters, L. B. F. M., Tielens, A. G. G. M., & Barlow, M. J. 2002b, A&A, 382, 184
- Molster et al. (1999) Molster, F. J., Waters, L. B. F. M., Trams, N. R., et al. 1999, A&A, 350, 163
- Sahai et al. (1999) Sahai, R., Te Lintel Hekkert, P., Morris, M., Zijlstra, A., & Likkel, L. 1999, ApJ, 514, L115
- Savage & Mathis (1979) Savage, B. D. & Mathis, J. S. 1979, ARA&A, 17, 73
- Smith et al. (1994) Smith, R. G., Robinson, G., Hyland, A. R., & Carpenter, G. L. 1994, MNRAS, 271, 481
- Suh (1999) Suh, K. 1999, MNRAS, 304, 389
- Sylvester et al. (1999) Sylvester, R. J., Kemper, F., Barlow, M. J., et al. 1999, A&A, 352, 587
- Ueta et al. (2000) Ueta, T., Meixner, M., & Bobrowsky, M. 2000, ApJ, 528, 861
- van der Bliek et al. (1996) van der Bliek, N. S., Manfroid, J., & Bouchet, P. 1996, A&AS, 119, 547
- Zijlstra et al. (2001) Zijlstra, A. A., Chapman, J. M., te Lintel Hekkert, P., et al. 2001, MNRAS, 322, 280
- Zuckerman & Lo (1987) Zuckerman, B. & Lo, K. Y. 1987, A&A, 173, 263