The CNO problem in magnetic CVs
Abstract
Some polars like BY Cam are characterized by unusual CNO line ratios compared to other polars and non-solar abundances have been suggested to explain this anomaly. We present here a first attempt to constrain the elemental abundances in these systems by applying a specific ionisation model combined with a geometrical description of the accretion column where these lines are thought to be formed. The line luminosities have been computed using the CLOUDY plasma code for different ionisation spectra and column extension. We show here selected results and compare to the values observed in ”peculiar” magnetic CVs. The model applied to BY Cam confirms that ionization models with solar abundances fail to reproduce the observed line intensity ratios. Assuming the model to be valid, the induced best abundances imply an overabundance of N (x25), underabundance of C (:8) and nearly solar O (:2), in line with CNO reprocessing.
Service d’Astrophysique, DSM/DAPNIA/SAp, CEA Saclay, 91191 Gif-sur-Yvette, France
Observatoire de Paris, 92190 Meudon, France
1. Introduction
Magnetic Cataclysmic Variables (MCVs are close binary systems where a magnetic white dwarf accretes matter from a low-mass companion via an accretion column. The broad emission lines observed in the optical, mostly hydrogen and helium, are thought to arise from irradiation of this column by the X-ray flux emerging from a shock above the heated polar cap of the white dwarf. Ultraviolet observations with the IUE satellite have also revealed among MCVs the existence of strong resonance lines of silicium SiIV(1397), nitrogen NV(1240) and carbon CIV(1549). Most sources were found to have line intensity ratios NV/CIV and SiIV/CIV similar to all other CVs (see Mauche et al. 1997, for a review).
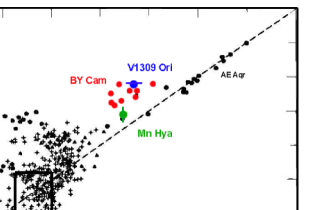
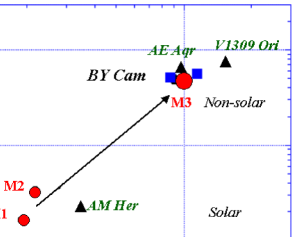
A new situation arised however when the source BY Cam was observed with IUE, shortly after its discovery as a polar, on the basis of its optical polarisation by Remillard et al. (1986). It was shown to display an impressive NV(1240) line with an intensity greater than CIV(1549), an ”inverted ratio” with respect to other MCVs (Bonnet-Bidaud & Mouchet 1987, BM87)). It was noted at that time that this unusual feature could be due to non-solar abundances resulting from an unnoticed nova event or from a chemical evolution of the secondary (BM87, Mouchet et al. 1990). Shortly after, the discovery that BY Cam is slightly desynchronised (Silber et al. 1992) and the identification of a known historical nova, V1500 Cygni, as a polar which is also desynchronised (Schmidt & Stockman 1991), gave further arguments to the nova hypothesis. However HST observations of more recent MCVs have gradually changed this picture since at least two synchronous polars, V1309 Ori (Szkody & Silber 1996, Schmidt & Stockman 2001) and MN Hya (Schmidt & Stockman 2001), have now been found to also show a large NV/CIV ratio, though less extreme than in BY Cam. Figure 1 summarises the present situation. Most CVs nicely cluster around similar values, including MCVs (shown by typical values observed for AM Her), while an order magnitude difference is observed for BY Cam, V1309 Ori and MN Hya. Also noticeable are the extreme values observed for AE Aqr.
The number of anomalous sources now points to what can be called the ”CNO problem” among MCVs. The explanation of these discrepant line ratios is still pending. An abundance effect is an obvious possibility but as the lines are most probably formed by photoionisation, differences may also arise from specific ionisation conditions. We present here the results of line computations for BY Cam which show that only significant non-solar abundances can reproduce the observed line ratios.
2. Model of the accretion column
To compute the line flux, we adopt an approach similar to the work of Stockman & Schmidt (1996) by coupling a photoionized code with a simple description of the accretion column. Following Langer et al. (1982), we model the accretion column with a variable cross-section according to the dipole geometry and free-fall velocities along the column, yielding a density varying with the distance to the white dwarf, as . The density, n0, at the basis of the column, is computed from the accretion luminosity LX as n0 = cm-3 (LX/ erg s-1), assuming a typical value of 1016 cm2 for the polar cap surface, and a 0.8 M white dwarf. The accretion column was approximated by a succession of different slabs of constant densities with a maximum extension chosen so that the density drops by a factor 4 from one slab to the next, up to a maximum extension of 50 times the white dwarf radius, i.e. about 1/4 of the Roche lobe radius (Mouchet et al. 1997). The lateral extension of each region was assumed to follow the dipole geometry with a size varying as (r/Rwd)3/2.
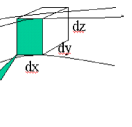
Line intensities are computed using the photoionisation code CLOUDY (Ferland et al. 1998). Contribution from the different constant density slabs are added, considering only direct unobscured sideways illumination. Taking into account of the bending of the column, this is of course only strictly true for the highest parts of the column. It was verified however that, in all cases, the lowest slabs of higher densities do not contribute significantly to the total flux of the considered lines (see below). In the same way, it was checked that for a minimum height above the white dwarf , the density and column density are respectively lower than cm-3 and cm-2, in the range of acceptable values for CLOUDY.
3. Line intensities of BY Cam
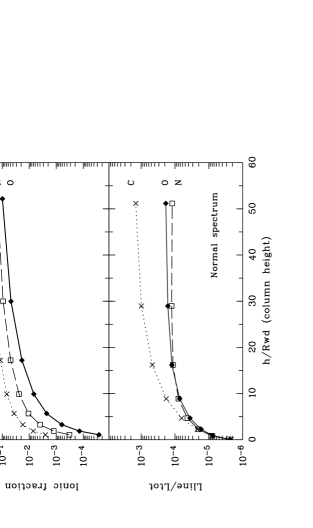
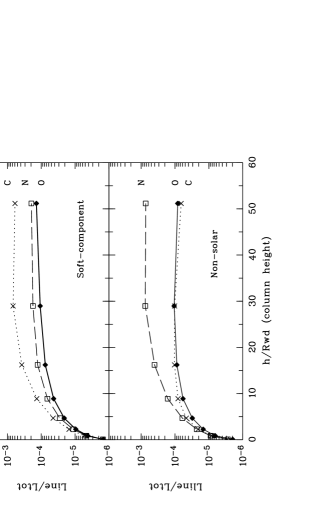
The luminosities of the three resonance lines CIV (1549), NV (1240) and OVI (1035) were computed for BY Cam with this model, for different ionizing spectra and element abundances. Figure 3 shows the result corresponding to the observed ”normal” spectrum (model M1), defined as the sum of a 20 keV bremsstrahlung, as observed in the RXTE observations (Mukai, private communication) and of a 50 eV blackbody with a bolometric luminosity of 0.1 times the hard X-ray luminosity (Ramsay et al. 1994) with solar abundances. The ionic fractions and line luminosities, after a sharp increase close to the white dwarf, are nearly constant in the upper part of the column, CIV being the dominant species over NV and OVI. This yields N/C and O/C line ratios of respectively 0.16 and 0.19, compared to the observed values of 5.70 and 1.14 (see Table 1). As the ionisation structure is particularly dependent on the soft part of the ionizing spectrum, we also investigate the possibility of an unseen ”soft component”. For a neutral H interstellar column density of cm-2, it is found that a 10 eV blackbody component with a luminosity similar to that of the bremsstrahlung component, could remain undetected and still be compatible with the flux upper limit at 100 Å of erg cm-2 s-1Å-1 derived from the EUVE observations (Howell, private communication). Corresponding results for this spectrum (model M2) are shown in Fig. 4 (top) and values listed in Table 1. The N contribution is increased and C decreased but even for this extreme spectrum, the predicted line ratios still fall short of the observed ones.
Assuming this simplified model of the accretion model to be valid, a way is provided to measure the elemental abundances. As the source is somewhat variable, no exact fit was attempted but the observed mean values can be reproduced by keeping the standard spectrum and significantly altering the abundances with an overabundance of N (x25), underabundance of C (:8) and nearly solar value for O (:2) (model M3, Fig. 4 (bottom) and Table 1). Note that these values are only indicative and that slightly different other combinations can be found which match the observed values.
| Ratio | Observed* | Dereddened* | Model M1 | Model M2 | Model M3 |
|---|---|---|---|---|---|
| Normal | Soft | Non-solar | |||
| N/C | 5.30 | 5.70 | 0.16 | 0.23 | 5.00 |
| O/C | 0.92 | 1.14 | 0.19 | 0.22 | 0.90 |
| O/N | 0.17 | 0.20 | 1.18 | 0.66 | 0.18 |
* values from Mouchet et al. (2003) and these proceedings
4. Discussion
FUSE, HUT and Orfeus observations, combined to previous ultraviolet results, now provide a complete view of the CNO lithium-like lines produced in MCVs. Anomalous line ratios are found for at least three sources. Though some variability may be invoked, at least in the case of BY Cam, the overall feature is stable around values an order of magnitude different from other MCVs. Photoionisation models of the accretion column, such as presented here, fail to reproduce these ratios, even by strongly varying the ionisation conditions, inside the range compatible with the observed spectrum. Some care should be taken in interpreting the results since important simplifications have to be introduced, in particular by considering an homogeneous accretion column. The case of a clumpy flow with blob accretion have to be further considered with the possibility of a dominant collisional ionisation.
In view of the large variations in the line ratios, a change in the abundances as deduced in the present work is however strongly suggested. For BY Cam, the observed N/C and O/C ratios points toward a CNO redistribution in which carbon is depleted in favour of nitrogen while the oxygen only slightly varies. This is consistent with what expected from a typical CNO cycle (Clayton 1983). The nova hypothesis first proposed for BY Cam (BM87) does not seem to be confirmed by the determination of a relatively low white dwarf temperature (Sion, these proceedings) and the efficiency of re-accretion is also questionable (Stehle & Ritter 1999). However, the recent discovery of an unexpected high H2 column density in front of the source (Mouchet et al. 2003) may be an indication of a significant circumstellar material related to nova activity. The increasing number of sources now showing peculiar line ratios makes however this hypothesis not the unique explanation and alternate scenarios have to be found.
In a recent work, Schenker et al. (2002) have pointed out the importance of pre-evolution of CV systems to explain the characteristics of the propeller system AE Aqr which is suggested to descend from a supersoft X-ray binaries. It is also worth to note that different other close binary systems such as the intermediate-mass X-ray binary Her X-1 (Jimenez-Garate 2002) and the low-mass soft X-ray transient XTEJ1118+480 (Haswell et al. 2002) have now been found to show non-solar abundances with values N/C=14-20 and N/C 6 respectively. In all cases, an evolution effect of the companion is invoked as the most probable origin. This may therefore be an indication of a more general process at work in the evolution of binary systems which have been neglected up to now.
References
Bonnet-Bidaud, J.M., Mouchet, M. 1987, A&A, 188, 89 (BM87)
Clayton, D. 1983, Principles of Stellar Evolution, Chicago Univ Press
Ferland, G.J., Korista, K.T., Verner, D.A., et al. 1998, PASP, 110, 761
Haswell, C., Hynes, R., King, A. et al. 2002, MNRAS 332, 928
Jimenez-Garate, M., Hailey, C., den Herder, J. et al. 2002, ApJ 578, 391
Langer, S.H., Chanmugam, G., Shaviv, G. 1982, ApJ, 258, 289
Mauche, C.W., Lee, Y.P., & Kallman, T.R. 1997, ApJ, 477, 832
Mouchet, M., Bonnet-Bidaud, J.M., Hameury, J.M. 1990, in ”Accretion-Powered Compact Binaries”, ed C. Mauche (CUP), 247
Mouchet, M., Bonnet-Bidaud, J.M., Somov, N.N., Somova, T.A. 1997, A&A, 324, 109
Mouchet, M., Bonnet-Bidaud, J.M., Abada-Simon, M. et al. 2002, in ”Classical Novae Explosions”, AIP Conf Proc. 637, 67
Mouchet, M., Bonnet-Bidaud, J.M., Roueff, E. et al. 2003, A&A (in press)
Ramsay, G., Mason, K., Cropper, M., et al. 1994, MNRAS, 270, 692
Remillard, R.A., Bradt, H.V., McClintock, J.E., et al. 1986, ApJ, 302, L11
Schenker, K., King, A.R., Kolb, U., Wynn, G.A., Zhang, Z. 2002, MNRAS, 337, 1105
Schmidt, G.D., Stockman, H.S. 1991, ApJ, 371, 749
Stockman, H.S., Schmidt, G.D. 1996, ApJ, 468, 883
Schmidt, G.D., Stockman, H.S. 2001, ApJ, 548, 410
Silber, A., Bradt, H.V., Ishida, M., et al. 1992, ApJ, 389, 704
Stehle, R., Ritter, H. 1999, MNRAS, 309, 245
Szkody, P., Silber, A. 1996, AJ, 112, 239