The Absorption and Emission Kinematics in the Mg II Absorber Towards Q1331+17111This paper is based on observations collected with the VLT at the European Southern Observatory, Chile, as part of ESO programs 67.A-0334 and 68.A-0170..
Abstract
We present a comparative analysis of the galaxy emission and QSO absorption kinematics of a Mg II system and its candidate absorbing galaxy (G5) located 3.86 arcsecs (28.3 kpc) from the QSO. We have obtained a spectrum of the galaxy candidate, previously identified as a luminous edge-on disk, and detect the [OII] Å doublet at a systemic redshift of . From slit spectroscopy of this galaxy, we find km/s, and possibly as large as 350 km/s. Plotted on the same velocity scale, the systemic redshift of the galaxy coincides with the center of the absorption system, although the absorption components span more than 100 km/s in either direction. However, once the sense of the rotation is taken into account, there is no absorbing gas at the projected velocity of the disk rotation curve. This implies incompatibility with a simple disk scenario. Moreover, a re-analysis of archival HST data reveals that the galaxy is only 0.3 , considerably less luminous than previously reported in the literature. This is incompatible with the established Tully-Fisher relation at this redshift, unless approximately 2 magnitudes of total extinction are invoked. Careful inspection of the archival HST data reveal that G5 may well be composed of two galaxies, although the quality of the data do not permit a detailed investigation of this. This possibility is further supported by the identification of a second faint emission line at Å, whose distinct spatial and velocity profile indicates that it arises in a different galaxy at a different redshift. Analysis of the absorption lines shows evidence for superbubbles in the interstellar medium (ISM) of the absorbing galaxy, based on the striking symmetry between components and large Mg I/Mg II and Mg I/Fe II ratios, indicative of large densities. The large velocity separations between line pairings, km/s indicates that these bubbles may be powered by OB associations comparable to the largest observed at and that the gas is probably enriched to at least 1/10 solar metallicity. This is consistent with observations at low redshift that extended Mg II halos are often seen in galaxies that contain disturbed gas. Superbubbles may also explain why the absorber has a relatively large Mg II equivalent width relative to the luminosity of the associated galaxy (or galaxies).
1 Introduction
Quasar absorption lines have developed into a key tool for probing the evolving population of galaxies from high redshift to the present day. Since selecting galaxies based on their absorption, rather than emission properties circumvents selection effects associated with Malmquist bias, this is a potentially powerful technique for tracing the evolution of gas repositories over the bulk of the Hubble time. One of the most challenging aspects of quasar absorption line research is the association between different types of absorbers and their galactic counterparts; without this crucial information we are lacking an infra-structure within which to interpret the results. This crux is perhaps best highlighted by the work which has focussed on Damped Lyman Alpha systems (DLAs). DLAs have been variously associated with galactic disks (Prochaska & Wolfe 1997, 1999), low surface brightness galaxies (Jimenez et al. 1999), dwarfs (Nulsen et al. 1998), merging protogalactic clumps (Haehnelt et al. 1998) and galactic winds (Schaye 2001). A key diagnostic to the nature of high redshift DLAs is the combined study of low redshift absorbers whose counterpart galaxies can be investigated in tandem. Establishing an understanding of low redshift galaxy absorption properties through the profiling of abundances, luminosities, morphologies and star formation histories is essential for extrapolation to high redshifts where only absorption line abundances are available. Unfortunately, the direct identification of DLA galaxies has seen relatively slow progress. Some 20 DLAs now have tentative counterparts (e.g., Le Brun et al. 1997; Turnshek et al. 2001; Nestor et al. 2001; Bowen, Tripp & Jenkins 2001), although only approximately 25% of these have actually been confirmed spectroscopically. Clearly, increasing the number of spectroscopic confirmations is a priority, one which has been highlighted by the results of Rosenberg & Schneider (2002) who warn against simply assigning the identification to the nearest bright galaxy.
The characterisation of strong Mg II absorbers at has been significantly more successful than for classical DLAs, with the identification of a galaxy candidate within 40 kpc in almost every case (Steidel, Dickinson & Persson 1994; Steidel et al. 1997), many of which have been spectrscopically confirmed. Modelling of the absorption line profiles of Mg II systems has been undertaken in a similar vein to DLAs (e.g., Lanzetta & Bowen 1992; Charlton & Churchill 1998; Bond et al. 2001b), including models of radial infall to explain the almost unit covering factor (but see also Charlton & Churchill 1996). Most recently, Steidel et al. (2002) have directly investigated the connection between absorption and emission kinematics in 5 Mg II galaxies and found that the absorption profiles seem to be consistent with rotation, although the kinematics cannot be explained by a simple disk model. To our knowledge, the kinematics of absorber-galaxy systems have been investigated in only 2 other studies (Barcons, Lanzetta, & Webb 1995; Lanzetta et al. 1997). Although the former study also finds kinematics consistent with disk rotation, Lanzetta et al (1997) intriguingly find the absorption gas moving counter to the rotation direction of the galaxy disk.
Here we present the results of a multi-faceted investigation of the kinematics of a Mg II absorber at towards Q1331+17 which combines high resolution QSO absorption line data with slit spectroscopy and HST imaging of the galaxy counterpart. This absorber not only represents an eighth system for which the connection between absorption and emission kinematics can be explored at intermediate redshift, but additionally allows us to investigate the presence of superbubbles recently suggested by Bond et al. (2001a). Bond et al. (2001b) have proposed that a subset of strong Mg II absorbers may be associated with superbubbles or winds; shells of expanding gas scooped up in the ISM of absorbing galaxies (e.g. Bond et al. 2001a; Rauch et al. 2002). The Mg II system towards Q1331+17 has been previously investigated by Bond et al. (2001a) as a particular case study for bubbles due to the striking pair-wise structure of absorption lines seen in Keck HIRES spectra, first highlighted by Churchill, Vogt & Steidel (1995). Large-scale outflows associated with such winds have been observed in a variety of environments over a range of redshifts, such as Lyman break galaxies (Pettini et al. 2001, 2002), high redshift lensed galaxies (Frye, Broadhurst and Benitez 2002) and local starburst galaxies (Heckman et al. 2000). The existence of such superbubbles that burst out of the galaxy may be a significant source of metal enrichment in the intergalactic medium (Giroux & Shull 1997; Ellison et al. 2000; Ferrara et al. 2001). The UVES data presented here, although of only slightly superior resolution than the HIRES data used by Bond et al. (2001a), reveal even more strikingly the pairwise symmetries of the absorption features, which we discuss in the context of superbubbles.
The paper is organized as follows. In §2 we describe multi-object spectroscopy of candidate galaxy counterparts, echelle spectroscopy of the QSO itself and the re-analysis of archival WFPC2 data. Determination of the redshift of galaxy G5 and a compilation of absorption line profiles are presented in §3. In §4, we discuss the connection between absorption and emission kinematics and the implication for the superbubble scenario.
We adopt km/s/Mpc, unless otherwise stated.
2 Observations and Data Reduction
Q1331+17 is a quasar well known to purveyors of absorption line systems, since it is a bright () background target with a DLA which has been widely studied in the literature (e.g., Prochaska & Wolfe 1999; Pettini et al. 1997; Lu et al. 1998). In addition, there is a lower redshift () Mg II system which has been provisionally identified with an edge-on L⋆ disk at an impact parameter of 3.86 arcsec from the QSO (Le Brun et al. 1997; Bond et al. 2001a) based on HST imaging. There is also a Mg II system at (Steidel & Sargent 1992) and a C IV system at (Sargent, Steidel & Boksenberg 1988). Finally, we have identified a new C IV system at in the UVES data presented in §2.2.
We have obtained ground-based spectroscopic observations of galaxies in the QSO field in order to confirm the absorber identification for the Mg II system and study its internal kinematics. In addition to the galaxy spectra, we have obtained high resolution spectra of the QSO to study the absorber’s metal lines and compare their kinematics with those of the associated galaxy.
2.1 Intermediate Resolution Multi-Object Spectroscopy of Galaxy Candidates
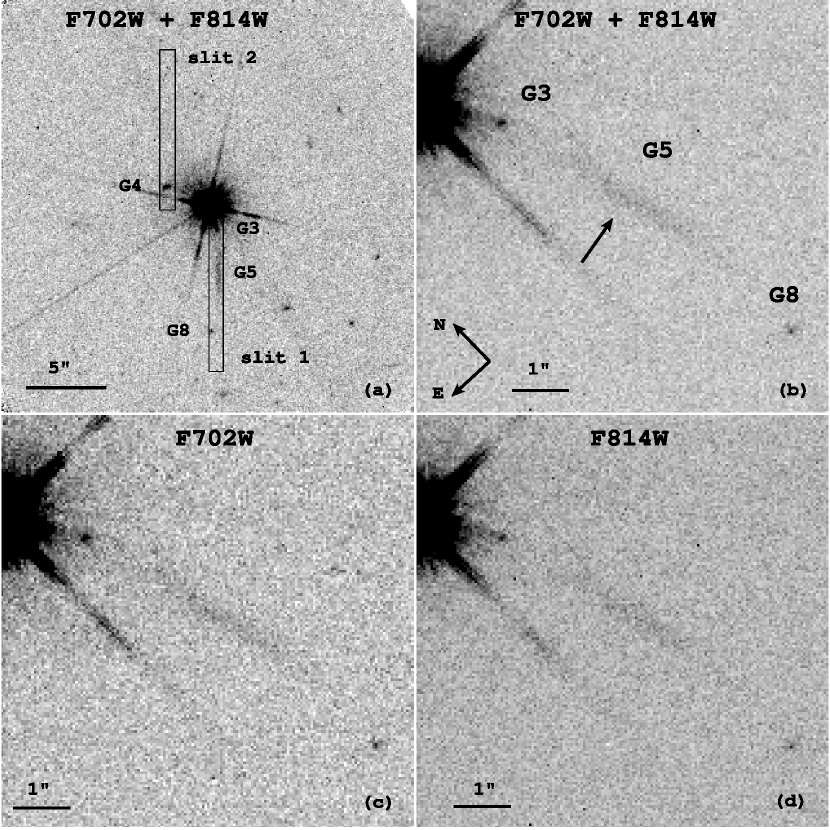
A total of 292 minutes of FORS2 service-mode spectroscopic observations were carried out on 18 May 2001, 14 June 2001, 16 June 2001, and 14 July 2001. Specifically, five 51-minute exposures and one 37-minute exposure were taken for the two slits adjacent to the QSO. Grism 600RI+19 and 1′′ slits were used, resulting in a dispersion of 1.30 Å/pix and average resolution of R1200. For slits near the QSO, the wavelength range covered was 5500-8150 Å. Figure 1a shows an outline of the two central slits on a rotated version of the HST WFPC2 archival image of the field. For consistency with earlier work, we have adopted the galaxy names used by Le Brun et al. (1997) and Bond et al. (2001a). The end of the top slit covered G4, and the bottom slit covered G3 and G5, the latter of which has been previously identified by Le Brun et al. (1997) as the preferred absorbing galaxy candidate. G5 is located 3.86 arcsecs from the QSO which translates to 28.3 kpc in our adopted cosmology. Note that the fine alignment of these two slits near the QSO was done with the aid of the WFPC image, which was re-sampled and superimposed on the FORS2 image used for mask design.
The data were reduced using IRAF222IRAF is distributed by the National Optical Astronomy Observatories, which is operated by the Association of Universities for Research in Astronomy, Inc. (AURA) under cooperative agrement with the National Science Foundation. A bias frame was first subtracted from each spectroscopic exposure. There were 1–2 pixel offsets in the object positions along the slit in different frames, as well as in the position of the slit on the CCD. To account for these shifts, the multi-slit spectra were registered so that the objects were positioned in the same pixel along the spatial direction for every frame. Subimages corresponding to individual slits were extracted and then reduced individually. Two-dimensional wavelength-calibrated spectra from each slit and exposure were created using IRAF tasks , and . The wavelength calibration was first determined based on a HeNeAr comparison spectrum, and a second-order correction around the region of interest was found by comparing the wavelength of sky lines in the spectrum with theoretical values listed in Osterbrock et al. (2000)333Sky spectrum atlas available online at http://www-mpl.sri.com/NVAO/download/Osterbrock.html. available from the VizieR database (Ochsenbein, Bauer, & Marcout 2000). Once the wavelength solution was determined, the sky lines were subtracted interactively from the raw spectra using the IRAF task . Cosmic rays were tagged on the sky-subtracted spectra using a sigma-clipping algorithm, and replaced via linear interpolation of neighbouring pixels (a necessary step before wavelength re-sampling). The sky-subtracted and cosmic-ray free spectra were re-sampled into two-dimensional wavelength-calibrated spectra, using the previously-determined wavelength solution. The individual wavelength-calibrated and sky-subtracted spectra were co-added using IRAF task with cosmic-ray pixels masked to produce the final two-dimensional spectra.
No emission lines or continuum were detected in G3 or G4, which is not surprising due to their proximity to the QSO and faint magnitudes ( and 24.47 from our re-analysis of the HST data, see section 2.3). However, G5 shows emission lines at 6505 Å and 5674 Å (see Figure 2). A faint trace of continuum from G5 is detected redwards of 6600 Å (not seen in Figure 2 due to the limited wavelength range). The identification of these lines is discussed in § 3.1 and summarized in Table 1.
2.2 High Resolution Spectroscopy of Q1331+17
Two hours of UVES observations of Q1331+17 were obtained on February 17 and 23, 2002 in service mode. The 390+564 dichroic setting was employed in order to give almost complete wavelength coverage from 3300 to 6650 Å with small gaps between the 3 CCDs. The spectra were extracted using a customised version of the UVES pipeline (Ballester et al. 2000) following the steps outlined in Ellison, Ryan and Prochaska (2001). By using a 1 arcsecond slit (aligned at the parallactic angle) combined with 22 binning, an average resolution of was achieved. Once converted to a linear vacuum heliocentric scale, the two individual exposures were combined with a weight proportional to the S/N (the two spectra were taken under slightly different seeing and moon conditions) and normalised by dividing through by a smoothed continuum. The final S/N in the combined spectrum varies between approximately 40 (per pixel) in the blue and 70 in the red.
2.3 Re-Analysis of HST WFPC2 Data
We have re-reduced the archival HST WFPC2 data of Q1331+17 to re-assess the absolute magnitude of G5 and its error estimate, since there are various (discrepant) values available in the literature. The archival WFPC2 data were obtained through the CADC and consisted of six 600s F814W images, as well as two 900s F702W images and two 600s F702W images. Individual exposures were cleaned from cosmic rays by comparing different exposures of the same mask using PPP (Yee, Ellingson & Carlberg 1996). Additional cosmic ray residuals were tagged and masked by hand. Single images in F814W and F702W were produced by co-adding the individual exposures in each filter. All images in the F814W filter were used. For the F702W filter only the last three images were co-added, since the first F702 exposure had a large number of cosmic rays covering galaxy G5. We measured the counts in a 0.8 3.2 arcsecond rectangular aperture which was centred on G5 and whose long dimension was aligned with the major axis of the object. The sky level was estimated in similar rectangular-shaped apertures placed to the east and west of G5 at the same distance from the QSO as the G5 aperture, but adjusted in width to avoid contamination by light from the QSO diffraction spikes. We also experimented with an alternative method of sky subtraction which was to rotate the image 180∘ around the QSO and then subtract it from the original image. Both methods of sky subtraction produced consistent results. In addition to G5, aperture counts were also measured for a number of galaxies in the field and converted to apparent magnitudes using the published STScI instrumental zero points. For G5, we determine (on the AB magnitude scale) and (c.f. and from Le Brun et al. 1997), where the uncertainties include both the Poissonian count statistics and an estimate of the systematics in aperture choice and sky subtraction. This is in good agreement with the magnitude of G5 derived from ground based observations ( = 23.25 Steidel, private communication), but differs by almost 2 magnitudes from the value of Le Brun et al. (1996). The magnitudes of other measured galaxies in the field are consistent with those of Le Brun et al. (1996). We applied a K-correction appropriate for an Scd galaxy (Coleman, Wu & Weedman 1980), but this has a negligible effect since the band at the redshift of G5 corresponds nearly identically to the rest-frame B-band. Therefore, converting to our adopted cosmology yields . Adopting (Efstathiou, Ellis & Peterson 1998, adjusted to our cosmology and magnitude system) this equates to compared with the value of determined (for our cosmology) from the Le Brun et al. (1997) magnitude.
3 Results
3.1 Emission Line Identification and Galaxy Confirmation
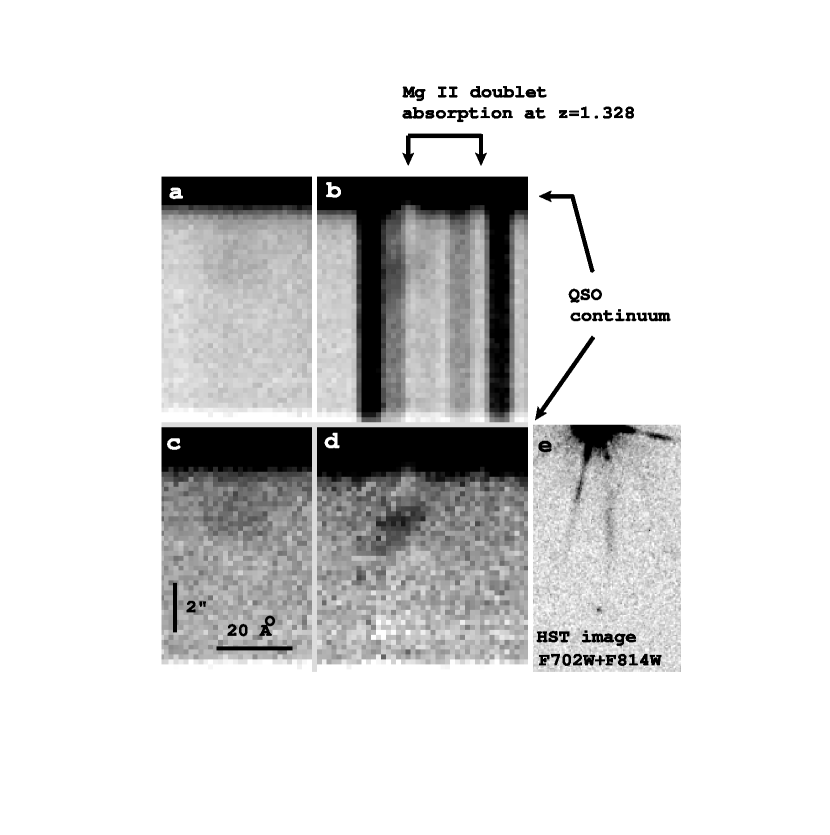
Two emission lines and a trace of faint continuum were found in the spectrum of G5 (Figures 2 and 3). There is a prominent line with a noticeable velocity gradient across the galaxy at Å (Figure 2b,d), as would be expected from a large rotating disk galaxy. A second, broader and fainter line is found at Å (Figure 2a,c). This second line is also slightly spatially displaced from the line at 6505 Å (a conservative estimate of the offset between the line centers is 2 pixels), suggestive that the two lines may not be coming from the same physical location, although the spatial offset is a marginal one. More convincingly, there is a complete lack of kinematic structure in the 5674 Å line when cross-correlated with a line template (see §3.2), whereas the 6505 Å line shows a clear rotation curve.
There are 4 previously known absorbers in the line of sight to Q1331+17 (see Le Brun et al. 1997 for a summary), therefore there are several possible galaxies which may be causing the emission lines. Furthermore, we have searched our UVES spectrum (which has extended blue coverage) for additional absorbers and identify one new C IV system at . Table 1 lists the rest-frame wavelengths that each of the two emission lines would have at the redshift of the four absorbers known in the spectrum of Q1331+170. These rest-frame wavelengths were then compared with the lists of main emission lines from nebular objects in Kinney et al. (1993) and Osterbrock (1989). We now discuss each emission line in turn and present arguments for the line identification in each case.
(a) The emission line at 6505 Å. There is a very good wavelength match for the 6505 Å line with [OII] 3727 Å at , in agreement with the galaxy identification for this system given by Le Brun et al. (1997) and Bond et al. (2001a). At the moderate resolution of our spectra (R ) we do not expect the [OII] 3727 Å doublet ( 3726.032, 3728.815 Å, ) to be resolved. However, a comparison with sky lines in the spectrum shows that this emission line has a broader profile than would be expected from a single unresolved line. A simple simulation shows that the width of the emission line at 6505 Å is in fact consistent with an unresolved [OII] 3727 Å doublet.
Coincidentally, there is a Mg II absorption system at which puts Mg II 2796 at precisely the same observed wavelength as [OII] 3727 Å at . The absorption doublet can in fact be seen in the QSO continuum in Figure 2, with the bluer component lined up with the emission line. However, there is no sign of emission at the wavelength that would correspond to the 2803 Å component of the Mg II doublet. Although the -value ratio of MgII 2796:2803 is 2:1, our spectrum is sufficiently sensitive that we would have resolved and detected the redder doublet feature were it present. Furthermore, galaxies generally show Mg II in absorption rather than emission (e.g., Kinney et al. 1993). Thus, we rule out Mg II at as the cause for the emission line (see also the discussion on the emission line at 5674 Å).
Finally, there is a near match between the He II 2733 Å line at the redshift of the z=1.374 C IV system. Interestingly, there is a second He II line, at =2390 Å that would also be a near match to the observed emission line at 5674 Å. However, there are several pieces of evidence against this identification. First, these He II lines are generally very weak, and rarely seen in local galaxy spectra (Kinney et al. 1993). Most importantly, however, the relative wavelength ratios of the helium lines do not match the observed ratios (even accounting for possible sky line contamination); since these emission lines originate from the same species, this would be a fundamental requirement for this match.
(b) The emission line at 5674 Å. In contrast to the above, there is no bright emission line expected at this wavelength for any of the redshifts of the absorbers towards this QSO. The line has a FWHM of 15 Å; which corresponds to an effective Å FWHM once the 5.2 Å instrumental profile is subtracted in quadrature. This is equivalent to km/s, and could be caused by either an unresolved multiplet, or from physical broadening of the line (e.g., from AGN activity). Although there are no obvious identifications for this emission line associated with the known intervening absorbers, there are some known fainter lines which may match. The first feasible possibility is [NeIV] 2423, 2425 Å at , which would be expected 30 Å ( km/s) blueward of the observed line. Although usually faint in galaxies, this transition can be relatively strong in some narrow line radio galaxies (McCarthy 1993). However, AGN activity is usually accompanied by other strong emission lines, such as Mg II which we had previously discounted as the identification of the 6505 Å line to the lack of a doublet feature.
The second close match is the CII] multiplet 2324–2328 Å at which would be expected 17 Å (900 km/s) to the red of the observed line. The ground state doublet CII] 2324, 2325 Å has an -value ratio that is 18:1, therefore the doublet blend is unlikely to account for the broadened line, since the emission is so faint. The excited state transition CII] 2326 is seen in some AGN (e.g., McCarthy 1993), but again we see no associated Mg II emission. Finally, as discussed above, there is a reasonable match with He II 2390, but this is also excluded (see previous paragraph). Therefore, none of these possibilities presents a very convincing case, suggesting that this emission line is associated with an object not known in absorption. Finally, it is possible that this feature might be due to an internal reflection in the spectrograph – however, the fact that it is coincident with G5, and that it is noticeably more extended than a PSF makes this an unlikely possibility.
It is, of course, plausible that the detected emission lines do not correspond to a known absorber. Given that we have argued (based on spatial and kinematic differences) that the two detected emission lines arise in different objects, an unequivocal identification of the 6505 Å line as [OII] 3727 Å is not possible. Lilly et al. (1995) explored the problems associated with redshift confirmation for single emission line objects in the CFRS and defined a break index to test for [OII] 3727 Å, effectively measuring the presence of a Balmer break. Although our spectrum is not of sufficient quality to reliably perform this test, there is a small rise in flux to the red of the emission line, suggestive of a possible break that is qualitatively similar to Figure 2 of Lilly et al. (1995). Finally we note that the other main emission lines regularly observed in moderate redshift galaxies can be confidently ruled out - H 6563 would have to be blueshifted and the [OIII]4959, 5007 doublet would be resolved in a clear 1:3 ratio. If the observed emission line at 6505 Å were H 4861, we would also have observed [OIII] 4959, 5007.
To summarise this subsection, after an exhaustive analysis of possible emission line matches, we have identified the line at 6505 Å as [OII] 3727 Å emission from G5 at the redshift of the absorber. This confirms the galaxy identification of Le Brun et al. (1997) and Bond et al. (2001a). The exact systemic redshift depends on which wavelength is taken as the central point of the rotation curve. Since our S/N is low, this is difficult to determine accurately, so we adopt for the rest of the paper. We find that the additional emission line seen at 5674 Å is not at the same redshift, but are unable to find a convincing match with any known absorption galaxy. Regardless of the identification, if we accept this line as real (rather than an artifact) it implies that the image of G5 is a superposition of a galaxy associated with the Mg II absorber, and a galaxy or AGN at a different redshift.
3.2 Internal Kinematics of G5 and the Tully-Fisher Relation
Each line of pixels in the G5 spectrum was cross-correlated with a template of the [OII] 3727 Å doublet, which was constructed by co-adding two arc lines with the separation corresponding to 3726.032, 3728.815 Å in a 1 to 1.3 ratio at a redshift of . Error bars were estimated from a simulation in which random Gaussian noise was added to each line of the spectrum 100 times, and the cross-correlation with the template was performed on each noisy spectrum. The resulting velocity points and errors are shown in Figure 4 and exhibit a linear velocity gradient (a similar test on the unidentified emission line at 5674 Å exhibits no velocity structure). While the velocities in the upper region of the emission line (above pixel 25) are reliable, the lower region lies in a part of the spectrum which originally had strong sky emission, and the observed [OII] line and its velocity are therefore suspect. In particular, the line profiles for the lower portion of the emission line are skewed towards shorter wavelengths, therefore giving a cross-correlation velocity which is likely blue-shifted from the true velocity (compare the lower portion of Figure 2d to the lower panel of Figure 4). We perform a least squares fit to the velocity points, shown as a diagonal line in Figure 4. The errors on the least squares fit yield a formal error of 32 km/s on the rotation velocity. However, in practice we are restricted to quoting a lower limit to by the low S/N at the lower end of the curve, possible contamination by sky line residuals and by the fact that we may well not be seeing out to the flat part of the rotation curve. We also note that convolution of the emission line with the seeing profile will also serve to under-estimate by blending signal from stronger emission towards the inner part of the disk at lower velocities. The straightforward interpretation of these data is that G5 is a large disk galaxy with km/s (determined from the upper portion of the emission line) and possibly as large as 350 km/s if the lower extension of the [OII] line is real.
As a second estimate of the rotation velocity, we calculate directly from the Tully-Fisher relation (e.g., Tully & Fisher 1977), based on the absolute magnitude of the galaxy, as derived from our re-appraisal of the HST data. In order to compare with published Tully-Fisher relations locally and at intermediate redshift, we convert the calculated for our preferred cosmology to those adopted by Vogt et al. (1997) and Kannappan, Fabricant & Franx (2002), i.e., = 0.05 and =75 km/s/Mpc. We further correct this value of by +0.14 mags to convert to the Vega scale and by mags following the prescription of Tully & Fouqué (1985) to correct for internal extinction for an edge-on galaxy. The resulting magnitude after these corrections is .
We derive the expected velocity for a galaxy of this magnitude using the Tully-Fisher relation from Kannappan, Fabricant & Franx (2002) (KFF). We calculate the maximum rotation velocity by taking the unweighted inverse fit from Table 1 of KFF , where is the 50% HI 21-cm linewidth. The linewidth is related to the rotation velocity by with scatter 25 km/s (KFF appendix B). Using our value for G5, we obtain km/s, and km/s. In order to reproduce the observed (minimum) rotation velocity of km/s, the same relationship from KFF yields an absolute -band magnitude of , i.e., 1.26 magnitudes brighter than the value that we measure (once the edge-on dust correction of Tully & Fouqué 1985 is made). If the lower extension to the rotation curve is real, then the rotation velocity could be as large as 350 km/s, which would imply , i.e., require an additional 3.4 magnitudes of extinction after the edge-on correction in order to match the Tully-Fisher relation. Therefore, there is a significant discrepancy between our measured luminosity and rotation curve with the local Tully-Fisher relation, which would be further exacerbated by including the lower extension of the emission line.
There is still considerable debate over the possible evolution of the Tully-Fisher relation at . Vogt et al. (1996, 1997) found that out to there is relatively little evolution ( mag brightening) for large disk galaxies to z1, consistent with the HST WFPC2 morphological study of Lilly et al., (1998). Other groups, however, have found significant luminosity evolution in small, blue galaxies (e.g., Phillips et al. 1997, Rix et al. 1997, Simard & Pritchet 1998, Mallén-Ornelas et al. 1999), and even in large spirals (e.g., Rigopoulou et al. 2002). Ziegler et al. (2002) have suggested that the extent of luminosity evolution depends on rotation velocity with significant corrections required for galaxies with km/s. Despite this still murky picture, we can nonetheless make a clear statement about the case of G5. All suggestions of evolution in the Tully-Fisher relation advocate brightening (for a given ) at higher redshifts; if present this would further increase the discrepancy between our measured luminosity, and that predicted by the Tully-Fisher relation for our measured .
3.3 Absorption Line Profiles
In order to determine column densities for the metal species, we have used the Voigt profile fitting program VPFIT444Available at http://www.ast.cam.ac.uk/~rfc/vpfit.html to determine column densities for the individual absorption components. We have adopted the common strategy of tying Doppler widths (-values) and redshifts of components for different species and obtain good simultaneous fits for Mg I, Mg II and Fe II indicating that these species occupy the same velocity space. Fit parameters are given in Table 2 and we note that since several of the Mg II components are mildly saturated, we quote the total N(Mg II) as a lower limit. In principle, HST spectra are required in order to determine the N(H I) of this system. However, in practice, the Lyman limit of the higher redshift DLA prevents us from measuring the Ly absorption in the lower redshift system. However, as discussed by Bond et al. (2001a), although the Mg II 2796 and Fe II 2600 equivalent widths (EW) in this absorber give a 50% probability that this is a DLA (Rao & Turnshek 2000), the absence of extended Mg II saturation would be unusual for a bona fide damped system. Due to the lack of N(H I) constraint, we are unable to determine abundances for this absorber. However, we return to the issue of relative column densities below.
The absorption profiles of this system are extended over approximately 300 km/s. We adopt the systemic absorption redshift to be the same as that determined for the [OII] 3727 Å emission line, i.e., . Figure 5 shows the Mg II and Fe II lines covered by the UVES data. The slightly higher resolution of the UVES data compared with the HIRES spectra of Bond et al. (2001a) reveals even more striking symmetries in the absorption features. However, the clearest examples are now not the pairs that are separated by km/s, but those with much larger velocity differences e.g., the strongest components at km/s and km/s.
In Figure 6 we illustrate qualitatively some of these symmetries with the Mg II 2803 transition. The top panel shows the spectrum on both a velocity scale relative to and also shifted by 150 km/s to the blue demonstrating the keen similarities in terms of velocities between components 6 – 10 and 13 – 17, as marked by the horizontal bar. The middle panel shows the spectrum both relative to and also flipped in velocity space to illustrate the ‘mirror’ symmetries. Notice how the pairs of lines at km/s (components 6, 7 & 8 compared with 13, 14 & 15) overlap, including the broadening towards zero velocity. The bottom panel illustrates another example of such a mirror symmetry, this time between components 9 and 10 compared with 16 and 17. With a single line of sight, we are not able to further constrain the possible geometry of this system (c.f. Rauch et al. 2002), but since patterns of this sort may be expected if the line of sight intersects an expanding shell, we speculate that the components 6 – 17 may arise as a consequence of bubbles (see also Bond et al. 2001a).
We can, however, assess whether the observed symmetries could plausibly arise by chance due to a random placement of lines by using the Two Point Correlation Function (TPCF) and Column Density Distribution Function (CDDF) for Mg II systems from Churchill, Vogt & Charlton (2002). The TPCF quantifies the probability of finding 2 absorption components with a separation V and is parameterised by a double Gaussian of the form
| (1) |
From their large sample of Mg II systems, Churchill, Vogt & Charlton (2002) have determined = 54 km/s and = 166 km/s. The CDDF describes the number of components with a given column density and is a power law of the form
| (2) |
with for Mg II components. By combining the TPCF and the CDDF we can assess the probability that two pairs of components in a given system will have the same V and matching column densities, within some tolerance (we make no distinction between ‘shifted’ symmetries and ‘mirror’ symmetries in these calculations). We produce 10000 realizations of 2 pairs of Mg II lines and apply a relatively relaxed tolerance that V 10 km/s and logN 0.3 dex 555The symmetries we observe actually match somewhat better than this, see Table 2. However, the errors on the individual component column densities can be several tenths of a dex, hence our conservative tolerances.. The results are shown in Figure 7. In the top panel, we plot the fraction of pairs that have the same V, as a function of V. Since small values of V are more probable, this fraction is larger for smaller velocity separations. In the middle panel, we plot the fraction of pairs which have matching V and logN, again as a function of V. The typical V between components of the symmetric pairs observed in Q1331+17 is 15 km/s, so the results of these simulations (Figure 7, middle panel) would imply that in a few percent of cases we may expect to find one set of matching pairs. However, this is a strong function of column density; since the CDDF is a power law with negative slope, high column density components are intrinsically rarer and therefore matches that include a high column density component will also be rare. Indeed, several of the symmetric components in Q1331+17 have relatively large column densities, log N(MgII)12.7. In the bottom panel of Figure 7 we have plotted a histogram showing the absolute number of matches (for 10000 realizations) as a function of column density. Clearly, matched components with moderately large N(Mg II) should be extremely rare. Moreover, these simulations only consider matches between two pairs of lines whereas in the spectrum of Q1331+17, we see multiple pairings, sometimes with more than two components. While the probability of chance pairing of two lines is, as shown by our simulations, already small, the pairing of whole line complexes is even more unlikely; its probability can be approximated by the probability of the pairing of N individual line pairs, and therefore decreases quadratically compared to the already small probability of chance pairings of individual lines. Therefore, the likelihood of observing symmetries such as those seen in this Mg II system are vanishingly small (0.02%).
4 Discussion
4.1 Galaxy Association and Kinematics
Steidel et al. (2002) have recently studied the absorption and emission kinematics of 5 Mg II absorbers associated with inclined disks. They find that 4/5 of these systems are consistent with absorbing gas that is co-rotating with the main galactic disk (although the profiles are not consistent with pure disk rotation). In the Mg II absorber towards Q1331+17, we find that the absorption components fall approximately central to the systemic redshift of the emission line, but with a large spread ( 100 km/s) to either side (Figure 4). Although Steidel et al. (2002) find one example of absorption gas located at the centre of the rotation curve, the velocity spread of the absorption components is very small. Whilst we do not detect the turnover of the rotation curve (and even with the conservative assumption that the curve flattens beyond the limit of the detected rotation) it is clear from Figure 4 that there is no absorption at the extrapolated disk rotation velocity determined for G5. In fact, Figure 4 implies that if all of the absorbing gas were associated with a disk, then a significant amount would have to be at counter-rotating velocities. Interestingly, Lanzetta et al. (1997) have reported a similar incidence of counter-rotating gas in a Lyman limit system associated with a 0.4 spiral inclined at .
Although several examples of counter-rotation between stars and gas have been studied in the local universe (e.g., Galletta 1987; Bertola, Buson & Zeilinger 1992; Ciri, Bettoni & Galletta 1995; Jore et al. 1996; Rubin, Graham & Kenney 1992), kinematic de-coupling remains a relatively rare phenomenon among spirals (Kannappan & Fabricant 2002). Given the even higher scarcity of outer disk vs. inner disk gas decoupling (e.g., Braun, Walterbos, Kennicutt 1992), it would be extremely surprising that two (Q1331+17 and Q0850+44, Lanzetta et al. 1997) out of 8 (i.e., including the 5 additional systems from Steidel et al. 2002 and the system of Barcons et al. 1995) galaxy absorbers need to appeal to this explanation. A more likely explanation in the case of the Mg II absorber towards Q1331+17 is that internal non-disk kinematics play a dominant role, consistent with the scenario of bubbles or winds. Alternatively, the absorption could be associated with a companion to G5 (i.e., at the same redshift) which would make its relative velocity entirely independent of G5’s rotation curve. Zaritsky et al. (1997) have shown that the velocity distribution between local spirals and their satellites extends to several hundred km/s, although most are within 200 km/s (but mostly along the disk’s minor axis). Lanzetta et al. (1997) also raise the possibility that a faint nearby galaxy could be causing the absorption in the case of Q0850+44. Their argument is further supported by the absorber’s very low metallicity (), which is much lower than would normally be expected for a 0.4 based on the metallicity-luminosity relation (Kobulnicky & Zaritsky 1999). Unfortunately, due to the impossibility of an N(H I) measurement for the absorber in Q1331+17, we can not make a similar comparison for the Mg II system studied here.
Although G5 is fainter than the typical Mg II galaxy (Steidel, Persson & Dickinson 1994), its luminosity and impact parameter are consistent with the gas cross section relation derived by Steidel (1995), . Whilst the correlation between Mg II equivalent width and luminosity is weak (Churchill et al. 2000b), it is nonetheless striking that the absorber towards Q1331+17 is one of the strongest compared with the sample of Churchill et al. (2000a), yet it is at the faint end of the luminosity distribution. This could be a further symptom of superbubbles which would increase the density of local gas and consequently increase the N(Mg II) for a given metallicity. This possibility could be tested by identifying the absorbing galaxies associated with other potential superbubble Mg II candidates presented in Bond et al. (2001b).
A re-assessment of the archival WFPC2 imaging has led to a significant downward revision of G5’s luminosity to . Compared with the rotation velocity of km/s, this is inconsistent with the Tully-Fisher relation, both locally and at higher redshifts. We can speculate upon various possibilities that would reconcile this inconsistency. The identification of a second emission line, indicates that a second galaxy is present coincident (at least to some degree) with G5. Although the S/N of G5 in the WFPC2 image is low, there is evidence for a faint ‘kink’, see Figure 1b. This will undoubtedly affect the luminosity of G5, although it would lead to an even fainter absolute magnitude. Therefore, appealing to luminosity evolution (§3.2) or blending with another coincident object only exacerbate the Tully-Fisher discrepancy. It is possible that our internal extinction correction may be inaccurate and large amounts of dust are known to exist both in and above the plane of disk galaxies (e.g., Howk & Savage 1999). However, the total extinction correction required to reconcile the luminosity with the Tully-Fisher relation is approximately 3 times the maximum given by Tully & Fouqué (1985), more if the true rotation velocity is significantly larger than our current lower limit of 210 km/s. We also note that none of the 5 galaxies studied by Steidel et al. (2002) exhibit such a discrepancy with the Tully-Fisher relation. It is also possible that G5 truly lies a long way from the classical Tully-Fisher relation. For example, there is some evidence that low surface brightness (LSB) galaxies deviate from the classical Tully-Fisher relation in the sense that some are apparently under-luminous for the rotation velocities, e.g., O’Neil et al. (2001). However, more recent work suggests that the majority of discrepant points may suffer from H I contamination from nearby galaxies (Chung et al. 2002). Our interpretation of superbubbles (see discussion in the next section) signals active physical processes such as intense star formation or even merging which may impact significantly on the relation between luminosity and rotation velocity. Intense bursts of star formation will make a galaxy even brighter for a given , again exacerbating the Tully-Fisher discrepancy we observe, although the global effects on the Tully-Fisher relation of merging or starburst galaxies are unknown. Unfortunately, these data are not of sufficient quality to determine a star formation rate with a meaningful accuracy that would allow us to explore these possibilities in any quantative detail. Finally, it is important to stress again that G5 is a faint galaxy with weak emission lines, so measurement errors are relatively large. Similarly, the Tully-Fisher exhibits a significant scatter. As calculated above, the absolute -band magnitude error would have to be under-estimated by a factor of 6, but the large error on the rotation velocity places it within a 1 scatter from the Tully-Fisher relation of Kannappan, Fabricant & Franx (2002).
4.2 On The Presence of Superbubbles
The pair-wise absorption pattern noted by Bond et al. (2001a) is even more striking in the UVES data presented here (see Figures 5 and 6) and is indeed reminiscent of the expected signature of expanding gas shells. Whereas Bond et al. focussed on line pair separations of 30 km/s, the UVES data show even more striking symmetries between components with km/s, such as between components 6, 7 & 8 with components 13, 14 & 15. It is interesting to note that several local cases of absorption in QSOs behind readily identifiable galaxies may be associated with disturbed gas, including bubbles, shells and mergers (e.g., Norman et al. 1996; Womble, Junkkarinen & Burbidge 1992 and references therein). Bond et al. (2001a) used CLOUDY models to infer the energetics of the starburst that may be driving the bubble and the implied metallicity of the gas. These models place limits on the energy injected into the bubble and its age, assuming a metallicity and an empirically motivated range of column densities and shell thicknesses. With a larger by a factor of 5 than those studied by Bond et al. (2001a), these models would be shifted to energies some 300 times larger for a given age (see Bond et al. 2001a for the formalism of these calculations). The combined effect of metallicity and starburst luminosity governs the shell thickness and observed Mg II column density. Extrapolation of the models in Bond et al. (2001a) implies total luminosities of between 1 – 10 ergs cm-3 corresponding to an OB association of some 500 – 5000 stars, and a metallicity of 1/10 solar. Given that this upper limit is similar to the largest OB associations seen at (e.g. McKee & Williams 1997), this implies that lower metallicities are unlikely. Higher metallicities could be reproduced by proportionately lower energies.
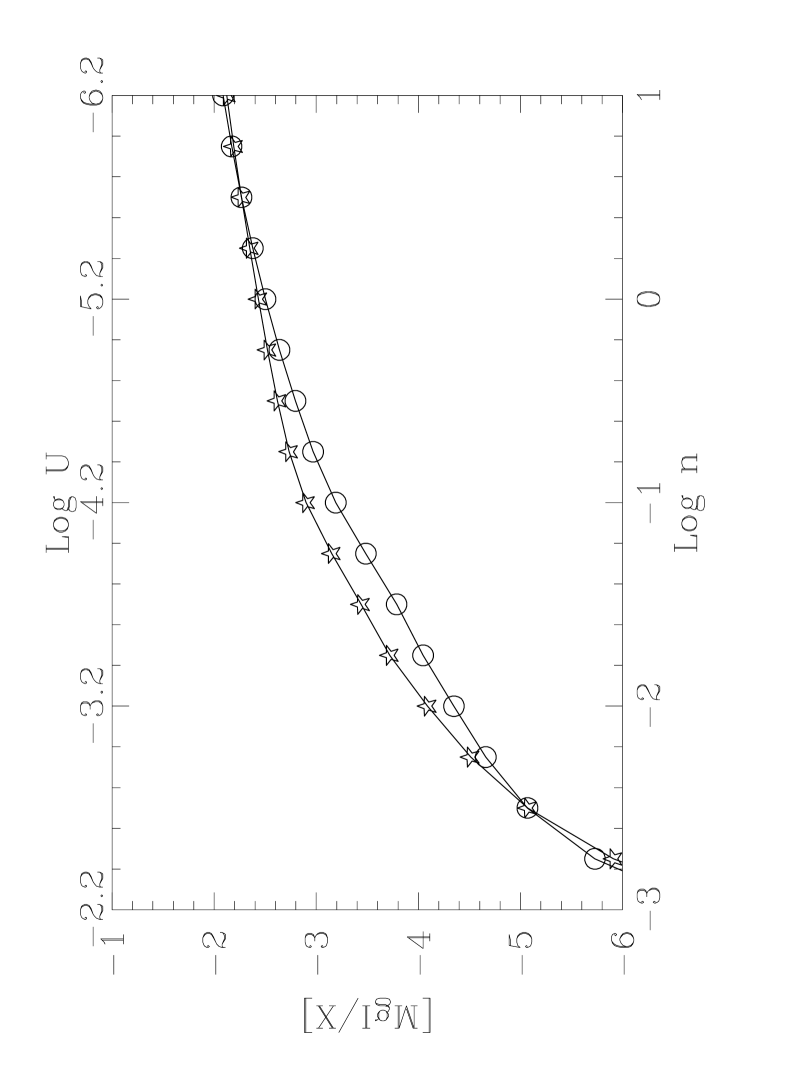
The ratios of Mg I/Fe II and Mg I/Mg II contain information pertaining to the ionization state (and hence, density) of the gas and may provide clues to the nature of the absorption. In Figure 8 we plot the component by component Mg I/Fe II and Mg I/Mg II ratios (along with the velocity-scaled absorption profiles to guide the eye). Ideally, we would like to compare N(Mg I)/N(Mg II) and indeed there is an interesting trend that the components that exhibit the symmetries described above (i.e., those components we have tentatively identified as arising in bubble shells) generally have higher N(Mg I)/N(Mg II). Although Churchill, Vogt & Charlton (2002) have recently shown that N(Mg I)/N(Mg II) correlates with N(Mg II), the distribution of N(Mg I)/N(Mg II) in Figure 8 is independent of this relation. However, since many of the Mg II components are partially saturated, these ratios are often upper limits. The ratio of N(Mg I)/N(Fe II) is unaffected (in this case) by saturation, although we have no a priori knowledge that the Mg/Fe ratio is identical in every component (e.g., Ledoux, Bergeron & Petitjean 2002; Ellison 2000) there is recent evidence that the abundance ratios, at least in DLAs, show remarkable uniformity (Prochaska 2003; Churchill et al. 2003). Nonetheless, the N(Mg I)/N(Fe II) is almost universally higher in the components proposed to be bubbles, indicative of large densities. Column densities of highly ionized species such as C IV would help to constrain the ionization parameter, however the only existing HST spectra of Q1331+17 are of very poor quality (Bechtold, private communication). Rauch et al. (2002) find similarly high ratios of N(Mg I)/N(Mg II) and N(Mg I)/N(Fe II) in an absorber at which they have interpreted as due to superbubbles. In addition, similar column density ratios of these species have been found in low redshift Mg II absorbers known to be undergoing strong galaxy-galaxy interactions (Norman et al. 1996). In Figure 9 we present representative CLOUDY94 (Ferland et al. 1998) models of N(Mg I)/N(Mg II) and N(Mg I)/N(Fe II) to illustrate that large values of this ratio are indicative of high densities. However, modelling the precise density of absorbers depends on the N(H I) which is unknown for this system. Moreover, given that the bubbles may consist of shocked gas that is not in thermal equilibrium and that the effective ionizing radiation spectrum is unknown, precise modelling of relative abundances is outside the scope of this paper.
We conclude that, although the nature of this absorber can never be unequivocally determined solely from its absorption properties, the double-peaked profile of the redward components, their striking symmetries and high N(Mg I)/N(Mg II) and N(Mg I)/N(Fe II) ratios and large Mg II equivalent width support the interpretation of superbubbles put forward by Bond et al. (2001a), but the larger velocity separations investigated here imply larger energies and enriched gas.
5 Summary
We have presented complementary quasar absorption line spectra and spatially resolved emission line data for a candidate Mg II absorbing galaxy at . Our main conclusions are:
-
1.
We have obtained a spectroscopic redshift for galaxy G5 based on the detection of the [OII] 3727 line. The galaxy, located at 3.86 arcsec (28.3 kpc) from QSO Q1331+17, is at a redshift . There is a second unidentified emission line which does not match any expected line at or for any other of the known QSO absorption systems. In combination with its distinct spatial profile, this indicates a second object, at a different redshift is (at least partially) coincident with G5.
-
2.
A re-analysis of archival HST data leads us to determine an absolute luminosity for this galaxy. If G5 is an edge-on disk, our detection of [OII] 3727 indicates a rotation velocity of 210 km/s. This is inconsistent with the established Tully-Fisher relation both locally and at intermediate redshifts.
-
3.
The QSO absorption is aligned with the center of the emission line, i.e., at . There is no absorbing gas at the extension of the rotation curve, but there is a significant amount at negative velocities. We suggest that this is most likely explained due to internal motions, such as winds or bubbles which may be associated either with non-disk component of G5 or an as yet unidentified companion.
-
4.
The double-peaked absorption profiles, striking symmetries and large N(MgI)/N(MgII) and N(MgI)/N(FeII) ratios are indicative of expanding superbubbles. This is consistent with observations at low redshift which find that extended absorption halos are often associated with disrupted gas, for example in shells, mergers or interactions. Superbubbles may also explain why the absorber towards Q1331+17 has a relatively large Mg II equivalent width relative to the luminosity of its absorbing galaxy. The OB association driving the bubble may have a total energy of 1 – 10 ergs cm -3 and contain as many stars as the largest seen at the present day. This indicates that the gas has been enriched to at least 1/10 solar metallicity.
References
- Ballester et al. (2000) Ballester, P., Modigliani, A., Boitquin, O., Cristiani, S., Hanuschik, R., Kaufer, A., Wolf, S., 2000, ESO Messenger, 101, 31
- Barcons, Lanzetta & Webb (1995) Barcons, X., Lanzetta, K., & Webb, J. K., 1995, Nature, 376, 321
- Bertola, Buson & Zeilinger (1992) Bertola, F., Buson, L. M. & Zeilinger, W. W., 1992, ApJ, 401, L79
- Bond et al. (2001) Bond, N., Churchill, C., Charlton, J., Vogt, S., 2001a, ApJ, 557, 761
- Bond et al. (2001) Bond, N., Churchill, C., Charlton, J., Vogt, S., 2001b, ApJ, 562, 641
- Bowen, Tripp & Jenkins (2001) Bowen, D., Tripp, T., & Jenkins, E., 2001, AJ, 121, 1456
- Braun, Walterbos & Kennicutt (1992) Braun, R., Walterbos, R., & Kennicutt, R., 1992, Nature, 360, 442
- Charlton & Churchill (1998) Charlton, J., & Churchill, C., 1998, ApJ, 499, 181
- Charlton & Churchill (1996) Charlton, J., & Churchill, C., 1996, ApJ, 465, 631
- Chung et al. (2002) Chung, A., van Gorkom, J., O’Neil, K., Bothun, G., 2002 AJ, 123, 2387
- Churchill et al. (2000a) Churchill, C. W., Mellon, R. R., Charlton, J. C., Jannuzi, B. T., Kirhakos, S., Steidel, C. C., Schneider, D. P., 2001a, ApJS, 130, 91
- Churchill et al. (2000b) Churchill, C. W., Mellon, R. R., Charlton, J. C., Jannuzi, B. T., Kirhakos, S., Steidel, C. C., Schneider, D. P., 2001b, ApJ, 543, 577
- Churchill et al. (2003) Churchill, C. W., Mellon, R. R., Charlton, J. C., Vogt, S., 2003, ApJ, submitted, astro-ph/0212120
- Churchill, Vogt & Charlton (2002) Churchill, C., Vogt, S., & Charlton, J., 2002, ApJ, accepted, astro-ph/0210196.
- Churchill, Vogt & Steidel (1995) Churchill, C. W., Vogt, S., & Steidel, C., 1995, QSO Absorption Lines, Proceedings of the ESO Workshop, page 153.
- Ciri, Bettoni & Galletta (1995) Ciri, R., Bettoni, D., & Galletta, G., 1995, Nature, 375, 661
- Coleman, Wu, & Weedman (1980) Coleman, G.D., Wu, C.-C. & Weedman, D.W. 1980, ApJS, 43, 393
- Efstathiou, Ellis, & Peterson (1998) Efstathiou, G., Ellis, R. S., & Peterson, B. A. 1988, MNRAS, 232, 431
- Ellison (2000) Ellison, S. L., 2000, PhD thesis, University of Cambridge.
- Ellison, Ryan & Prochaska (2001) Ellison, S. L., Ryan, S. & Prochaska, J. X., 2001, MNRAS, 326, 628
- Ellison et al. (2000) Ellison, S. L., Songaila, A., Schaye, J., Pettini, M., 2000 AJ, 120, 1175
- Ferland et al. (1998) Ferland, G., Korista, K., Verner, D., Ferguson, J., Kingdon, J., Verner, E., 1998, PASP, 110, 761
- Ferrara, Pettini & Shchekinov (2000) Ferrara, A., Pettini, M., & Shchekinov, Y., 2000, MNRAS, 319, 539
- Frye, Broadhurst & Benitez (2002) Frye, B., Broadhurst, T., & Benitez, N., 2002, ApJ, 568, 558
- Galletta (1987) Galletta, G., 1987, ApJ, 318, 531
- Giroux & Shull (1997) Giroux, M., & Shull, J., 1997, AJ, 113, 1505
- Guzman et al. (1997) Guzman, R., Gallego, J., Koo, D. C., Phillips, A. C., Lowenthal, J. D., Faber, S. M., Illingworth, G. D., & Vogt, N. P. 1997, ApJ, 489, 559
- Haehnelt, Steinmetz and Rauch (1998) Haehnelt, M. G., Steinmetz, M., & Rauch, M. 1998, ApJ, 495, 647
- Heckman et al. (2000) Heckman, T., Lehnert, M., Strickland, D., Armus, L., 2000, ApJS, 129, 493
- Howk & Sembach (1999) Howk, J. C., & Sembach, K., 1999, AJ, 117, 2077
- Jimenez et al. (1999) Jimenez, R., Bowen, D.V., & Matteucci, F. 1999, ApJ, 514, L83
- Jore et al. (1996) Jore, K. P., Broeils, A. H., Haynes, M. P., 1996, AJ, 112, 438
- Kannappan & Fabricant (2001) Kannappan, S. J. & Fabricant, D. G. 2001, AJ, 121, 140
- Kannappan, Fabricant, & Franx (2002) Kannappan, S. J., Fabricant, D. G., & Franx, M. 2002, AJ, 123, 2358
- Kinney et al. (1993) Kinney, A. L., Bohlin, R. C., Calzetti, D., Panagia, N., & Wyse, R. F. G. 1993, ApJS, 86, 5
- Kobulnicky and Zaritsky (1999) Kobulnicky, H.A., & Zaritsky, D. 1999, ApJ, 511, 118
- Lanzetta & Bowen (1992) Lanzetta, K., & Bowen, D., 1992, ApJ, 391, L48
- Lanzetta et al. (1997) Lanzetta, K., Wolfe, A., Altan, H., Barcons, X., Chen, H.-W., Fernandez-Soto, A., Meyer, D., Ortiz-Gil, A., Savaglio, S., Webb, J., Yahata, N., 1997, AJ, 114, 1337
- Le Brun et al. (1997) Le Brun, V., Bergeron, J., Boisse, P., & Deharveng, J. M. 1997, A&A, 321, 733
- Ledoux, Bergeron & Petitjean (2002) Ledoux, C., Bergeron J., & Petitjean, P., 2002, A&A, 305, 802
- Lilly et al. (1995) Lilly, S., Hammer, F., Le Fevre, O., Crampton, D., 1995, ApJ, 455, 75
- Lilly et al. (1998) Lilly, S., Schade, D., Ellis, R., et al. 1998, ApJ, 500, L75
- Mallén-Ornelas et al (1999) Mallén-Ornelas, G., Lilly, S. J., Crampton, D., & Schade, D. 1999, ApJ, 518, L83
- McCarthy (1993) McCarthy, P., 1993, ARA&A, 31, 639
- McKee & Williams (1997) McKee, C. F., & Williams, J. P., 1997, ApJ, 476, 144
- Nestor et al. (2001) Nestor, D., Rao, S., Turnshek, D., Monier, E., Lane, W., Bergeron, J., to appear in ASP Conference Series ‘Extragalactic Gas at Low Redshift’, J. Mulchaey and J. Stocke, eds, astro-ph/0108146
- Norman et al. (1996) Norman, C., Bowen, D., Heckman, T., Blades, C., Danly, L., 1996, ApJ, 472, 73
- Nulsen, Barcons & Fabian (1998) Nulsen, P. E. J., Barcons, X., Fabian, A. C., 1998, MNRAS, 301, 168
- Ochsenbein, Bauer, & Marcout (2000) Ochsenbein, F., Bauer, P., & Marcout, J. 2000, A&AS, 143, 23
- O’Neil et al. (2001) O’Neil, K., Bothun, G., Schombert, J., Cornell, M., Impey, C., 2001, AJ, 119, 136
- Osterbrock (1989) Osterbrock, D. E., 1989, Astrophysics of Gaseous Nebulae, University Science Books.
- Osterbrock et al. (2000) Osterbrock, D. E., Fulbright, J. P., Martel, A. R., Keane, M. J., Trager, S. C., & Basri, G. 2000, VizieR Online Data Catalog, 3211
- Pettini et al. (2002) Pettini, M., Rix, S., Steidel, C., Adelberger, K., Hunt, M., Shapley, A., 2002, ApJ, 569, 742
- Pettini et al. (2001) Pettini, M., Shapley, A., Steidel, C., Cuby, J.-G., Dickinson, M., Moorwood, A., Adelberger, K., Giavalisco, M., 2001, ApJ, 554, 981
- Phillips et al. (1997) Phillips, A. C., Guzman, R., Gallego, J., Koo, D. C., Lowenthal, J. D., Vogt, N. P., Faber, S. M., & Illingworth, G. D. 1997, ApJ, 489, 543
- Pierce & Tully (1992) Pierce, M. J., Tully, R. B. 1992, ApJ, 387, 47
- Prochaska (2003) Prochaska, J. X., 2003, ApJ, 582, 49
- Prochaska and Wolfe (1997) Prochaska, J. X., & Wolfe, A. M. 1997, ApJ, 487, 73
- Prochaska and Wolfe (1999) Prochaska, J.X., & Wolfe, A.M. 1999, ApJS, 121, 369
- Rauch et al. (2002) Rauch, M., Sargent, W. L. W., Barlow, T. A., Simcoe, R. A., 2002, ApJ, 576, 45
- Rigopoulou et al. (2002) Rigopoulou, D., Franceschini, A., Aussel, H., Genzel, R., Thatte, H., Cesarsky, C., 2002, ApJ, 580, 789
- Rix et al (1997) Rix, H., Guhathakurta, P., Colless, M., & Ing, K. 1997, MNRAS, 285, 779
- Rosenberg & Schneider (2002) Rosenberg, J., & Schneider, S., ApJ, 567, 247
- Rubin, Graham & Kenney (1992) Rubin, V., Graham, J. A., & Kenney, J. D., 1992, ApJ, 394, L9
- Sargent, Steidel, & Boksenberg (1988) Sargent, W. L. W., Steidel, C. C., & Boksenberg, A. 1988, ApJS, 68, 539
- Schaye (2001) Schaye, J., 2001, ApJL, 559, L1
- Simard & Pritchet (1998) Simard, L., & Pritchet, C., 1998, ApJ, 505, 96
- Steidel, Dickinson & Persson (1994) Steidel, C. C., Dickinson, M., & Persson, E., 1994, ApJ, 437, L35
- Steidel & Sargent (1992) Steidel, C. C. & Sargent, W. L. W. 1992, ApJS, 80, 1
- Steidel (1995) Steidel, C. C., 1995, ‘QSO Absorption Lines’, ESO Workshop, Ed. Meylan, 139.
- Steidel et al. (1997) Steidel, C. C., Dickinson, M., Meyer, D. M., Adelberger, K., Sembach, K., 1997, ApJ, 480, 568
- Steidel et al. (2002) Steidel, C. C., Kollmeier, J. A., Shapley, A. E., Churchill, C., Dickinson, M., Pettini, M., 2002, ApJ, 570, 526
- Turnshek et al. (2001) Turnshek, D., Rao, S., Nestor, D., Lane, W., Monier, E., Bergeron, J., Smette, A., 2001, ApJ, 553, 288
- Tully & Fisher (1977) Tully, R. B., Fisher, J. R., 1977, A&A, 54, 661
- Tully & Fouqué (1985) Tully, R. B., Fouqué, P., 1985, ApJS, 58, 67
- Vogt et al. (1996) Vogt, N. P., Forbes, D. A., Phillips, A. C., Gronwall, C., Faber, S. M., Illingworth, G. D., & Koo, D. C. 1996, ApJ, 465, L15
- Vogt et al. (1997) Vogt, N. P., Phillips, A. C., Faber, S. M., Gallego, J., Gronwall, C., Guzman, R., Illingworth, G. D., Koo, D. C., Lowenthal, J. D., 1997, ApJ, 479, L121
- Womble, Junkkarinen & Burbidge (1992) Womble, D., Junkkarinen, V., & Burbidge, M., 1992, ApJ, 388, 55
- Yee, Ellingson & Carlberg (1996) Yee, H. K. C., Ellingson, E. & Carlberg, R. G. 1996, ApJS, 102, 289
- Zaritsky et al. (1997) Zaritsky, D., Smith, R., Frenk, C., White, S. D. M., 1997 ApJ, 478, 39
- Ziegler et al. (2002) Ziegler, B. L. et al. 2002, ApJ, 564, L69
| Absorption | z | range | 6505 Å line | 5674 Å line | ||
|---|---|---|---|---|---|---|
| System | (Å) | (Å) | Possible matches | (Å) | Possible matches | |
| Mg II | 0.745 | 3153–4655 | 3729 | [OII] 3727 | 3253 | |
| Mg II | 1.328 | 2362–3487 | 2794 | MgII 2796, 2803 | 2437 | [NeIV] 2423, 2425 |
| C IV | 1.374 | 2317–3421 | 2740 | HeII 2733 | 2390 | HeII 2385 |
| C IV | 1.446 | 2248–3319 | 2659 | 2320 | CII] 2324–2328 | |
| DLA | 1.776 | 1981–2925 | 2343 | 2044 | ||
| Cloud | Redshift | Velocity | Log10 N(X) | |||
|---|---|---|---|---|---|---|
| km/s | km/s | Mg II | Fe II | Mg I | ||
| 1 | 0.74385 | 197 | 11.0 | 12.11 | … | … |
| 2 | 0.74395 | 181 | 3.1 | 13.17 | 12.62 | 10.61 |
| 3 | 0.74400 | 173 | 5.0 | 12.85 | 12.32 | 10.52 |
| 4 | 0.74413 | 149 | 4.6 | 13.30 | 12.66 | 10.41 |
| 5 | 0.74425 | 130 | 4.1 | 12.67 | 12.20 | 10.12 |
| 6 | 0.74439 | 105 | 7.1 | 13.00 | 12.51 | 10.31 |
| 7 | 0.74446 | 93 | 3.1 | 12.91 | 12.36 | 11.08 |
| 8 | 0.74451 | 84 | 4.6 | 12.70 | 12.26 | 10.93 |
| 9 | 0.74462 | 66 | 3.6 | 14.08 | 13.29 | 11.84 |
| 10 | 0.74467 | 57 | 10.2 | 13.01 | 12.62 | 10.43 |
| 11 | 0.74487 | 22 | 4.4 | 12.03 | 11.76 | 10.19 |
| 12 | 0.74501 | 2 | 4.0 | 12.21 | 11.88 | 10.50 |
| 13 | 0.74522 | 46 | 16.8 | 12.67 | 12.32 | 10.98 |
| 14 | 0.74527 | 37 | 10.2 | 12.94 | 12.51 | 10.65 |
| 15 | 0.74536 | 61 | 5.2 | 13.08 | 12.45 | 11.04 |
| 16 | 0.74550 | 86 | 11.5 | 13.20 | 12.81 | 11.15 |
| 17 | 0.74556 | 95 | 2.4 | 14.07 | 13.02 | 11.24 |
| Total system N(X) | 14.56 | 13.84 | 12.22 | |||