White Dwarf Sequences in Dense Star Clusters
Abstract
We use the results of realistic -body simulations to investigate the appearance of the white dwarf population in dense star clusters. We show that the presence of a substantial binary population in a star cluster, and the interaction of this population with the cluster environment, has serious consequences for the morphology of the observed white dwarf sequence and the derived white dwarf cooling age of the cluster. We find that over time the dynamical evolution of the cluster – mass-segregation, stellar interactions and tidal stripping – hampers the use of white dwarfs as tracers of the initial mass function, and also leads to a significant enhancement of the white dwarf mass fraction. Future observations of star clusters should be conducted slightly interior to the half-mass radius of the cluster in order to best obtain information about the cluster age and initial mass function from the white dwarf luminosity function. The evolution of binary stars and the cluster environment must necessarily be accounted for when studying the white dwarf populations of dynamically evolved star clusters.
1 Introduction
The technique of using the white dwarf (WD) sequence in the colour-magnitude diagram (CMD) of a star cluster to derive a “cooling age” for the cluster is finally being exploited with ever-increasingly success (Richer et al., 1998; von Hippel & Gilmore, 2000; Kalirai et al., 2001a; Andreuzzi et al., 2002; Hansen et al., 2002). This is largely due to the observational power of the Hubble Space Telescope (HST) and its ability to detect faint WDs. Credit must also go to the development of more sophisticated cooling models for WDs (Hansen 1999, for example). Strong constraints, independent of cosmological models and parameters, are being placed, with this technique, on the age of the Universe.
The determination of a cooling age for a star cluster is, as the term suggests, based on the fact that WDs cool systematically as they age, having only their residual ion thermal energy as a significant energy source. As a star cluster ages its massive WDs form first from the most massive progenitors and as time proceeds progressively less massive WDs are introduced at the top of the WD cooling track. The more massive a WD is the smaller it is (a consequence of being supported by electron degeneracy pressure) and the slower it cools. The net result is that as a star cluster evolves the WD cooling track moves redward in the CMD and that a blue hook develops as the older WDs are caught, in terms of decreasing luminosity, by younger (less massive) WDs. Furthermore, for any particular WD its cooling rate initially decreases with time and this causes the WDs to pile-up at what is often referred to as the bottom of the cooling track. For older populations, such as globular clusters, the oldest WDs will actually lie below this point on the CMD because the cooling rate of a WD increases sharply in the later stages of its lifetime (after Gyr depending on mass). Regardless we shall continue to refer to this point in the CMD as the bottom of the sequence, which is true at least for open clusters111The description of WD cooling presented here is necessarily simplistic. We suggest that the interested reader visit http://astro.ucla.edu/ hansen/m4.html which includes a clickable WD sequence with explanations of the various features.. It is only with HST, and even then with extremely deep exposures, that the bottom of the WD cooling sequence in a globular cluster can be observed (Richer et al., 2002; Hansen et al., 2002). For nearby open clusters it is also possible to discover cool WDs by conducting deep photometric surveys using ground-based telescopes (Richer et al., 1998; Kalirai et al., 2001a). We note that the blue hook mentioned above is a mass effect and is not that described by Hansen (1998) in which an individual WD with a hydrogen-rich atmosphere evolves blueward in the CMD as it cools below K.
When calculating the age of a cluster using observations of the WD sequence the luminosity function (LF) can be utilised to varying degrees. The clump-up of WDs at the bottom of the cooling track corresponds to a maximum, or peak, in the WD LF. The presence of this feature in an observed LF for an open cluster is evidence that the oldest WDs have been uncovered (von Hippel, Gilmore & Jones, 1995). Then, by making assumptions about the mass and composition of these WDs, an age is derived by using cooling models to find the time taken to cool to the absolute magnitude corresponding to the maximum in the LF (Richer et al., 1998; von Hippel & Gilmore, 2000; Kalirai et al., 2001c). In fact, Brocato, Castellani & Romaniello (1999) have shown theoretically that a unique relation exists between the faintest luminosity of a WD on the cooling sequence of an open cluster and the cluster age, as was first suggested by Schmidt (1959). For this age to be useful one must be sure that the true maximum in the LF has been observed, i.e. the maximum is not produced by incompleteness. In the case of a globular cluster, or an open cluster if a large enough population of WDs is observed, the more sophisticated method of directly fitting the resulting LF can be applied (Andreuzzi et al. 2002). As an excellent example of the potential of this technique, Hansen et al. (2002) have used the WD sequence of the globular cluster M4 to demonstrate a clear age difference between this halo object and the Galactic disk. A robust lower limit to the age of M4 (and hence the Universe) is found to be Gyr.
An indirect method for using cluster WDs to age the cluster comes from matching the WD sequence to the fiducial sequence obtained from local WDs with known trigonometric parallax and measuring the distance to the star cluster (Renzini et al., 1996; Zoccali et al., 2001). The distance can then be used to obtain the luminosity of the main-sequence (MS) turn-off in the CMD and then an age can be calculated by comparison with stellar models. The determination of the WD mass fraction in a cluster is also of importance as it relates to the nature of the initial mass function (IMF) and the WD population of the Galactic halo (von Hippel, 1998).
In light of the strong current interest being shown towards WDs in star clusters we believe it is pertinent to discuss the theoretically expected behaviour of these stars, in particular the morphology of the cluster WD sequence, from the point of view of realistic dynamical simulations. These same simulations have already been used to demonstrate that significant feedback exists between the dense stellar environment of a star cluster and the nature of its stellar populations (Hurley et al., 2001; Hurley & Shara, 2002b; Shara & Hurley, 2002). In this paper we show that the same is true for the cluster WD population but that this does not necessarily affect the derived cooling age of a cluster. However, we find that extreme care must be taken when using cluster WDs to make inferences about the IMF, either when using the WD luminosity function or the WD mass fraction.
In Section 2 we describe the realistic -body models, including stellar evolution, used to simulate WD cooling sequences of star clusters. We discuss the appearance of these sequences in Section 3 and investigate the role of mass-segregation in Section 4. We then establish to what extent the LF and the mass fraction of the WD population is affected by the cluster evolution, in Sections 5 and 6 respectively, before providing a discussion and summary of our findings.
2 The -body Simulations
We present results from -body simulations performed with the Aarseth NBODY4 code (Aarseth, 1999) on the GRAPE-6 special-purpose computers (Makino & Taiji, 1998) housed at the American Museum of Natural History. The NBODY4 code accounts for the evolution of single stars and binaries (mass-loss, mass-transfer, mergers, etc.) while modelling all aspects of the dynamical evolution of the cluster (see Hurley et al. 2001, and references therein, for full details). In particular, the single star evolution algorithm adopted by NBODY4 is that of Hurley, Pols & Tout (2000). This algorithm models the luminosity evolution of WDs using standard cooling theory (Mestel, 1952) and the radius of a WD is calculated from eq. (17) of Tout et al. (1997). The stellar evolution algorithm distinguishes three types of WD based on the core composition of the giant precursor: helium, carbon-oxygen (CO), or oxygen-neon (ONe). The CO WDs are 20% carbon and 80% oxygen while the ONe WDs are 80% oxygen and 20% neon (note that neon is representative of all carbon-burning products heavier than oxygen). Figure 1 compares the cooling track of a CO WD evolved with the Hansen (1999) models with the rather simplified model of Hurley, Pols & Tout (2000). As noted by Iben & Tutukov (1984) the Mestel theory assumes that a WD is basically an isothermal core composed of an ideal ionic gas embedded in an electron-degenerate gas, and that this is surrounded by a thin envelope through which photons diffuse at a rate governed by Kramers opacity. In Figure 1 the decreased cooling rate shown by the Hansen (1999) WD at early times is explained by the inclusion of neutrino cooling and true atmospheric opacities in the detailed models. As the WD cools a number of processes neglected by the simple model become important: crystallisation of ions in the core, the release of latent heat, and the rise of convection as a transport mechanism. At late times the crystalline core enters the Debye regime and there is a sharp increase in the cooling rate (B. Hansen 2002, private communication). To address the differences between the WD cooling rate of the Mestel theory and of the Hansen (1999) detailed models we have constructed a modified-Mestel cooling law. The original Mestel cooling law can be expressed as
| (1) |
where the factor , the exponent , is the mass of the WD in solar units, is the metallicity, is the baryon number for the WD material, and is the age of the WD in Myr. For our modified-Mestel law we split this relation into two parts: we use and for Myr, and and for Myr. As can be seen from Figure 1 this rather ad-hoc relation provides a much better fit to the detailed models, especially after noting that the accuracy of the Hansen (1999) models increases for yr (B. Hansen 2002, private communication). The modified-Mestel cooling law has been inserted into NBODY4 and is used throughout this work. This provides an initial qualitative assessment of the theoretically expected character of cluster WD cooling sequences. However, in the near future we will want to directly compare the WD sequences and LFs emerging from the -body data with observations, and for this it will be important to obtain a more sophisticated fit to the behaviour of the realistic WD models (as soon as a full database of such models becomes available). Metallicity variations are generally neglected when constructing detailed WD cooling models because the strong surface gravity of a WD will cause all elements heavier than helium to sink below the atmosphere (Hansen et al., 2002). We note that the Mestel cooling law does contain a weak dependence on through the assumption of electron scattering for the atmospheric opacity.
We focus on the results of three simulations that each started with stars and a primordial binary frequency, , of 40%, i.e. single stars and binaries. The IMF of Kroupa, Tout & Gilmore (1993) was used to assign the masses of single stars and a metallicity of was assumed. For primordial binaries the total mass of the binary was chosen from the IMF of Kroupa, Tout & Gilmore (1991), as this was not corrected for the effect of binaries, and the component masses were then assigned according to a uniform mass-ratio, , distribution. Individual stellar masses were restricted to lie within the limits of . The orbital separation of each primordial binary was taken from the log-normal distribution given by Eggleton, Fitchett & Tout (1989), within the limits of AU222The third simulation had an upper limit of AU but this still exceeds the hard/soft binary limit for simulations of this size. According to Heggie (1975) it is only initially hard binaries that will contribute to the long-term evolution of the cluster. We note that in this case the primordial binary population is effectively representative of a larger population drawn from a full range of separations., and the orbital eccentricity was taken from a thermal distribution (Heggie, 1975). We used a Plummer model (Aarseth, Hénon & Wielen, 1974) in virial equilibrium to set the initial positions and velocities of the stars but note that the density profile quickly evolved to resemble a King model (King, 1966). The simulated clusters were assumed to be on a circular orbit within a Keplerian potential with a speed of at a distance of kpc from the Galactic centre. Stars were removed from the simulation when their distance from the cluster centre exceeded twice the tidal radius defined by this tidal field. All stars were on the zero-age main-sequence (ZAMS) when the simulation began and any residual gas from the star formation process is assumed to have already left the cluster. Mass lost from stars during the simulation is simply removed from the cluster, with the cluster potential adjusted accordingly.
Each cluster started with a total mass of and was evolved to an age of Gyr at which point in stars remained. The initial velocity dispersion of the stars was (reduced to after Gyr) and the core density was stars. The average number density of stars in the core throughout the simulations was stars. The density within the radius that contained the inner 10% of the cluster mass started at the same value, reached a minimum of stars after Gyr, and rose to stars at Gyr. Each simulated cluster showed a modest core-collapse at Gyr, identified by a significant increase in core density, but we note that for models with such a large proportion of primordial binaries the exact point of core-collapse is difficult to judge, if it occurs at all.
For reference purposes we have performed two additional simulations that each started with stars but no primordial binaries. We also draw upon the simulations with stars and described by Shara & Hurley (2002) in their work on double-WD binaries in star clusters. As a result, our findings are directly applicable to intermediate-mass and massive open clusters. By making the appropriate scalings we can (cautiously) make inferences relating to WDs in globular clusters as well. More realistic, , simulations will be needed to make definite predictions about globular clusters.
3 The White Dwarf Sequence
We have chosen to concentrate on the simulated cluster data at Gyr for the purpose of illustrating the nature and appearance of the cluster WD population. There are a number of reasons for this choice. Firstly, this is late enough in the simulation (approximately 12 half-mass relaxation times have elapsed) that the cluster is dynamically evolved. On the other hand, it is not so late that the number counts of the stellar populations have become statistically insignificant. Furthermore, if time is scaled by the half-mass relaxation timescale, , then an age of Gyr for a cluster of stars is representative of a star cluster at Gyr (Meylan & Heggie, 1997), i.e. the results of our massive open cluster simulations at Gyr can be related to a moderate size globular cluster. We regard this final point with some caution because a number of timescales are at work in a star cluster and these scale differently with (Aarseth & Heggie, 1998). It has also been shown that many of the structural properties of a star cluster are -dependent (Goodman, 1987).
Figure 2 shows the CMD at Gyr for all WDs in the three simulations with primordial binaries. To convert the theoretically derived quantities of luminosity and effective temperature to magnitudes and colours we have used the bolometric corrections provided by the WD models of Bergeron, Wesemael & Beauchamp (1995). We start in Figure 2a by plotting only what we call standard single-WDs. By this we mean that each of the WDs, and their progenitor stars, were never part of a binary or involved in a collision and have evolved according to the standard picture of single star evolution. This produces the smooth cooling track seen in Figure 2a. For these WDs it is true that the more advanced along the track that a particular WD is, the more massive and older it is. We highlight the standard single WDs because these are the objects that the cooling models used to age the WD sequence directly relate to.
Next we add in all the remaining WDs that are single at Gyr but whose progenitor was originally a member of a binary (Figure 2b). Even though a substantial fraction of these WDs overlie the standard cooling track it is evident that the remainder contribute a great deal of scatter to the CMD. As an example, some of these WDs have evolved from blue stragglers, or more generally any MS star rejuvenated by mass-transfer. These progenitors’ journeys to the asymptotic giant branch have been delayed, hence when the WD was born it was more massive than WDs born from standard single stars at that time. This yields WDs lying below the standard WD sequence. Conversely, WDs less massive than expected at birth are produced from giants initially in binaries that overfilled their Roche-lobe and lost their envelopes prematurely, and then lost their partners in exchange interactions.
In Figure 2c we complete the full WD CMD by including all the double-WD binaries present at Gyr. The first thing to notice is that for the most part the double-WD sequence is well separated from the standard cooling track. This is because the computed double-WD binaries are mainly high mass-ratio systems (see Figure 3), in agreement with the measured mass-ratios of local double-WDs (Maxted, Marsh & Moran, 2002). Provided that photometric errors are modest (say, mag) it is possible to minimize contamination of the WD sequence by double-WDs in at least the upper half of the WD CMD. Further down the sequence we notice that double-WDs clump-up at brighter magnitudes than do the single-WDs and start to approach the WD sequence. This, combined with the scatter produced by the non-standard single WDs, leads to our first note of caution regarding observations of cluster WD sequences. Estimating the position of the bottom of the cooling track by the detection of WDs blueward of the track, or by a build-up of WDs at a certain magnitude, can be seriously misleading. It is possible to just be seeing the scatter in the WD sequence produced by non-standard WD evolution, or by a population of old double-WDs, and one may need to go deeper to find the true extent of the track. If the termination of the double-WD sequence were to be mistakenly used as the bottom luminosity of the WD sequence then, using the relation given by Brocato, Castellani & Romaniello (1999), this would translate to underestimating the cluster age by Gyr for a cluster with an actual age of Gyr.
In producing the WD CMD we have assumed that all the WDs are hydrogen-line (DA) type whereas a small, but significant, fraction will actually have strong helium (DB), or other anomalous, features. At least 75% of spectroscopically identified WDs are classified as DA in the catalogue of McCook & Sion (1999) but we note that for cool WDs the DA:DB ratio is more likely 1:1 (Bergeron, Ruiz & Leggett, 1997; Hansen, 1999). Modelling of WDs that do not have pure hydrogen atmospheres will produce additional scatter in the WD CMD, as will other factors that affect the cooling times and temperatures of WDs: the relative fractions of carbon and oxygen in the interiors of CO WDs (Koester, 2002), and the mass of the hydrogen (or helium) envelope (Hansen, 1999), for example. Importantly, our simulations have been performed with moderate stellar density - at least an order of magnitude less than conditions within the core of an actual globular cluster - and at higher density the incidence of stellar interaction is expected to be higher and hence a greater number of non-standard single WDs will be produced333For example, the high density globular cluster M80 is observed to have a large number of blue stragglers in its core (305; Ferraro et al. 1999) and therefore would be expected to also contain a large number of non-standard WDs.. Counteracting this, globular clusters are observed to have smaller binary fractions than used in our simulations: M4 has a binary frequency that could be as high as 15% (Côté & Fischer, 1996) or as low as 4% (Richer et al., 1996). It is also possible that a higher stellar density may hinder the production of certain populations, such as double-WDs, and lead to less contamination of the WD sequence.
Outside of the half-mass radius, , of a star cluster the number density of stars is less than in the core and the incidence of stellar interactions is also less. The binary fraction is also smaller in this region as mass-segregation is effective in causing binaries to sink towards the cluster centre (see Section 4). These considerations lead to a much cleaner WD sequence, as shown in Figure 2d, and it is here that observations of WD sequences (for the purposes of age dating) in globular clusters can most cleanly be conducted, if enough WDs are present.
Shara & Hurley (2002) found that open star clusters produce supra-Chandrasekhar mass double-WD binaries with merger timescales less than a Hubble time at a greatly enhanced rate relative to the field. Of the 198 double-WDs shown in Figure 2, 35 have a combined mass in excess of the Chandrasekhar mass and these are highlighted in Figure 4 (left panel). All but 2 of the supra-Chandrasekhar mass double-WDs lie in a clump just to the right of the standard single-WD sequence. The area defined by this clump also contains 12 other stars (non-standard single WDs and sub-Chandrasekhar mass double-WDs) which means that 73% of the stars in this sub-area of the CMD are supra-Chandrasekhar mass double-WDs. Provided that observations can be performed with suitably high signal-to-noise this method is a possible way to isolate these potentially interesting binaries. More sophisticated follow-up methods, such as the use of a gravitational wave detector (Benacquista, 1999), would be required to learn about the merger timescales of these binaries. Figure 4 (right panel) also highlights the double-WD binaries produced by exchange interactions during the simulations: 25% of the double-WD binaries at Gyr are non-primordial. It can easily be seen that these binaries do not preferentially form in any particular sub-area of the general double-WD sequence (see also Figure 3) and hence they cannot be isolated by photometric methods.
4 Mass Segregation
A number of -body studies (Giersz & Heggie, 1997; Portegies Zwart et al., 2001; Hurley et al., 2001; Hurley & Shara, 2002a) have previously verified the Fokker-Planck results of Chernoff & Weinberg (1990): mass-segregation occurs in star clusters, and this causes stars less massive than the average stellar mass to migrate outwards on a timescale governed by two-body relaxation. Conversely, stars more massive than average sink towards the centre of the cluster. Low-mass stars are thus preferentially stripped from the cluster by the external potential of the Galaxy. To reinforce these findings we show in Figures 5a and 5b population gradients for single stars, WDs, and double-WDs, at and Gyr respectively. Clearly the WDs are more centrally concentrated than the overall population of single stars and therefore it is less likely that WDs will be lost from the cluster by tidal stripping. In fact, for our , simulations after Gyr of evolution, 20% of the mass generated in WDs has escaped from the cluster with the average mass of these WD escapers being . By contrast, 91% of the mass in single MS stars with has been lost from our models after the same period of time. After Gyr only 4% of the WD mass has escaped from the cluster. The fraction of mass lost from the cluster in escaping WDs agrees favourably with Vesperini & Heggie (1997) when comparing with their model at kpc from the Galactic centre after a similiar number of relaxation times have elapsed.
Some central concentration of the WD population is to be expected because their average mass is greater than that of all the cluster stars (for Gyr; see Figure 5c). However, the main reason for this concentration is that the progenitors of the WDs were originally more massive than the current MS turn-off mass and therefore the WDs are more likely to be born interior to . This point was also discussed by Portegies Zwart et al. (2001) in relation to their models of young open clusters. Binaries are on average more massive than single stars and as such will segregate towards the centre of the cluster. This is also true of double-WD binaries (see top panels of Figure 5) which have an even higher average mass than standard binaries.
Figure 5c shows the average mass of the WDs as a function of time, and also the average mass of all the single stars in the cluster, excluding WDs and other degenerate objects. The single star average mass initially decreases owing to mass-loss from the most massive stars but then begins to increase as tidal stripping of low-mass stars slowly starts to dominate over mass-loss from stellar evolution. If the cluster was instead evolved in isolation so that tidal stripping was not accounted for, then the single star average mass at Gyr would be as opposed to . The reverse is true for the evolution of the WD average mass – stellar evolution and not tidal stripping is the dominant factor. The first WD forms at Myr from a star with a ZAMS mass of and is of oxygen-neon composition with a mass slightly below the Chandrasekhar mass (). Then, as time proceeds, the zero-age WD mass progressively decreases (see Hurley, Pols & Tout 2000 for a full description of the WD initial-final mass relation generated by the evolution algorithm) which eventually results in a build-up of CO WDs with masses in the range . Helium composition WDs are also produced, but only after some form of binary interaction. These have an average mass of . The average WD mass at Gyr is , practically the same as it would be if the population had been evolved in isolation. While the single star average mass is sensitive to where in the cluster it is measured, decreasing from in the core to near the tidal boundary at Gyr, the WD average mass is relatively uniform throughout the cluster. Thus it would appear that overall the WD population has been little affected by the dynamical evolution of the cluster, in agreement with the conclusion of Portegies Zwart et al. (2001), although we will show in the next section that this is not necessarily true when considering the WD LF.
The fact that over time the progenitor mass of the WDs is steadily decreasing, and that the WD and single star average masses are nearing equality, explains why the WDs appear marginally less centrally concentrated at Gyr than at Gyr. Eventually the average mass of the non-degenerate single stars will increase above that of the WDs and the population gradients of the two populations will converge – mainly due to the WDs drifting slowly outwards. However, by the time this occurs the cluster is dynamically very old, in excess of 20 half-mass relaxation times will have elapsed, and near complete disruption.
In Figure 5d we show how the cluster age scales with the half-mass relaxation timescale as this can be a useful reference tool when interpreting the results of the simulations. We show both the number of half-mass relaxation times elapsed when simply dividing the cluster age by the current and when integrating over the lifetime of the cluster. The latter number is representative of the true dynamical age of the cluster and the two methods give similar results until starts to decrease during the latter stages of evolution. The half-mass relaxation timescale for the simulations starts at Myr, rises to Myr at Gyr, and has decreased back to Myr after Gyr of evolution. It basically follows the evolution of the cluster half-mass radius which increases initially owing to mass-loss from massive stars and then decreases as it starts to feel the effect of the shrinking tidal radius (Hurley et al., 2001). At Gyr, pc for these simulations.
5 The Luminosity Function
The WD luminosity function holds information about the age of a cluster and the IMF of its stars. In order to extract this information accurately we must be sure that the observed WD LF is relevant for the intended purpose. For the age determination this really boils down to being certain that the true peak in the LF has been identified. In the case of open clusters this corresponds to being certain that the bottom of the WD sequence has been reached, i.e. the coolest standard single WD has been observed. However, for the older populations of globular clusters it is not yet possible to observe the oldest WDs as these will be massive helium atmosphere WDs with luminosities below current detection limits (Hansen, 1999). The attraction of this approach is that it provides an age that is relatively independent of stellar evolutionary models because the nuclear-burning lifetime of the progenitor to the oldest WDs is short (Myr) compared to the age of all globular clusters and most open clusters (von Hippel, Gilmore & Jones, 1995). For the case of inferring the IMF we must be sure that the observed WD LF is a true representation of the present-day mass function (PDMF) of the cluster, noting that for WDs the LF and MF are directly related via the cooling models.
In Figure 6 we show the WD LF from the -body simulations at Gyr for the entire WD sequence (as shown in Figure 2c). We also show the LF for the standard single-WDs. Performing a test reveals a probability of 0.02 that the two LFs are drawn from the same distribution. The main points to notice are that contamination of the WD sequence by the presence of double-WDs and non-standard single-WDs does not affect the location of the LF maximum but that the slope of the LF is strongly affected.
5.1 Inferred IMF Slopes
For a population with at an age of Gyr the range of ZAMS stellar masses that will have evolved to become WDs is . Assuming a power-law IMF of the Salpeter (1955) form (where is the corresponding slope of the function in our chosen notation) we can fit the IMF slope in this mass range to the cluster LF by constructing theoretical LFs for a range of . In this case the LFs from the -body simulations are the observed LFs. When constructing the theoretical LFs we evolve only single stars as we want to quantify how the inclusion of non-standard WDs in the LF affects the inferred IMF. These single stars are evolved according to the same rapid evolution algorithm used by NBODY4. This ensures that uncertainties in the accuracy of the WD cooling tracks and the MS lifetimes of the WD progenitors, for example, do not play a role in the fitting process. No dynamical effects are accounted for in the theoretical LFs. To determine the appropriate for an observed LF we find the theoretical LF that gives the smallest value of the statistic, where we have used in constructing the theoretical LFs. The two distributions are normalized so that the sum of all bins are equal which means that the number of degrees of freedom in the fitting process is one less than the number of bins. We note that the probability returned by the fit is not independent of the normalization – if the distributions are normalized to a greater total number of WDs the probability that the fit is a good one decreases (for the same number of bins). In this work we are primarily concerned with using the value of to determine which gives the best fit. However, the probability returned by the fit may also be of interest so we have made sure to use the same normalization throughout this work, i.e. all distributions are normalized to have the same total number of WDs as that given by the solid line in Figure 6 before commencing the fitting process.
The result is (with a probability of 0.30 that this is a good fit) when considering all the WDs, and (0.65) for the standard single-WD LF. We note that the slope of the Kroupa, Tout & Gilmore (1993) IMF used in these simulations is 2.7 for masses in excess of a solar mass and therefore, after Gyr of evolution, the standard single-WDs are no longer representative of the true PDMF for the initial population (evolved without dynamics). After Gyr the LF for standard single-WDs is best fit by (0.87) and after Gyr the fit reveals (0.76) – further evidence that over time the cluster environment is eroding the usefulness of the WDs as tracers of the IMF but also showing that it takes time for this erosion to become significant. The presence of double-WDs in the LF increases the relative number counts in the intermediate-magnitude bins (located in the range of mags below the peak), effectively puffing-up the middle of the LF and causing the fitting process to find an artificially high as the IMF tries to produce more single-WDs of intermediate age. The error in the fitting process is understandably higher in this case as it becomes difficult to fit the LF with a single power-law IMF. When including the 40% binary fraction in the initial population its non-dynamical PDMF at Gyr is best fit with (0.48). After Gyr the LF for all cluster WDs, including double-WDs, is best fit by (0.93) and after Gyr it is best fit by (0.43). So the LF for all WDs is affected by the cluster environment at a much earlier stage than for the standard single-WDs, first indicating a flatter than expected mass function which then becomes steeper than expected at later times.
5.2 Half-mass Radius
In Figure 7 we break the LF for all WDs at Gyr into two separate LFs depending on whether the WD is inside or outside of the cluster half-mass radius. Performing a test on the two LFs reveals a probability of 0.01 that they are drawn from the same distribution. The inferred IMF slope for is (0.86) and exterior to it is (0.26), which makes sense on the basis of mass-segregation increasing the proportion of double-WDs and luminous single-WDs in the central regions (see also Figure 2d). Considering only the standard single-WDs the best fits are (0.94) for and (0.46) for . The results of the LF fits at 1, 2, and Gyr for the simulations starting with and are summarised in Table 1.
It is clear from Figure 7 that the most luminous WDs are preferentially found interior to . We find that when a WD appears at the top of the cooling track it is most likely to be found at a radial distance of from the cluster centre, where is the half-mass radius of the WDs which is itself less than (for Gyr). Then as the WD cools it will relax out to on a timescale equivalent to twice the current half-mass relaxation timescale. By the time the WD reaches the bottom of the cooling track it will have relaxed even further to blend in with the spatial distribution of the cool WDs. As the cluster evolves the fraction of luminous WDs found interior to decreases. Defining a luminous WD as one appearing in the upper four magnitudes of the WD sequence ( at Gyr) we find that 19% of the standard WDs with at Gyr are luminous whereas 40% are luminous at Gyr. Exterior to the numbers are 14% and 24% which means that over time the difference between the two populations is also decreasing. This is apparent in Table 1 where we see that the difference between the LFs for WDs interior and exterior to , in terms of the fitted to each LF, decreases as the cluster ages.
5.3 Exchanges and Escapers
The reason for the steepening with time of the IMF inferred from the standard single-WD population of the cluster is not an over-abundance of luminous WDs but rather the preferential escape of older less-luminous WDs from the cluster, as these are more likely to reside in the outer regions. We recall from the previous section that the fraction of escaping WDs increases as the cluster evolves. Strong dynamical interactions with other cluster stars also alters the make-up of the standard single-WD population but here the effect on the LF is less clear. After Gyr 14% of the potential standard single-WDs have been lost from the population because they, or their MS star or giant precursors, have been exchanged into binary systems444 The approximate timescale (Davies, 1995) for a MS star to be exchanged into a binary consisting of and MS stars is Gyr if the binary is in the core of the cluster and has a semi-major axis of AU (or equivalently if the binary is at and has a semi-major axis of AU).. This accounts for 49% of the total number of exchange interactions recorded in the Gyr of cluster evolution. In raw numbers this amounts to a loss of 140 potential standard single-WDs: 19 of these were exchanged into a binary after becoming a WD and 12 of the double-WDs present at Gyr contain a WD that would have been a standard single-WD without dynamical intervention. At any point in time this process is more likely to affect luminous WDs as these reside in higher density regions but over the lifetime of the cluster both cool and hot WDs are affected and the change to the LF slope is minimal. After Gyr of cluster evolution 6% of the standard single-WD population has been lost owing to exchange interactions (8% after Gyr), accounting for 24% of all exchanges to that point (37% after Gyr), and none are found in double-WDs. Therefore, as the cluster evolves the standard single-WDs become involved in dynamical encounters to a greater degree but the effect remains secondary to the escape of cool WDs in explaining the steepening of the inferred IMF.
When considering all WDs appearing in the cluster WD sequence, including double-WDs, the LF at Gyr has suffered from a decrease in the relative number counts at the bright end (as evidenced by the lower than expected ). There are a number of ways that the cluster environment could be producing this effect. The presence of wide double-WD binaries in the core leaves this population exposed to disruption by 3- and 4-body encounters. The presence in the core of binaries composed of a WD and a nuclear burning star that will soon evolve to become a WD, raises the possibility of 3-body interactions exchanging the WD for a slightly more massive MS star so that this system will not reach the WD sequence. Furthermore, the progenitors of short-period double-WDs, that are formed via a common-envelope phase, may be hardened by 3-body encounters and as a result the common-envelope is formed earlier than expected, thus accelerating the formation of the double-WD, or even resulting in a merger event. The time at which the value of the IMF slope inferred from the LF of all WDs matches the expected non-dynamical value () is Gyr. By this time the density of stars in the inner regions of the cluster was approximately a factor of 10 less than the starting value, making dynamical modification of the cluster populations less likely, and the escape of cool WDs had started to dominate in terms of shaping the LF.
5.4 Where to Observe?
Brocato, Castellani & Romaniello (1999) have already demonstrated that variations to the IMF do not alter the location of the LF maximum and therefore calculations of the cluster age using this method are not sensitive to errors in the IMF slope. However, for the more sophisticated method of fitting the entire LF (Hansen et al. 2002, for example) the method is sensitive to the IMF as it alters the relative number of WDs in each luminosity (or mass) bin. Working on the premise that we are interested in deriving an age for a star cluster by fitting the WD LF, and that we are only going to consider cooling models of standard single-WDs in this process, then the question is this: where in the cluster should we look in order to extract the correct PDMF, i.e. an IMF slope of for the single-WDs? The simple answer for our models at Gyr is: nowhere. At this point the cluster is dynamically well evolved (12 half-mass relaxation timescales have elapsed) and the cluster environment has effectively removed all trace of the IMF from the WD population. The region where we come closest to recovering the PDMF is where for the standard single-WDs. At earlier times the situation is not so severe. After Gyr (3 half-mass relaxation timescales) and Gyr (5 half-mass relaxation timescales) the PDMF for single-WDs is recovered by considering only standard single-WDs in the region . Owing to the fact that the WDs are centrally concentrated with respect to nuclear-burning single stars at these times (see top panels of Figure 5) it is understandable that we need to look inside to find the PDMF. Outside of there is a paucity of massive stars and therefore a deficiency of young WDs, flattening the inferred IMF, and conversely we would expect an over-abundance of young WDs in the very central regions of the cluster, slightly offset by the presence of the majority of the very massive old WDs. Thus, assuming that our observations are accurate enough that we can remove a substantial fraction of the double-WDs from the LF, then using the LF of WDs residing in the portion of a young cluster should provide a reliable age (although the non-standard single-WDs still remain – see Section 7.1). If double-WDs cannot be removed then binary evolution, as well as dynamical effects, must be accounted for in the fitting process. Factors such as the relative fraction of DA to DB WDs also play a role in determining the shape of the LF (Hansen et al., 2002).
5.5 Metallicity
The metallicity of the cluster population influences the LF fitting process in a number of ways. Firstly, the upper mass limit for a ZAMS star that will evolve to produce a WD has been shown to vary with : it decreases from for to for in our adopted stellar evolution algorithm. This mass limit is found by inspecting detailed stellar models to determine at what mass carbon ignites in the core of an asymptotic giant branch (AGB) star, and the subsequent burning of this carbon produces an ONe core larger than the Chandrasekhar mass (Pols et al., 1998). The actual upper mass limit may be slightly less than this depending on the mass-loss rate assumed for stars on the AGB555 Hurley, Pols & Tout (2000) provides a description of the mass-loss rate used in the stellar evolution algorithm and also a more complete description of the WD upper mass limit.. Secondly, the mass of a WD at birth depends on competition between the rate of growth of the degenerate core of its AGB star progenitor and the rate at which the envelope of the star is depleted by mass-loss – both of which depend to some degree on . Finally, the lifetime of a MS star depends on its initial composition, shortening with decreasing metallicity for the range of initial masses that produce WDs. For example, the MS lifetime of a star decreases by when the metallicity of the star is reduced from to 0.0001. This has the effect of lowering the MS turn-off mass for low metallicity clusters and increasing the age of the WDs relative to MS stars. All of these effects are naturally accounted for in the LF fitting process provided that the correct metallicity is used when generating the theoretical LF. Of the four -body simulations described by Shara & Hurley (2002), each starting with and , two were performed with while the other two had solar metallicity. We find that regardless of metallicity, the LFs for the standard single WDs at Gyr in each of these simulations are best fit by an IMF slope of , noting that the range of ZAMS masses producing WDs at this time for is . We also find that metallicity has a negligible effect on the WD mass fraction of a cluster (see next section), in agreement with von Hippel (1998).
6 The Cluster White Dwarf Mass Fraction
Figure 8 shows the fraction of the cluster mass contained in WDs as a function of time for the -body simulations with and discussed in this paper. Also shown is the WD mass fraction, , for the same primordial populations evolved without dynamics. It is clear that as time progresses, and the simulated clusters become dynamically more evolved, that the cluster environment has a significant effect on the measured WD mass fraction. More correctly it is a combination of the cluster environment and the environment that the cluster resides in that is producing this effect, i.e. mass-segregation causes low-mass MS stars to move to the outer regions of the cluster so that these stars are preferentially stripped from the cluster relative to heavier objects such as WDs (see Section 4). Therefore, even though properties of the WD population such as its total mass are relatively unaffected by the dynamical evolution of the cluster, the WD mass fraction is affected and all clusters will become rich in WDs in the late stages of their evolution (see also Vesperini & Heggie 1997; Portegies Zwart et al. 2001).
For young open clusters, less than relaxation times old, the results of our simulations suggest that it is safe to assume that the WD mass fraction has been little affected by the kinematic evolution of the cluster (von Hippel, 1998). However, for older open clusters and for globular clusters it would be incorrect to make this assumption. Vesperini & Heggie (1997) used -body models with stars to investigate after Gyr of evolution for globular clusters born with stars. For a cluster orbiting within the Galactic potential at a distance of kpc from the Galactic centre they found (with some dependence on the IMF and density profile chosen for the model). Checking their results by performing additional simulations of and stars they found and , respectively. This lack of convergence for increasing demonstrates the perils of scaling the results of small- simulations to large- clusters. However, owing to the difficulty in performing direct -body models of globular clusters, scaling is often unavoidable and in that case our value of at Gyr may be taken as a lower limit of the true value for an old globular cluster.
Vesperini & Heggie (1997) showed that the position of a star cluster in the Galaxy is a factor in determining its WD mass fraction. They found that clusters orbiting at kpc have increased by more than a factor of two over clusters at kpc. Therefore, we would expect globular clusters such as M4 which has a perigalacticon of kpc (Peterson, Rees & Cudworth, 1995), to exhibit dynamically enhanced WD mass fractions. For M4 this is supported by observations of its MF for stars less massive than having a slope of only (Richer et al., 2002). In light of these results it would seem that the assumption by von Hippel (1998) that the WD mass fraction of M4 has not been affected by the kinematic evolution of the cluster is in error. We urge anyone utilising observations of the WD mass fraction in dynamically evolved star clusters, and especially those clusters orbiting near the Galactic centre, to account for the dynamical history of the cluster. We note that the position in our simulated clusters where matches that of the non-dynamical population, after Gyr, is at three half-mass radii from the cluster centre.
After Gyr of cluster evolution, or half-mass relaxation times, has approximately doubled in comparison to the same population evolved without dynamics. This translates to an error of , or 10%, in the slope of the inferred power-law IMF if the dynamical evolution is ignored. Portegies Zwart et al. (2001) demonstrated that the dynamical evolution of a cluster has little effect on the numbers of giants and WDs present in the population and therefore that the relative number of these stars may be used to constrain the IMF of a star cluster. However, in making this point Portegies Zwart et al. (2001) were only drawing upon the results of small- simulations at Gyr (after relaxation times). Our simulations with and also show minimal modification of the giant and WD numbers for the same degree of dynamical evolution (Gyr for our larger ) but after Gyr this is no longer true: only 48% of the expected number of giants, and 50% of the expected number of WDs, are present in the cluster at this time. Remarkably the number ratio of the two populations is still intact and would provide a reliable estimate of the IMF. Depletion of the number of WDs is primarily the result of WDs escaping from the cluster – this accounts for 80% of the decrease – with the remainder of the depletion explained by enhanced binary interaction. Giants are much less likely to escape from the cluster because their lifetimes are extremely short compared to MS and WD lifetimes. As such, only 4% of the expected population of giants at Gyr was lost as a result of giants escaping the cluster. An additional 20% of the expected giants were lost as a result of MS stars that would have evolved to appear as cluster giants at Gyr escaping prior to this time. The remaining 23%, i.e. of the decrease, is explained by the depletion of giants, or their MS progenitors, in 3- and 4-body encounters.
In Figure 8 we also show the evolution of with time for simulations with and , and for simulations with and no primordial binaries. We believe that the difference in between the two different families of -body simulations with primordial binaries is real and can be explained in terms of binary fraction, and to a lesser extent the initial period distribution assumed for the binaries. Consider that a non-interacting, i.e. wide, binary composed of two stars will evolve to contribute two WDs to the cluster WD population. If instead the binary components do interact and merge to form a single star (initial periods less than d) then only one WD with a mass in the range , depending on the binary period, will be contributed. Therefore, the evolution of close binaries can decrease the mass in WDs. As a result the simulations with a large binary fraction (40%) experience a larger relative decrease in the WD mass fraction owing to binary evolution than those with a moderate binary fraction (10%). A larger binary fraction also provides more scope for the cluster to increase the fraction of close binaries through 3- and 4- body encounters.
Comparisons between the simulations with and without primordial binaries simply using the cluster age can be misleading because the latter are dynamically less evolved at an age of Gyr. Without binaries the half-mass relaxation timescale at Gyr is Myr which is twice as long as the timescale found for both families of simulations with primordial binaries. The primary reason for the difference is that clusters with a significant primordial binary population suffer a higher rate of mass loss from the cluster: 40% of the initial cluster mass remains at Gyr for the clusters, 27% for , and 21% for . An enhanced rate of escaping stars via velocity kicks obtained in 3-body interactions is the explanation for this trend. If we instead make a comparison of when the simulated clusters are all at the same dynamical age (10 half-mass relaxation timescales old) then we find 0.168 for (Myr), 0.170 for (Myr), and 0.147 for (Myr).
7 Discussion and Further Analysis
Using the results of -body simulations to investigate and understand the nature of WD populations in star clusters, in terms of appearance in the CMD, the luminosity function, and mass fraction, appears to be a worthwhile approach. However, to this point we have concentrated on one particular type of simulation with its unique set of initial conditions. Variations to the model parameters, which range from the initial setup of the cluster to aspects of binary evolution, have the capability to influence the results. Here we discuss which parameters are of greatest importance and look at how our results can be utilised to interpret observations of WD populations in star clusters.
7.1 Variation of Cluster Parameters
We have already seen in Section 6 that the primordial binary fraction of a star cluster plays a role in determining the evolutionary characteristics of the cluster, such as the escape rate of the stars and the relaxation timescale, as well as affecting aspects of the stellar populations, namely the WD mass fraction. Similarly we would expect the binary fraction to have an impact on the shape of the WD luminosity function and the appearance of the WD sequence in the CMD. In Tables 2 and 3 we have replicated the luminosity function results of Table 1 but this time for the simulations with and , respectively. For the trends in the LF data are similar to those found for the simulations with but in general the behaviour is less extreme. As an example, the LF for standard single-WDs at Gyr is best fit by , as opposed to for , so it is closer to the non-dynamical expected value. The probability of the fit being a good one is also higher which is an indication of a lower degree of contamination in the WD sequence. The reason for this is most likely a combination of the clusters having lost less of their stars at the same age and also that a smaller fraction of standard single-WDs have been affected by dynamical interactions. We note that the clusters with only 10% primordial binaries have a smaller total number of stars than those with 40% primordial binaries. This may also be a factor in any differences between the two types of simulation but on the other hand the total number of systems, single stars and binaries, is equal.
For the simulations without primordial binaries the first binary formed after Myr of evolution, which is roughly the half-mass relaxation timescale at that time. The number of binaries in the simulation jumps sharply at the time of core-collapse (Myr, or half-mass relaxation times) but even so, the number is only seven, or 0.03%. The binary frequency subsequently reaches a peak of 0.07% after Myr and basically stays at this value for the remainder of the simulation. Owing to the lack of binaries in these simulations it is not surprising to see minimal contamination of the WD LF by double-WDs and non-standard single-WDs – the LF results in Table 3 for all WDs and standard single-WDs are identical. However, the shape of the WD LF has still been affected by the dynamical evolution of the cluster and the behaviour is similar to that found for the simulations.
We note that for all of the LF fits described in Tables 1-3 the value of the statistic for the fit is less than that given by the uncertainty in the data points, except in two cases – the fits for all WDs and standard single-WDs at Gyr for the simulations. Both LFs sufferred from a distinct lack of hot WDs for which meant that only four data points were available to be fitted.
In Section 5.4 we found that after and Gyr of cluster evolution the best place to look for the true non-dynamical PDMF of the standard single-WDs was in the region , in the case of the simulations. This is also true for the other simulations that we have considered although for at Gyr it is best to look closer to , and for both and clusters at Gyr it is best to look closer to . For all the simulation types it is not possible to recover the PDMF after Gyr of evolution.
An interesting question is whether we can quantify our findings on the contamination of the WD sequence in such a way as to help observers of open clusters produce clean WD LFs? As shown in Table 4 the level of contamination clearly increases with an increasing cluster primordial binary fraction, both in terms of the number of non-standard single-WDs and double-WDs produced, and the dynamical removal of standard single-WDs. We have also included in Table 4 the ratio of double-WDs to single-WDs, and the ratio of non-standard single-WDs to all single-WDs, for the three distinct types of simulation. Unfortunately there is no clear relation between these two numbers, except that as one increases so does the other. One or two more data points and more simulations to decrease the noise in these results may lead to a more promising result. In the meantime the numbers presented in Table 4 should prove useful, especially if observations are good enough to separate the majority of double-WDs from the single-WD sequence in the CMD and therefore gain an accurate estimate of the ratio of double-WDs to single-WDs. Alternatively the binary fraction of the cluster, or at least a lower limit, may be known from observations of the main sequence (Montgomery, Marschall & Janes 1993, for example). Either way, the results of our simulations can then be used to estimate what fraction of non-standard single-WDs are present and remove these from the LF, although the behaviour of this fraction with magnitude is required for this approach to be of most use. Our recommendation for anyone wishing to derive information from the WD LF of a dynamically evolved star cluster is that they request data for simulations that best match the parameters of the observed cluster (age, binary fraction, etc.).
Any aspect of the initial conditions chosen for a particular simulation that has the potential to affect the lifetime of the cluster or the amount of dynamical activity also has the potential to alter the makeup of the resultant stellar populations, and therefore create uncertainty in our results. In addition to binary fraction the parameters that immediately spring to mind are the number of stars, the density profile, and the external potential in which the cluster will orbit. Indeed, Vesperini & Heggie (1997) have shown that both the shape of the cluster mass-function and the WD mass fraction are significantly affected by the starting value of and the position of the cluster in the Galaxy, while the choice of initial density profile is less important. However, these results are only for models of single stars and it is the lack of large-scale simulations with substantial binary populations and a realistic treatment of binary evolution that makes it difficult to quantify the broader impact of these parameters on the stellar populations of clusters. This is precisely what we have started to address in the work presented here but considering that each of our simulations took a minimum of four weeks to perform a full parameter study will take time. To investigate the actual behaviour of the WD population in a globular cluster we need to push the particle number of our simulations to at least and recently Baumgardt & Makino (2002) have taken steps in this direction. With a single GRAPE-6 board and a primordial binary fraction of only a few percent it is estimated that a full scale simulation with will take a minimum of four months to evolve to Gyr.
7.2 Variation of Stellar and Binary Evolution Parameters
In the NBODY4 code all aspects of standard binary evolution, i.e. non-perturbed orbits, are treated according to the prescription described in Hurley, Tout & Pols (2002). The problem with modelling binary evolution, whether it be by a prescription based approach or using a detailed evolution code (Nelson & Eggleton, 2001), is that the outcome is extremely dependent on the input parameters to the model, which are themselves uncertain. Furthermore, we are not even sure of how to model some of the processes that arise. Take, for example, common-envelope evolution which is assumed to occur when mass transfer becomes unstable. In this case a detailed model of the process is still beyond us and those working in the field of binary population synthesis cannot even agree on a standard form for a simple model (Iben & Livio, 1993; Nelemans et al., 2001; Hurley, Tout & Pols, 2002), let alone parameters of the model such as the common-envelope efficiency parameter, . The uncertainty that this creates is substantial because in population synthesis the common-envelope phase is crucial for the production of binaries such as cataclysmic variables and short-period double-WDs. For the -body simulations described in this paper we have used as this was shown by Hurley, Tout & Pols (2002) to give good agreement with observationally determined Galactic formation rates of various binary populations, although in most cases the observational tests were not particularly stringent. For example, Hurley, Tout & Pols (2002) showed that using does not predict enough short-period (d) double-WDs, compared to local observations, whereas does. Hurley, Tout & Pols (2002) investigated the influence of a number of model parameters on the predicted Galactic formation rate of double-WDs. They found that the rate was not particularly sensitive to the choice of model for tidal evolution of the binary system, the metallicity of the population, or the initial eccentricity distribution, and changed only marginally with variation in (within reasonable bounds of course). However, the predicted rate decreased by more than an order of magnitude when the component masses of each binary were drawn independently from the same IMF, as opposed to assuming a uniform distribution for the mass-ratios of the binaries, . These findings were in agreement with the extensive study of double-WD formation rates performed by Han (1998), using a different binary evolution model. In addition Han (1998) considered the existence of a stellar wind, the velocity of this wind, enhancement of the stellar wind by the presence of a close companion, and the mass transfer efficiency of stable Roche-lobe overflow, as variable parameters and found that none of these had a substantial impact on the predicted rates.
In Table 5 we list population synthesis results relating to double-WDs for the parameters of the binary population that we feel have the potential to change the outcome of our -body simulations: , , and the initial distribution of the binary periods (or separations). The standard model (STD) assumes the parameters used in the -body simulations, namely , , and the log-normal distribution of orbital separations given by Eggleton, Fitchett & Tout (1989). In turn we then try models with (CE1), binary component masses drawn independently from the IMF (IMF), and orbital separations chosen from a uniform distribution in the natural logarithm of the separation (SEP). Shown in Table 5 are the fraction of binaries that are double-WDs and the value of returned by fitting the WD LF (with corresponding probability of goodness-of-fit), after Gyr. We also show the results of tests between the WD LF of each model and that of the standard model. Clearly the choice of is the most crucial as the IMF model biases binaries to having small mass-ratios and leads to a greatly reduced number of double-WDs. The random pairing of binary component masses from the IMF is not well supported by observations (Eggleton, Fitchett & Tout, 1989; Duquennoy & Mayor, 1991) however, Kroupa (1995) has shown that this assumption may be valid if most stars are formed in embedded star clusters. Furthermore, Tout (1991) has shown how selection effects make it difficult to determine from observations. The distribution of orbital separations assumed in the SEP model is also not well supported by observations (Eggleton, Fitchett & Tout, 1989; Duquennoy & Mayor, 1991) but once again the observed data is poorly constrained. It is comforting to see that the choice of has only a small effect on the number of double-WDs in the model and that the appearance of the WD LF is unaffected, at least in the absence of dynamical interactions.
When considering the implications of the various models for the results of our -body study we must also look at the distribution of orbital periods for the double-WD populations of each model. This will help to determine how potential modification of the double-WD population via interaction with the cluster environment may be affected. Figure 9a compares the distribution of double-WD periods at Gyr arising from the STD model with that of the -body simulations that started with and . Thus the initial conditions of the two models are identical and the only difference is the presence of the cluster environment for the latter. For the -body simulations it is clear that dynamical interactions between the binary population and other cluster stars (or binaries) is effective in destroying the wide double-WD population, as expected, and in enhancing the number of close double-WDs (as described by Shara & Hurley 2002). In Figure 9b we compare the STD and CE1 population synthesis models. The population of very wide double-WDs is unaffected by the change in as their evolution did not involve a common-envelope event. Importantly the relative number of double-WDs in the intermediate period range is reduced for and it is this population that is most likely to be modified by the cluster environment and lead to an enhancement of short-period WDs. Therefore, our results are sensitive to changes in , with a lower leading to less contamination of the WD sequence by non-standard single-WDs. As expected, comparison of the STD and IMF models (see Figure 9c) shows that the number of double-WDs is greatly reduced across the entire period range when the binary component masses are randomly assigned, reinforcing that adoption of this initial condition would lead to substantially less interesting results regarding double-WDs. The SEP model also shows a decrease in the number of intermediate-period double-WDs (see Figure 9d), but not to the same degree as seen in the CE1 model. The decrease in the number of wide double-WDs is of little consequence for the -body results.
The bottom line is that uncertainty in the parameters of binary evolution and the initial conditions of the binary population leads to uncertainty in the results of -body simulations relating to binary populations. However, to explore the parameter space of binary evolution within the framework of -body simulations would be an inefficient use of computational resources. What we can do is to use the results of population synthesis calculations to determine which parameters are of greatest importance for future investigation. In the meantime we can also hope that observational constraints on certain parameters will improve, as will our understanding of processes such as common-envelope evolution. What is beyond question is that the cluster environment is very effective in modifying the evolution of the binaries it contains.
The average WD mass of any stellar population depends to a large extent on the initial-final mass relation (IFMR) which links the ZAMS mass of a WD progenitor to the mass of the WD. The IFMR that results from the stellar evolution algorithm utilised in NBODY4 (Hurley, Pols & Tout, 2000) is biased towards higher WD masses, for ZAMS masses greater than , than the semi-empirical IFMR derived by Weidemann (1987) or the theoretical IFMR proposed by Han, Podsiadlowski & Eggleton (1994, hereinafter HPE). We note that the IFMR produced by the stellar evolution algorithm is not pre-supposed: it is a natural consequence of the combined effects of the mass-loss prescription adopted for AGB stars and the evolution of the core-mass for AGB stars, as indicated by stellar models. It is also in good agreement with data on WDs observed in the young open cluster NGC (Jeffries, 1997). After Gyr of evolution for a non-dynamical population of single stars drawn from the Kroupa, Tout & Gilmore (1993) IMF the average WD mass of the population is 0.66 when using the SSE algorithm of Hurley, Pols & Tout (2000) and 0.62 if the HPE IFMR is adopted, i.e. a difference of 6%. For the simulated clusters that started with stars and we found that the average WD mass and the average mass of the single MS stars reached equality after Myr. If instead the HPE IFMR had been used then the crossover would have occurred Myr earlier, i.e. a 5% error. An area where a change in the IFMR has the potential to make a noticeable difference is the WD mass fraction of the cluster, . However, for all of the -body simulations we have presented the value of that we estimate if we had instead used the HPE IFMR in the models is in good agreement with the results of Section 6: for cluster ages in excess of Myr it is always within 5% of the quoted values. So, all in all we do not expect a change in the IFMR to seriously alter our findings, especially at cluster ages where the corresponding MS turn-off mass is below . One aspect that we have not considered in this analysis is that a decrease in the mass of a WD mass leads to an increase in its radius and therefore makes it more likely to interact with its companion, if indeed the WD is a member of a binary. In the SSE algorithm a ZAMS star would produce a WD, whereas use of the HPE IFMR would lead to a reduction of the WD mass by a factor of 7%, corresponding to an increase of 5% in the WD radius. To fully test the impact of this change on the results of our -body simulations would require performing new simulations that adopted the HPE IFMR throughout. However, considering that agreement between the various IFMRs is quite good for ZAMS masses below , or cluster ages greater than Myr, we do not believe that this is a necessary course of action.
7.3 Comparison with Observed Data Sets
In recent years increased interest in the WD populations of star clusters, due in part to their potential use as stellar chronometers, has lead to an increase in the available data relating to these populations (for recent reviews see von Hippel 1998; Koester 2002). The quality of these data sets has also improved but unfortunately not to the level where it allows rigorous comparison with our simulated clusters. Take, for example, the case of NGC (von Hippel & Gilmore, 2000) where the use of HST has allowed the detection of eight WDs and the calculation of an age for the cluster largely independent of stellar models. This number of WDs is far too small to enable a meaningful statistical comparison with either the WD CMD or the WD LF of our models. On the other hand, observations of M67 (Richer et al., 1998) using the Canada-France-Hawaii Telescope have produced a much larger sample of WDs (of the order of a 100) but problems of background contamination and the statistical subtraction of background sources persist. As a result, the WD LF is only a statistical representation of the true WD LF of the cluster and it is not possible to identify the actual WD sequence in the CMD (as far as being sure that a particular point corresponds to a cluster member). Bearing in mind that the quality of the observed data sets will only improve in the near future we shall persist and attempt some example comparisons using the existing data in order to demonstrate what may be gleaned from such an approach. Necessarily we will focus on intermediate age open clusters.
Richer et al. (1998) present a WD LF for M67 that after removal of background galaxies and field stars, and correction for incompleteness, contains 85 WDs down to the termination point of the cooling sequence. For comparison with the LFs of our -body models at Gyr we have converted the observed LF to absolute magnitudes, using the distance modulus given by Richer et al. (1998), and normalized the simulated and observed LFs so that the peaks match in terms of magnitude and number. This required a shift of magnitudes which is representative of uncertainty in the cluster age: Richer et al. (1998) find a WD cooling age of Gyr and a MS turn-off age of Gyr. The normalization reveals that the observations are incomplete by a factor of in the next faintest magnitude bin after the peak and that the observed LF has too many hot WDs (by a factor of 4 for bins), assuming that the simulated LFs are to be believed. Performing a test with each of our three distinct -body data sets in turn shows that the observed LF is most likely drawn from the same population as the models with a 40% binary fraction (probability of 0.46) – a heartening result considering that Richer et al. (1998) quote a binary fraction of 50% for M67. Based on the number of giants present in the M67 CMD Richer et al. (1998) estimate that they have only found of the expected number of WDs with cooling ages Gyr. They also find that the mass fraction of WDs is 0.09 which is approximately half the number predicted by our 40% binary model at Gyr, which itself is very similar to the observed parameters of M67. Therefore, we agree that M67 appears deficient in hot WDs, indicating that dynamical interactions have been efficient in destroying hot WDs in this cluster.
The problems with foreground and background contamination that plague the interpretation of observations of open clusters such as M67 are not as severe in the case of the rich open cluster NGC (Kalirai et al., 2001b). Even though the photometry for NGC does not reach down to the termination of the WD sequence, the improved quality of the data (and better choice of filters) makes it possible to compare the upper part of the WD sequence with our cluster models. Figure 10a shows the potential WD candidates found in the CMD of NGC by Kalirai et al. (2001b), including only objects that have stellarity index of 0.75 or greater (where 0 is most likely a galaxy and 1 is definitely a star). We note the existence of what appears to be two distinct WD sequences, where the brighter sequence is not consistent with being a population of background WDs with higher reddening nor can it be reproduced by a spread in WD masses (J. Kalirai, private communication, 2002). The age of NGC is reported to be Gyr (Rosvick & VandenBerg, 1998; Kalirai et al., 2001b) so in Figures 10b, c, and d, we show the WD CMDs for our simulated clusters with 0%, 10%, and 50% binaries, respectively, at an age of Gyr. For the sake of comparison we have added photometric error to the -body data points in order to give an impression of how an observed WD sequence would appear (for a large open cluster) if all WDs were detected. The photometric error has been estimated using a rather simple expression that is basically Gaussian noise with a spread of mags, where we have assumed in this instance. The value of is given by , where is the magnitude of interest, and it is used to mimic the increasing error for decreasing brightness. A simple comparison by eye of the CMDs shown in Figure 10 indicates that the bright sequence of WDs in the NGC CMD could very well be the detection of a population of double-WDs in the cluster and, if this is the case, that NGC most likely had a large fraction of primordial binaries. To aid the comparison we have merged Figures 10a and 10d with the result shown in Figure 11.
Although these two short examples have not lead to any statistically significant conclusions we maintain that they have served the purpose of demonstrating that comparisons of -body models with observations of star clusters will lead to a better understanding of the nature of cluster WD populations. For open clusters we now have the tools in place to produce realistic model clusters which can be compared with real clusters on a star-to-star basis. It will be particularly informative to tailor a set of simulations to an actual open cluster for which good quality data exists, such as NGC, with the initial conditions of the model hopefully constrained by observations. Such an approach will rely on close collaboration between stellar dynamicists and observers, and efforts in this direction are already underway.
Finally we would like to comment on what our results can say about the excellent data set provided by HST observations of the globular cluster M4 (Richer et al., 2002; Hansen et al., 2002) – even though our -body models fall far short of the particle number required for a globular cluster simulation. For M4 Hansen et al. (2002) used the method of fitting the entire WD LF to derive an age of Gyr for the cluster. In doing so they assumed an IMF slope of and they claim that the result is robust to changes in as long as it remains in the range of . Their choice of was based on a comparison of the number counts of WDs to low-mass MS stars in the cluster (Richer et al., 2002). Our simulations have shown that as a star cluster evolves the value of the IMF slope inferred from the WD population steepens while the mass function of MS stars is flattened, primarily owing to stripping of stars from the cluster by the Galactic tidal field. M4 is not known to be a post-core-collapse cluster (Harris, 1996) so it is not dynamically old, but its current half-mass relaxation timescale is estimated to be of the order of Myr (Harris, 1996). A conservative estimate of its dynamical age is probably in the range of half-mass relaxation times old, considering that our -body models have generally passed through core-collapse by this point, and as such our results would predict that the WD LF should be well represented by a value of only slightly greater than the IMF value. However, considering the orbit of M4 and the findings of Vesperini & Heggie (1997), we would expect the mass function of MS stars to have been significantly flattened at the low-mass end. Furthermore, Kroupa, Tout & Gilmore (1993) have shown that for field stars the IMF slope for low-mass stars is considerably flatter ( for ) than for stars in the WD-producing mass range. As a result we find it surprising that the WD LF of M4 could be well fitted using such a low value of . This could indicate that for M4 stellar interactions have been very effective in removing many of the hotter WDs (cf. the discussion of M67 above), an explanation that can also support arguments that the IMF of M4 was steeper than the PDMF quoted by Richer et al. (2002) while preserving the observed number counts. However, M4 is not a particularly dense globular cluster. Perhaps this is evidence that the IMF of M4 is different from that of field stars but it is more likely that subtle effects, such as the stellar evolution age of M4 being much greater than our -body models, lead to differences in the evolution of the WD LF compared to our open cluster models.
8 Summary
To first order the WD population of a star cluster is relatively unaffected by the dynamical evolution of the cluster. However, segregation of the progenitor stars of the WDs, or binaries containing these progenitors, towards the centre of the cluster and the stripping of low-mass stars by the Galactic tidal field, affects both the appearance of the WD population and the WD mass fraction. In this work we have utilised the results of realistic -body simulations of large open clusters to illustrate and quantify the behaviour of WDs in dense star clusters.
We find that the presence of a substantial binary population in a star cluster, and the interaction of this population with the cluster environment, leads to a noticeable contamination of the observed WD sequence in the CMD by non-standard single-WDs and double-WD binaries. Scatter in the WD sequence produced by this contamination makes it difficult to judge the true bottom of the standard WD sequence, especially if a large population of old double-WDs exists. This can lead to significant errors in the derived WD cooling age for the cluster. However, provided that the full extent of the WD sequence has been observed, the presence of non-standard single-WDs and double-WDs in the WD LF does not affect the location of the LF peak. So ages measured by this technique do not suffer any additional error. The shape of the LF is affected by the presence of non-standard WDs which produces an uncertainty in the inferred slope of the IMF. The amount of contamination of the WD LF by non-standard single-WDs is proportional to the number of double-WDs in the cluster which itself is linked to the primordial binary fraction of the cluster – if the number of double-WDs observed in a real WD sequence is low then it is safe to assume that the number of non-standard single-WDs is also low. Furthermore, the dynamical evolution of the cluster hampers the use of WDs as tracers of the IMF.
The results of our -body simulations suggest that observations of star clusters should be conducted slightly interior to the half-mass radius of the cluster in order to best obtain information about the IMF from the WD LF. This region provides a compromise between our suggestion in Section 3 that contamination of the WD sequence by double-WDs is less of a problem exterior to and our findings in Section 5 that the true present-day mass function for single-WDs is recovered for , at least for clusters less than half-mass relaxation times old. For dynamically evolved star clusters the WD LF cannot be used to recover information about the slope of the IMF, regardless of the primordial binary fraction of the cluster. Our findings are particularly instructive for future HST observations of globular clusters where it is only possible to observe a portion of the cluster. Vesperini & Heggie (1997) have shown that for clusters having undergone substantial dynamical evolution the PDMF for all cluster stars bears no relation to the IMF, even near the half-mass radius. This is especially true for globular clusters with orbits closer than kpc to the Galactic centre. Considering that large globular clusters are at an intermediate dynamical age, and that the PDMF of MS stars loses memory of the IMF earlier than does the WD population, then observations of the WD LF near the half-mass radius may be the best way to learn about the IMF of these objects. For open clusters it is generally possible to observe the entire cluster, at least for nearby clusters. In this case there is the option to restrict the LF to only include WDs found in a certain region of the cluster. However, considering that open clusters contain fewer stars than globulars, this is a counterintuitive action in terms of obtaining a statistically significant result. Furthermore, open clusters are observed to have relatively high binary fractions (Richer et al. 1998, for example) so contamination of the WD sequence by non-standard single WDs and double-WDs will be more of a problem. Therefore, we recommend that fitting of the WD LF for open clusters takes into account the evolution of binaries and the cluster environment.
Our simulations have also shown that the WD mass fraction of a cluster is altered by the kinematic evolution of the cluster provided that it is more than a few relaxation times old. For a large open cluster after Gyr of evolution, such as M67, the WD mass fraction is double the value expected from the same population evolved outside of the cluster environment. This enhancement of the WD mass fraction is primarily explained by the preferential escape of low-mass stars from the cluster and this result should be taken as a lower limit to the enhancement expected in moderate-size globular clusters. We find that enhancement of the WD mass fraction is not particularly sensitive to the primordial binary fraction of a star cluster. The expected number ratio of giants to WDs is preserved in our simulated clusters even though the two populations are affected in different ways by their residence in a cluster. Observation of this quantity is therefore one way to extract information about the IMF of an open cluster. Here, and in all instances, we must be very careful about scaling the results of our simulations to large- globular clusters. Additional depletion of giants may be expected in the centres of globular clusters which typically have much higher stellar densities than our models. Direct simulations of this type will be performed in the near future, providing additional information about the behaviour of WDs, and all populations for that matter, in star clusters. Future models will also address the potential uncertainty in our results eminating from uncertainties in the parameters of binary evolution.
References
- Aarseth (1999) Aarseth, S.J. 1999, PASP, 111, 1333
- Aarseth & Heggie (1998) Aarseth, S.J., & Heggie, D.C. 1998, MNRAS, 297, 794
- Aarseth, Hénon & Wielen (1974) Aarseth, S., Hénon, M., & Wielen, R. 1974, A&A, 37, 183
- Andreuzzi et al. (2002) Andreuzzi, G., Richer, H.B., Limongi, M., & Bolte, M. 2002, A&A, 390, 961
- Baumgardt & Makino (2002) Baumgardt, H., & Makino, J. 2002, MNRAS, accepted for publication (astro-ph/0211471)
- Benacquista (1999) Benacquista, M. 1999, ApJ, 520, 233
- Bergeron, Wesemael & Beauchamp (1995) Bergeron, P., Wesemael, F., & Beauchamp, A. 1995, PASP, 107, 1047
- Bergeron, Ruiz & Leggett (1997) Bergeron, P., Ruiz, M.T., & Leggett, S.K. 1997, ApJS, 108, 339
- Brocato, Castellani & Romaniello (1999) Brocato, E., Castellani, V., & Romaniello, M. 1999, A&A, 345, 499
- Chernoff & Weinberg (1990) Chernoff, D.F., & Weinberg, M.D. 1990, ApJ, 351, 121
- Côté & Fischer (1996) Côté, P., & Fischer, P. 1996, AJ, 112, 565
- Davies (1995) Davies, M.B. 1995, MNRAS, 276, 887
- Duquennoy & Mayor (1991) Duquennoy, A., & Mayor M. 1991, A&A, 248, 485
- Eggleton, Fitchett & Tout (1989) Eggleton, P.P., Fitchett, M., & Tout C.A. 1989, ApJ, 347, 998
- Ferraro et al. (1999) Ferraro, F.R., Paltrinieri, B., Rood, R.T., & Dorman, B. 1999, ApJ, 522, 983
- Giersz & Heggie (1997) Giersz, M., & Heggie, D.C. 1997, MNRAS, 286, 709
- Goodman (1987) Goodman, J. 1987, ApJ, 313, 576
- Han (1998) Han Z. 1998, MNRAS, 296, 1019
- Han, Podsiadlowski & Eggleton (1994) Han, Z., Podsiadlowski, Ph., & Eggleton, P.P. 1994, MNRAS, 270, 121
- Hansen (1998) Hansen, B.M.S. 1998, Nature, 394, 860
- Hansen (1999) Hansen, B.M.S. 1999, ApJ, 520, 680
- Hansen et al. (2002) Hansen, B.M.S., Brewer, J., Fahlman, G.G., Gibson, B.K., Ibata, R., Limongi, M., Rich, R.M., Richer, H.B., Shara, M.M., & Stetson, P.B. 2002, ApJ, 574, L155
- Harris (1996) Harris, W.E. 1996, AJ, 112, 1487
- Heggie (1975) Heggie, D.C. 1975, MNRAS, 173, 729
- Hurley, Pols & Tout (2000) Hurley, J.R., Pols, O.R., & Tout, C.A. 2000, MNRAS, 315, 543
- Hurley et al. (2001) Hurley, J. R., Tout, C. A., Aarseth, S. J., & Pols, O.R. 2001, MNRAS, 323, 630
- Hurley & Shara (2002a) Hurley, J.R., & Shara, M.M. 2002a, ApJ, 565, 1251
- Hurley & Shara (2002b) Hurley, J.R., & Shara, M.M. 2002b, ApJ, 570, 184
- Hurley, Tout & Pols (2002) Hurley, J.R., Tout, C. A., & Pols, O.R. 2002, MNRAS, 329, 897
- Iben & Livio (1993) Iben, I.-Jr., & Livio, M. 1993, PASP, 105, 1373
- Iben & Tutukov (1984) Iben, I.Jr., & Tutukov, A.V. 1984, ApJ, 282, 615
- Jeffries (1997) Jeffries, R.D. 1997, MNRAS, 288, 585
- Kalirai et al. (2001a) Kalirai, J.S., Richer, H.B., Fahlman, G.G., Cuillandre, J.-C., Ventura, P., D’Antona, F., Bertin, E., Marconi, G., & Durrell, P.R. 2001a, AJ, 122, 257
- Kalirai et al. (2001b) Kalirai, J.S., Richer, H.B., Fahlman, G.G., Cuillandre, J.-C., Ventura, P., D’Antona, F., Bertin, E., Marconi, G., & Durrell, P.R. 2001b, AJ, 122, 266
- Kalirai et al. (2001c) Kalirai, J.S., Ventura, P., Richer, H.B., Fahlman, G.G., Durrell, P.R., D’Antona, F., & Marconi, G. 2001c, AJ, 122, 3239
- King (1966) King, I.R. 1966, AJ, 71, 64
- Koester (2002) Koester, D. 2002, A&A Rev., 11, 33
- Kroupa (1995) Kroupa, P. 1995, MNRAS, 277, 1491
- Kroupa, Tout & Gilmore (1991) Kroupa, P., Tout, C. A., & Gilmore, G. 1991, MNRAS, 251, 293
- Kroupa, Tout & Gilmore (1993) Kroupa, P., Tout, C. A., & Gilmore, G. 1993, MNRAS, 262, 545
- Makino & Taiji (1998) Makino, J., & Taiji, M. 1998, Scientific Simulations with Special-Purpose Computers – the GRAPE Systems (New York: Wiley)
- Maxted, Marsh & Moran (2002) Maxted, P.F.L., Marsh, T.R., & Moran, C.K.J. 2002, MNRAS, 332, 745
- McCook & Sion (1999) McCook, G.P., & Sion, E.M. 1999, ApJS, 121, 1
- Mestel (1952) Mestel, L. 1952, MNRAS, 112, 583
- Meylan & Heggie (1997) Meylan, G., & Heggie, D. 1997, A&A Rev., 8, 1
- Montgomery, Marschall & Janes (1993) Montgomery, K.A., Marschall, L.A., & Janes K.A. 1993, AJ, 106, 181
- Nelemans et al. (2001) Nelemans, G., Yungelson, L.R., Portegies Zwart, S.F., & Verbunt, F. 2001, A&A, 365, 491
- Nelson & Eggleton (2001) Nelson, C A., & Eggleton, P.P. 2001, ApJ, 552, 664
- Peterson, Rees & Cudworth (1995) Peterson, R.C., Rees, R.F., & Cudworth, K.M. 1995, ApJ, 443, 124
- Pols et al. (1998) Pols, O.R., Schröder, K.P., Hurley, J.R., Tout, C.A., & Eggleton P.P. 1998, MNRAS, 298, 525
- Portegies Zwart et al. (2001) Portegies Zwart, S.F., McMillan, S.L.W., Hut, P., & Makino, J. 2001, MNRAS, 321, 199
- Renzini et al. (1996) Renzini, A., Bragaglia, A., Ferraro, F.R., Gilmozzi, R., Ortolani, S., Holberg, J.B., Liebert, J., Wesemael, F., & Bohlin, R. 1996, ApJ, 465, L23
- Richer et al. (1996) Richer, H.B., et al. 1996, in ASP Conf. Ser. 90, The Origins, Evolution and Destinies of Binary Stars in Clusters, ed. E.F. Milone & J.-C. Mermilliod (San Francisco: ASP), 65
- Richer et al. (1998) Richer, H.B., Fahlman, G.G., Rosvick, J., & Ibata, R. 1998, ApJ, 116, L91
- Richer et al. (2002) Richer, H.B., Brewer, J., Fahlman, G.G., Gibson, B.K., Hansen, B.M., Ibata, R., Kalirai, J.S., Limongi, M., Rich, R.M., Saviane, I., Shara, M.M., & Stetson, P.B. 2002, ApJ, 574, L151
- Rosvick & VandenBerg (1998) Rosvick, J.M., & VandenBerg, D. 1998, AJ, 115, 1516
- Salpeter (1955) Salpeter, E.E. 1955, ApJ, 121, 161
- Schmidt (1959) Schmidt, M. 1959, ApJ, 129, 243
- Shara & Hurley (2002) Shara, M.M., & Hurley, J. R. 2002, ApJ, 571, 830
- Tout et al. (1997) Tout, C.A., Aarseth S.J., Pols O.R., & Eggleton P.P. 1997, MNRAS, 291, 732
- Tout (1991) Tout, C.A. 1991, MNRAS, 250, 701
- Vesperini & Heggie (1997) Vesperini, E., & Heggie, D.C. 1997, MNRAS, 289, 898
- von Hippel (1998) von Hippel, T. 1998, AJ, 115, 1536
- von Hippel, Gilmore & Jones (1995) von Hippel, T., Gilmore, G., & Jones, D.H.P. 1995, MNRAS, 273, L39
- von Hippel & Gilmore (2000) von Hippel, T., & Gilmore, G. 2000, AJ, 120, 1384
- Weidemann (1987) Weidemann, V. 1987, A&A, 188, 74
- Zoccali et al. (2001) Zoccali, M., Renzini, A., Ortolani, S., Bragaglia, A., Bohlin, R., Carretta, E., Ferraro, F.R., Gilmozzi, R., Holberg, J.B., Marconi, G., Rich, R.M., & Wesemael, F. 2001, ApJ, 553, 733


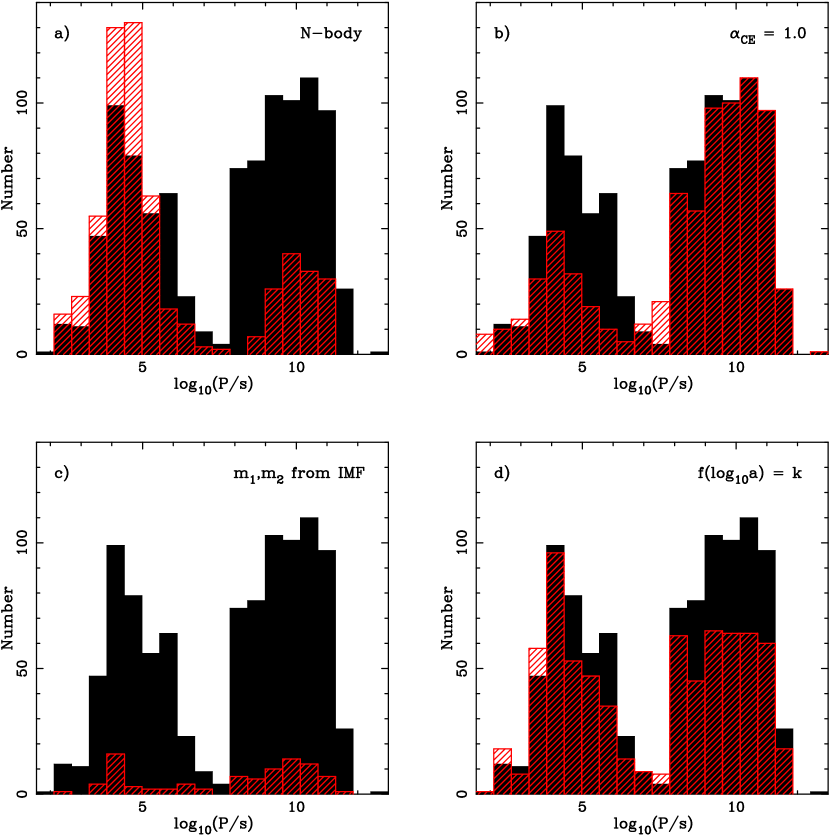

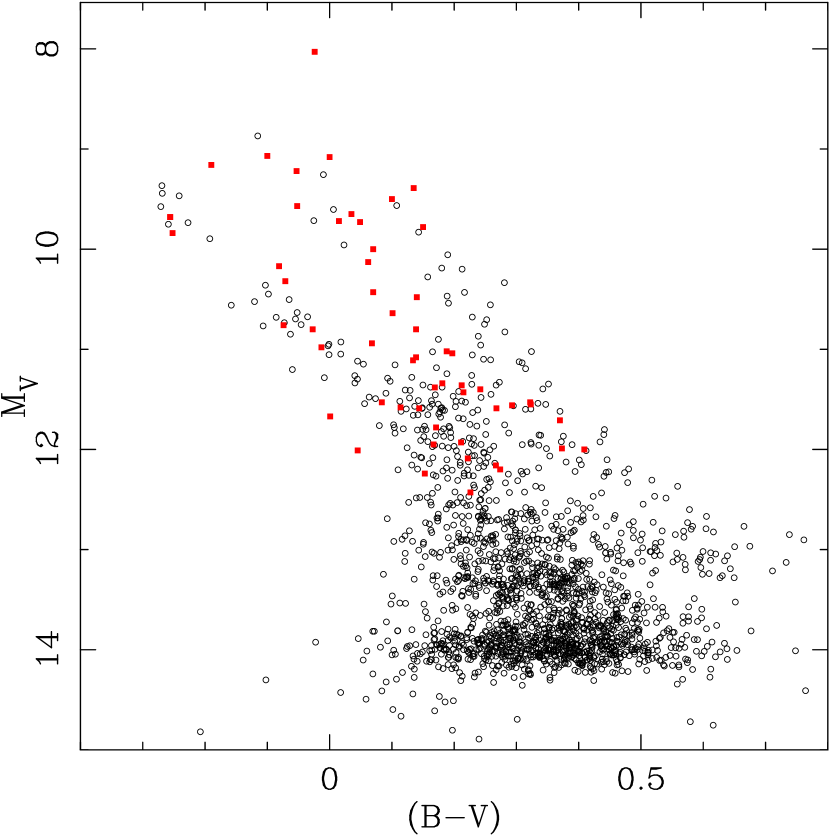
| Age | all WDs | () | () | st. sgl-WDs | () | () | ||||||
|---|---|---|---|---|---|---|---|---|---|---|---|---|
| (Gyr) | Prob | Prob | Prob | Prob | Prob | Prob | ||||||
| 1.0 | 2.75 | 0.93 | 3.55 | 0.24 | 2.40 | 0.28 | 2.70 | 0.87 | 3.15 | 0.89 | 2.15 | 0.31 |
| 2.0 | 3.00 | 0.43 | 3.65 | 0.16 | 2.75 | 0.65 | 2.80 | 0.76 | 3.20 | 0.85 | 2.65 | 0.97 |
| 4.0 | 3.75 | 0.30 | 3.90 | 0.86 | 3.55 | 0.26 | 3.15 | 0.65 | 3.30 | 0.94 | 3.00 | 0.46 |
| Age | all WDs | () | () | st. sgl-WDs | () | () | ||||||
|---|---|---|---|---|---|---|---|---|---|---|---|---|
| (Gyr) | Prob | Prob | Prob | Prob | Prob | Prob | ||||||
| 1.0 | 2.70 | 0.92 | 3.30 | 0.69 | 2.00 | 0.10 | 2.70 | 0.88 | 2.90 | 0.89 | 2.00 | 0.08 |
| 2.0 | 3.20 | 0.35 | 3.45 | 0.07 | 2.35 | 0.40 | 2.75 | 0.26 | 3.20 | 0.06 | 2.25 | 0.68 |
| 4.0 | 3.40 | 0.62 | 3.55 | 0.77 | 3.25 | 0.83 | 3.05 | 0.82 | 3.30 | 0.93 | 3.00 | 0.93 |
| Age | all WDs | () | () | st. sgl-WDs | () | () | ||||||
|---|---|---|---|---|---|---|---|---|---|---|---|---|
| (Gyr) | Prob | Prob | Prob | Prob | Prob | Prob | ||||||
| 1.0 | 2.70 | 0.97 | 2.95 | 0.88 | 2.15 | 0.47 | 2.70 | 0.97 | 2.95 | 0.88 | 2.15 | 0.47 |
| 2.0 | 2.80 | 0.89 | 2.95 | 0.83 | 2.05 | 0.99 | 2.80 | 0.90 | 2.95 | 0.82 | 2.05 | 0.99 |
| 4.0 | 3.05 | 0.66 | 3.15 | 0.90 | 3.05 | 0.80 | 3.05 | 0.67 | 3.15 | 0.91 | 3.05 | 0.79 |
| Simulation | ||||||
|---|---|---|---|---|---|---|
| , | 694 | 230 | 162 | 0.49 | 0.136 | 0.410 |
| , | 213 | 36 | 109 | 0.61 | 0.030 | 0.176 |
| , | 8 | 4 | 42 | 0.62 | 0.004 | 0.008 |
| Model | Prob | Prob | ||
|---|---|---|---|---|
| STD | 0.09 | 3.15 | 0.48 | - |
| CE1 | 0.07 | 3.15 | 0.75 | 0.98 |
| IMF | 0.01 | 2.55 | 0.99 | 0.00 |
| SEP | 0.06 | 2.90 | 0.88 | 0.09 |