The XMM-Newton View of the Nucleus of NGC 4261
Abstract
We present the first results from an XMM-Newton observation of the FRI galaxy NGC 4261, which harbors a supermassive black hole and a low-ionization nuclear emission-line region (LINER). Here we focus on the X-ray properties of the nucleus, using the EPIC pn data. The 0.6–10 keV continuum in best fitted by a thermal component with keV, plus a power law with photon index , absorbed by a column density N cm-2. An unresolved Fe K emission line with EW 280 eV is detected at 7 keV. We also detect, for the first time, short-term flux variability from the nucleus, on a timescale of 3–5 ks. The short-term variations rule out an ADAF as the only production mechanism of the X-ray continuum. Instead, we argue that the inner jet contributes to the emission in the X-ray band.
Subject Headings: galaxies: active; galaxies: jets; galaxies: elliptical and lenticular, cD; X-rays: galaxies; galaxies: individual (NGC 4261, 3C 270)
1 Introduction
In recent years, it was established that many nearby galaxies contain supermassive black holes (e.g., Gebhardt et al. 2000). However, weak or no activity is usually detected from their cores, in the optical or X-ray band (Loewenstein et al. 2001; Kormendy & Ho 2000). This is puzzling, as at least in early-type galaxies large reservoirs of gas to feed the central black holes are available in the form of hot, diffuse galaxy halos (e.g., Fabian & Canizares 1988).
The nearby ( 41 Mpc) giant elliptical NGC 4261/3C270 contains a supermassive black hole of known mass, (Ferrarese, Ford, & Jaffe 1996). It is one of a handful of early-type galaxies where low-luminosity nuclear activity is detected. In the radio band, it exhibits a Fanaroff-Riley type I (FRI; Fanaroff & Riley 1974) morphology, with a compact core and twin jets extending E-W, oriented at ∘ with respect to the line of sight (Piner, Jones, & Wehrle 2001). Optical spectroscopy reveals a Low-Ionization Nuclear Emission-Line Region (LINER; Heckman 1980) in the nucleus of the galaxy (Ho, Filippenko, & Sargent 1995). In the X-ray band, diffuse thermal emission with keV is present at low energies in ROSAT images (Worrall & Birkinshaw 1994). At hard X-rays, a point source is detected at the position of the radio core in a recent Chandra image; its continuum is described by a power law with photon index , excess column density N cm-2, and intrinsic luminosity L erg s-1 (Chiaberge et al. 2002). Interestingly, an unresolved narrow ( keV) Fe K line was marginally detected at 6–7 keV with ASCA (Terashima et al. 2002; Sambruna, Eracleous, & Mushotzky 1999).
NGC 4261 exhibits significantly different optical and X-ray properties from the more luminous, broad-lined radio-loud sources (e.g., Sambruna et al. 1999 and discussion therein). It was indeed suggested that the accretion process in NGC 4261 proceeds through an Advection-Dominated Accretion Flow (Ho 1999), or that beamed emission from the jet dominates the energy production in this source (Chiaberge et al. 2002 and references therein). NGC 4261 qualifies as an important link to understand the transition from low- to high-power radio sources.
To study its nuclear X-ray properties in more detail, we acquired an XMM-Newton observation of NGC 4261. In this Letter, we present a study of the nuclear properties using the more sensitive EPIC pn data. The archival Chandra image is also used to constrain the spatial properties of the galaxy within the EPIC extraction region. A more detailed study of the XMM-Newton data will be presented in Gliozzi et al. (2003). The observations and the data reduction are described in § 2. In § 3 we give the results and discuss their significance. Throughout the paper we use a Friedman cosmology with .
2 Observations And Data Reduction
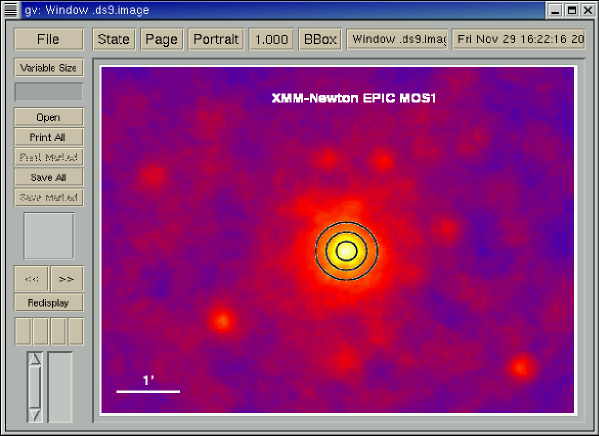
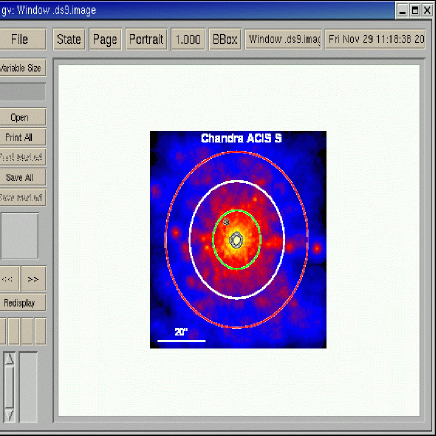
We first used an archival 34 ks Chandra observation, obtained on 2000 May 6, to quantify the spatial properties of the source within the XMM-Newton extraction radius. Figure 1 (bottom panel) shows the Chandra ACIS-S3 image from 0.2–2 keV, with the hard X-ray (2–10 keV) contours overlaid. X-ray emission from the core, the E-W jet, the diffuse galaxy halo, and several point sources are apparent (Gliozzi et al. 2003, Chiaberge et al. 2002). Superposed on the Chandra image are the EPIC extraction radii of 10′′, 20′′, and 30′′. Within 10′′, only one point source (RA=, DEC=49′36′′) is present; its contribution to the total X-ray flux is negligible, amounting to less than 2%. At larger radii, the relative contribution of the halo, resolved jet, and point sources increases. A detailed energy-dependent spatial analysis of the ACIS image will be presented in Gliozzi et al. (2003). Here, we only note that a point source at the position of the nucleus is present at ultra-soft energies, 0.3–0.8 keV, together with faint diffuse emission. The diffuse halo contribution is strongest at intermediate energies, 0.8–2 keV, where its spectrum peaks.
The XMM-Newton observation of NGC 4261 was carried out on 2001 October 16 (revolution 370). Only half of the proposed exposure was awarded, for a total of 30 ks. Here we report the results from the EPIC CCDs mainly from the pn camera, because of its higher sensitivity. The recorded events were reprocessed and screened with the latest available release of the XMM-Newton Science Analysis Software (SAS 5.3.3), retaining only events corresponding to patterns 0–12 (singles, doubles, triples and quadruples). After removing periods of background flares, the net exposure is ks. In an extraction radius of 10′′, the EPIC pn count rate in the 0.6–10 keV band is counts s-1.
The source data were extracted from circular regions of different radii ranging from 10′′ to 30′′ (Figure 1). A radius of 30′′ corresponds to the maximum value before reaching the edge of chip 4 in the pn camera. A radius of 10′′ was finally chosen for the spectral analysis of the EPIC pn data because it minimizes the contribution of the extended components and point sources. A radius of 30′′ was instead used for the light curves in order to have enough photons for the timing analysis at hard X-rays (none of the point sources included in this radius is demonstrably variable in the Chandra observation). For each extraction radius, the count rate was corrected using the encircled energy function and point spread function implemented in the SAS task arfgen. Background data were extracted from source-free circular regions (r=30′′) on the same chip containing the central source. There are no signs of pile-up according to the SAS task epatplot.
3 Results and Discussion
3.1 Detection of Flux Variability
The 0.3–10 keV EPIC pn light curve from an extraction radius of 30′′ is shown in Figure 2. Low-amplitude flux variability is present, with flux excursions of a factor 1.3 (maximum/minimum) on timescales of 3 ks. A test yields a probability that the flux is constant of only P=2.5%. To verify that the variability originates in the nucleus, light curves were extracted from 20′′ and 10′′ radii. The probability increases with increasing extraction radius of the light curves, indicating a progressively larger dilution of the light curve by non-nuclear light in the larger extraction radii, and confirming that the variability is indeed of nuclear origin. We identify the source of the X-ray variations with the nuclear point source detected in the Chandra image. While no flux variability is present in the Chandra light curves of the nucleus (within 2′′ extraction radius), the uncertainties are very large.
We investigated possible energy-dependences of the flux variations in the EPIC data splitting the total 0.3–10 keV band into sub-bands containing enough counts to perform the test. We find significant flux changes at hard (2–10 keV) and ultra-soft (0.3–0.8 keV) energies, with P=6% and 0.3%, respectively. As shown in Figure 2, in both energy bands the flux changes by a factor 1.5 on timescales 3–5 ks (minimum to maximum) but with different variability patterns. At intermediate energies, 0.8–2 keV, no flux variations are detected in the EPIC light curve (P=75%), due to the presence of the spatially-extended thermal component that dilutes the nuclear light. Note that a non-thermal component is present in the spectrum at ultra-soft energies (see below).
Erratic spectral variations are also present in the plot of the hardness ratio, 0.3–0.8 keV/2–10 keV, versus time (P 0.8%). However, there are not enough counts to perform a detailed spectral analysis as a function of time.
The detection of short-term flux variations with EPIC poses a challenge for an origin of the X-ray continuum in an Advection Dominated Accretion Flow (ADAF), the favored accretion-flow structure in low-luminsity AGNs and accretion-powered LINERs (e.g., Ho 1999). In an ADAF, the X-ray emission comes from a large volume and relatively long (1 day) variability timescales are expected, as indeed observed with ASCA (Terashima et al. 2002; Ptak et al. 1998). More specifically, the light-crossing time of an ADAF of radius in NGC 4261 is given by s, where is the gravitational radius of the black hole. Since this time scale is about 2 orders of magnitude longer than the observed variability time scale, it is unlikely that the variable component of the X-ray band originates in an ADAF.
The variable component of the X-ray flux in NGC 4261 is more likely to be associated with the inner X-ray jet. However, the detection of a relatively strong Fe K line (see below) indicates that jet emission is not dominant over the entire observed X-ray band; another continuum production mechanism must be present. Alternatively, the X-ray continuum is produced in the jet but is only mildly beamed. This is the case if the jet has a fast spine and slower walls (e.g., Chiaberge et al. 2000 and references therein), and the observed X-ray continuum is produced by the decelerated plasma.
3.2 Excess X-ray Absorption in the Nucleus of NGC 4261
At first we focused the spectral analysis on the time-averaged EPIC pn
spectrum in the 0.6–10 keV range, where the instrument is best
calibrated, with an extraction radius of 10′′ (see
above). Following indications from previous X-ray observations, we
first fitted the spectrum with a thermal model (apec in
XSPEC v.11) plus a power law. The column density, obscuring
both components, was fixed at the Galactic value of N cm-2 (Dickey & Lockman 1990). The resulting fit is formally
acceptable ( for 136 degrees of freedom). However, the
resulting photon index () is flatter than in other
LINERs and weak-line radio galaxies like NGC 4261 (e.g., Terashima et
al. 2002; Sambruna et al. 1999).
The spectral fit is greatly improved ( for 135 d.o.f.) by using an absorbed power-law, which we associate with the nucleus. The column density of cold gas toward the nucleus, inferred from fitting this model to the data, is significantly in excess of the Galactic value, N cm-2, while . The measured flux of the absorbed power law component is F erg cm-2 s-1, and the intrinsic (absorption-corrected) luminosity is L erg s-1. Figure 3 shows the EPIC data with the model superposed. Line-like residuals are present in 0.7–0.9 keV, which could be due to an imperfect modelling of the thermal emission from the halo (Gliozzi et al. 2003).
Prompted by the results of the timing analysis, we investigated the X-ray continuum in the ultra-soft energy range 0.3–0.8 keV. Adding the lower-energy channels down to 0.3 keV requires an additional power law component, with a fit improvement of =11.5 for 1 additional dof. The photon index of the second power law is not well determined, and assuming that ultra-soft X-ray emission comes from the same region as the hard X-rays, it was linked to the index of the primary power law. This ultra-soft component accounts for a substantial fraction of the total counts in 0.3–0.8 keV (500 counts), larger than systematic calibration uncertainties. A similar ultra-soft non-thermal component is also required to fit the ACIS-S data (Gliozzi et al. 2003).
The XMM-Newton observation confirms the previous result from Chandra that excess X-ray absorption is present in NGC 4261 (Chiaberge et al. 2002). These authors argue that the cold absorbing gas is located in the nuclear dust lane visible in the HST images (Jaffe et al. 1996), if the dust-to-gas ratio in NGC 4261 is different from Galactic. In fact, assuming a Galactic ratio the reddening implied by the X-ray column is A mag, much larger than the extinction in the dust lane, A mag (Chiaberge et al. 2002). It is not unusual for Seyferts and other AGN to have X-ray column densities in excess of those expected from the optical reddening (e.g., Maiolino et al. 2001).
To investigate the possibility of an ionized X-ray absorber, we fitted the EPIC spectrum using a warm absorber (absori), acting on the power law only. The column density NW, ionization parameter , and temperature , were left free to vary while the Fe abundance was fixed to solar. We find an acceptable fit (), although not better than the fit with the cold absorber. The best-fit parameters, N cm-2, , erg cm s-1, and K, effectively mimic the case of a power law plus a cold absorber. This is not unexpected, as the crucial region 0.6–1 keV where most of the edges of ionized oxygen and other elements would be present is masked by the thermal component, preventing a meaningful determination of . We thus conclude that it is not possible to distinguish between a cold and warm absorber with the EPIC data based on absorption properties.
The connection between the X-ray and optical absorbing media in AGN has been challenged by several authors (e.g., Weingartner & Murray 2002). It is possible that the X-ray and optical absorbers are separate gas components, with the X-ray absorbing gas lying inside the large-scale obscuring torus, perhaps in the form of an ionized wind. Such a scenario may be applicable to NGC 4261 as well as other radio-loud AGNs, including some with broad optical emission lines (e.g., 3C 445 and Arp 102B; see Sambruna et al. 1999). Indeed, there is evidence that in Arp 102B the absorbing X-ray and UV medium has the form of an outflowing wind (Eracleous, Halpern, & Charlton 2003). We do note, however, that in broad-line objects the column density of the X-ray absorber is an order of magnitude smaller than what is measured in NGC 4261, which may indicate that in NGC 4261 we are observing the combined effect of more than one absorbing component.
3.3 Detection of an Fe K emission line
Inspection of the residuals of the best-fit continuum component shows a sharp line-like feature around 7 keV. Adding a Gaussian line to the thermal+absorbed power law continuum model improves the fit to the EPIC pn spectrum significantly, for 3 additional parameters (-test probability PF 90%). From the confidence contours of the line normalization versus its width, we derive that the line is detected (i.e., normalization larger than zero) at 95% confidence, and always unresolved. A broad ( 0.5 keV) line is not excluded at 90% confidence, with EW 490 eV.
We thus fixed the rest-energy dispersion to the spectral resolution of the EPIC pn in the Fe K range, eV. (Fixing the line width to much lower values does not change the results.) To determine if the Fe line is truly from the nuclear region, and not due to an imperfect modelling of the spectrum of the diffuse halo, we extracted EPIC pn spectra from increasingly larger radii and fitted them with the same spectral model (Table 1). The Fe K line at 7 keV is detected, and its significance increases with decreasing extraction radii.
We conclude that the Fe line originates in the nucleus. Its best-fit energy is consistent with the K emission of H-like Fe (6.95 and 6.97 keV). Its measured EW of 280 eV is consistent with the value measured by ASCA (550 eV, Terashima et al. 2002), and with the Chandra upper limit of 380 eV. An Fe K line at 7 keV is also present in an archival 40 ks BeppoSAX observation, with EW eV (Gliozzi et al. 2003).
The measured EW of the line, although subject to large uncertainties, is larger than the values measured for the Fe K line in broad-line radio-loud AGN at 6.4 keV, where EW 100 eV (e.g., Eracleous, Sambruna, & Mushotzky 2000; Woźniak et al. 1998). In particular, it is stronger than in sources where dilution from a beamed jet component is thought to be at least partially responsible for the low EW of the Fe K line, e.g., 3C 120. Note, however, that even in broad lined objects (as 3C 120 and 3C 390.3) there is a significant contribution to the X-ray continuum from the disk-corona based on spectral and timing properties (Gliozzi, Sambruna & Eracleous 2003). As discussed above, either radiation from the inner jet is not the dominant origin of the continuum emission in the nucleus of NGC 4261, or the X-ray continuum is produced in the slower walls of the jet.
As the uncertainties on the line profile in the modest EPIC exposure are large, we can only speculate on the line’s origin. An origin in an ionized disk (e.g., Ballantyne et al. 2002) is unlikely, as the accretion rate in NGC 4261 is relatively low compared to the Eddington rate. The disk ionization parameter has a strong dependence on the mass accretion rate, where (Matt, Fabian, & Ross 1993). To create H-like iron ions, is required, while in NGC 4261 (Sambruna et al. 1999).
A possible scenario for the formation of a narrow line is thermal emission from an ADAF outflow (Narayan & Raymond 2000). While short-term X-ray flux variability rules out an ADAF as the only mechanism of production of X-rays, it is still possible that an ADAF is present in NGC 4261, contributing a fraction of the X-rays including the Fe K line. In this model, the Fe line originates from large radii and is thus narrow, with expected EWs 200 eV. Also expected in this model are emission lines of lighter elements at softer X-rays, including highly ionized Ca and Ar in the energy range 3–4 keV, with EW of several tens of eV, to which we are not sensitive. The ratios of the line intensities would be a function of the outflow’s mass and radius (Narayan & Raymond 2000).
However, the large uncertainties on the line width do not allow us to exclude a broad line, or the presence of broad wings related to a standard accretion disk. A deeper X-ray exposure is needed for more meaningful constraints on the line profile.
3.4 NGC 4261 in perspective
It is interesting to compare NGC 4261 to more luminous radio-loud AGN previously studied in X-rays (e.g., Sambruna et al. 1999). In Figure 3c of that paper we presented a plot of the 2–10 keV luminosity of broad- and narrow-line radio-loud AGN versus their total 5 GHz power. Extrapolating the correlation for broad-lined galaxies to the lower X-ray luminosities, NGC 4261 is overluminous by 1.5 decades in extended radio power. This raises the interesting possibility that the faint nuclear emission from this galaxy is due to a very efficient channeling mechanism of its accretion power into the jets and the radio lobes. A similar scenario was indeed proposed for the FRI galaxy IC4296 (Pellegrini et al. 2002), which also hosts a LINER nucleus. In IC4296, the accretion rate would not be different from the Bondi accretion rate and the jet would account for a large fraction of the accretion power. The LINER spectra of both sources would thus be due to a diminished, isotropic optical-to-UV luminosity.
Whether or not an ADAF or a very efficient channeling mechanism (or a combination of the two) is present in NGC 4261, it is clear that the transition from high to low nuclear luminosities in radio-loud AGN corresponds to a change of nuclear properties. Because of its well known characteristics (black hole mass, inclination, pc-scale jet), NGC 4261 has a key role to play in the study this transition.
References
- (1)
- (2) Ballantyne, D.R., Ross, R.R., & Fabian, A.C. 2002, MNRAS, 332, 45
- (3)
- (4) Chiaberge, M. et al. 2002, ApJ, in press (astro-ph/0205156)
- (5)
- (6) Chiaberge, M., Celotti, A., Capetti, A. & Ghisellini, G. 2000, A&A, 358, 104
- (7)
- (8) Dickey, J.M., & Lockman, F.J. 1990, ARA&A, 28, 215
- (9)
- (10) Eracleous, M., Sambruna, R.M., & Mushotzky, R.F. 2000, ApJ, 537, 654
- (11)
- (12) Eracleous, M., Halpern, J. P., & Charlton, J. C. 2003, ApJ, in press (astro-ph/0209341)
- (13)
- (14) Fabian, A.C., & Canizares, C.R. 1988, Nature, 333, 829
- (15)
- (16) Fanaroff, B.L. & Riley, J.M. 1974, MNRAS, 167, P31
- (17)
- (18) Ferrarese, L. Ford, H.C., & Jaffe, W. 1996, ApJ, 470, 444
- (19)
- (20) Gebhardt, K. et al. 2000, ApJ, 539, L13
- (21)
- (22) Gliozzi, M., Sambruna, R., & Eracleous, M., 2003, ApJ in press (astro-ph/0210300)
- (23)
- (24) Gliozzi, M., Sambruna, R., et al. 2003, in prep.
- (25)
- (26) Heckman, T. M. 1980, A&A, 87, 152
- (27)
- (28) Ho, L.C. 1999, ApJ 516, 672
- (29)
- (30) Ho, L. C., Filippenko, A. V., & Sargent, W. L. W. 1995, ApJS, 98, 477
- (31)
- (32) Jaffe, W., Ford, H.C., Ferrarese, L., van den Bosch, F., & O’Connell, R.W. 1993, Nature, 364, 213
- (33)
- (34) Kormendy, J. & Ho, L.C. 2000, astro-ph/0003268
- (35)
- (36)
- (37)
- (38) Loewenstein, M. et al. 2001, ApJ, 555, L21
- (39)
- (40) Maiolino, R. et al. 2001, A&A, 365, 28
- (41)
- (42) Matt, G., Fabian, A.C., & Ross. R.R. 1993, MNRAS, 262, 179
- (43)
- (44) Narayan, R., & Raymond, J. 1999, ApJ, 515, L69
- (45)
- (46) Pellegrini, S. et al. 2002, ApJ, in press (astro-ph/0211322)
- (47)
- (48) Piner, B.G., Jones, D.L., & Wehrle, A.E. 2001, AJ, 122, 2954
- (49)
- (50) Ptak, A. et al. 1998, ApJ, 501, L37
- (51)
- (52) Sambruna, R.M., Eracleous, M., & Mushotzky, R.F. 1999, ApJ, 526, 60
- (53)
- (54) Terashima, Y., Kunieda, H., Misaki, K. et al. 1998 ApJ, 503, 212
- (55)
- (56) Weingartner, J.C. & Murray, N. 2002, ApJ, in press (astro-ph/0208123)
- (57)
- (58) Worrall, D.M., & Birkinshaw, M. 1994, ApJ, 427, 134
- (59)
- (60) Woźniak, P. R., Zdziarski, A. A., Smith, D., MAdejski, G. M., & Johnson, W. N. 1998, MNRAS, 299, 449
- (61)
| Parameter | r=10” | r=20” | r=30” |
|---|---|---|---|
| kT (keV) | |||
| Abundance | |||
| Photon Index | |||
| (keV) | |||
| EW (eV) | |||
| 136.50/133 | 221.23/185 | 251.12/212 | |
| 97 | 92 | 76 |