The superwind mass-loss rate of the metal-poor carbon star LI-LMC 1813 in the LMC cluster KMHK 1603††thanks: Based on observations collected at the European Southern Observatory, Chile (ESO N∘56.E-0681, 66.D-0318 & 68.D-0660)
Abstract
LI-LMC 1813 is a dust-enshrouded Asymptotic Giant Branch (AGB) star, located in the small open cluster KMHK 1603 near the rim of the Large Magellanic Cloud (LMC). Optical and infrared photometry between 0.5 and 60 m is obtained to constrain the spectral energy distribution of LI-LMC 1813. Near-infrared spectra unambiguously show it to be a carbon star. Modelling with the radiation transfer code Dusty yields accurate values for the bolometric luminosity, L⊙, and mass-loss rate, M⊙ yr-1. On the basis of colour-magnitude diagrams, the age of the cluster KMHK 1603 is estimated to be –1.0 Gyr, which implies a Zero-Age Main Sequence mass for LI-LMC 1813 of M⊙. This makes LI-LMC 1813 arguably the object with the most accurately and reliably determined (circum)stellar parameters amongst all carbon stars in the superwind phase.
keywords:
Stars: AGB and post-AGB – Stars: carbon – Stars: evolution – Stars: mass-loss – Magellanic Clouds – Infrared: stars.1 Introduction
In the final stages of their evolution, stars of main-sequence masses 0.8–8 M⊙ ascend the Asymptotic Giant Branch (AGB). The end-product of their evolution is a White Dwarf, with a typical mass of 0.5 M⊙. It is thus clear that near the tip of the AGB, stars must be losing most of their mass. The rate at which this occurs is estimated to be to M⊙ yr-1, much faster than the nuclear burning mass consumption rate which normally determines the rate of stellar evolution (van Loon et al. 1999b). Hence the mass loss is important for the subsequent evolution of the star, as well as for the chemical enrichment of the inter-stellar medium. Yet our knowledge and understanding of the mass-loss mechanism and the composition of the mass lost is incomplete.
Amongst the key factors in supporting a dense outflow from an AGB star are the low effective temperature, which allows for the formation of circum-stellar dust, and the high luminosity, which, through radiation pressure on the dust grains and collissional coupling between the dust and the gas, drives a stellar wind. Because the dust only forms at several stellar radii from the star, there has to be an additional mechanism to bring the gas into the dust formation region — possibly provided by strong radial pulsations (e.g. Bowen & Willson 1991).
Dynamical models for the circumstellar envelopes of AGB stars suggest that the mass-loss rate depends strongly on the stellar effective temperature, about (Arndt, Fleischer & Sedlmayr 1997). Although this seems to be confirmed for the onset of the dusty mass-loss epoch (Alard et al. 2001), it is not clear whether such strong temperature dependence is also valid during the so-called “superwind” phase where the AGB star is obscured by its optically thick circum-stellar envelope (van Loon et al. 1999b).
A dramatic change in the chemical composition of the mass lost occurs when an AGB star becomes a carbon star (Iben & Renzini 1983): during the temporal ignition of a helium-burning shell, situated in between the degenerate carbon/oxygen core and the hydrogen-burning shell, the convective mantle may reach the nuclear burning layer and transport nuclear burning products to the stellar surface ( dredge-up). These thermal pulses (TP) occur on timescales of – yr, and last only briefly. But over the course of TP-AGB evolution, the surface abundance of carbon may exceed that of oxygen, forming a carbon star. Due to the strong binding of the CO molecule, only the remaining oxygen or carbon is used to synthesize other molecules that nucleate to form dust grains in the circum-stellar envelope. Hence the circum-stellar chemistry of carbon stars is fundamentally different from that of oxygen-rich AGB stars.
There is a threshold mass above which dredge-up is strong enough to make a carbon star, roughly at M⊙ and mildly dependent on metallicity (Marigo, Girardi & Bressan 1999). However, in massive AGB stars, about M⊙, nuclear burning occurs within the bottom layers of the convective mantle, converting the carbon into nitrogen: Hot Bottom Burning (HBB). At the very end of AGB evolution, the diminished mantle mass as a result of prolonged mass loss causes HBB to cease, and a final thermal pulse may turn the star into a carbon star after all (Frost et al. 1998). These competing processes are likely to depend on the initial metallicity of the star.
Optical studies of the AGB population in the Large Magellanic Cloud (LMC) provide support for the dredge-up and HBB to govern the formation of carbon stars (e.g. Groenewegen & de Jong 1993; Marigo et al. 1999). Recent infrared (IR) studies could assess the effects of mass loss and possible observational bias in optical studies. These studies confirm the delayed formation of massive carbon stars after cessation of HBB, but also suggest that amongst AGB stars in the superwind phase oxygen-rich stars exist with masses below the threshold for HBB (Zijlstra et al. 1996; van Loon et al. 1997, 1998, 1999b; van Loon, Zijlstra & Groenewegen 1999a).
Much of the uncertainty with respect to the progenitor mass and initial metallicity of an individual AGB star can be alleviated if the star is a member of a co-eval stellar cluster. Optical studies provide a great number of such examples in LMC and SMC clusters, confirming the mass-range for optically bright carbon stars between 1–1.5 and 3–5 M⊙ (Frogel, Mould & Blanco 1990; Marigo, Girardi & Chiosi 1996; van Loon 2002).
Van Loon et al. (1998) noted that the oxygen-rich dust-enshrouded OH maser star IRAS 052986957 is located in the LMC cluster HS 327, and their discovery of an optically bright carbon star in the same cluster directly provided a value for the threshold mass above which HBB occurs: M⊙ (van Loon et al. 2001).
Tanabé et al. (1997) found one dust-enshrouded carbon star in each of the LMC clusters NGC 1783 and NGC 1978, and another one in the SMC cluster NGC 419. They all have moderate luminosities, L⊙, and progenitor masses, 1.5–1.6 M⊙. Their mass-loss rates are M⊙ yr-1, but the relatively long pulsation periods of 500 d indicate that they have already shed a significant fraction of their mass (Nishida et al. 2000).
The IRAS point source LI-LMC 1813 (IRAS 060256712) was identified as a candidate dust-enshrouded AGB star in the LMC by Loup et al. (1997). Its suspected nature was confirmed after the identification of the extremely red counterpart (van Loon et al. 1997), and it was later found to be coincident with an LMC cluster (van Loon 1999), KMHK 1603 (Kontizas et al. 1990). Kontizas et al. estimate that the number density of LMC star clusters in the direction of LI-LMC 1813 is 20 per square degree, with each cluster covering, on average, less than 1 square arcminute. Hence, in the direction of LI-LMC 1813, less than 0.6% of sky is covered by an LMC cluster. There are of order IRAS-selected AGB stars in the LMC (Loup et al. 1997; van Loon et al. 1997), most of which are concentrated towards the LMC bar. One does not therefore expect any chance coincidence of an IRAS-selected AGB star within the % of sky covered by an LMC cluster in this part of the LMC, rendering LI-LMC 1813 likely to be a physical member of the LMC cluster KMHK 1603.
We present here the results of extensive optical and IR imaging and spectroscopic follow-up observations of LI-LMC 1813 and the cluster KMHK 1603. We identify the dust-enshrouded AGB star as a carbon star, and derive accurate estimates for its progenitor mass, M⊙, and mass-loss rate, M⊙ yr-1, which we confront with theoretical models. Remarkably, the mass-loss rate is very high for this metal-poor ( solar) object.
2 The brightness of LI-LMC 1813
We have collected optical (Gunn g, r & i), near-IR (J, K & L′) and mid-IR (N) imaging data, which we combine with archival IR data (2MASS, Denis, MSX and IRAS) to describe the spectral energy distribution (SED) of LI-LMC 1813. These data are described in full in Appendix A1.
2.1 Images
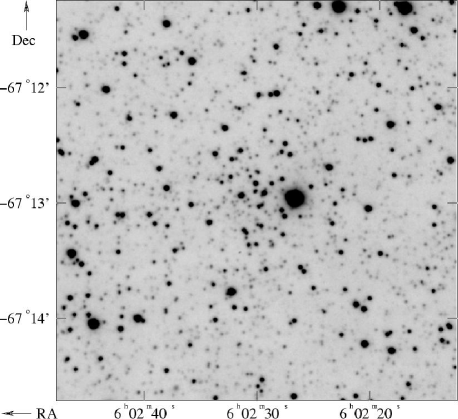
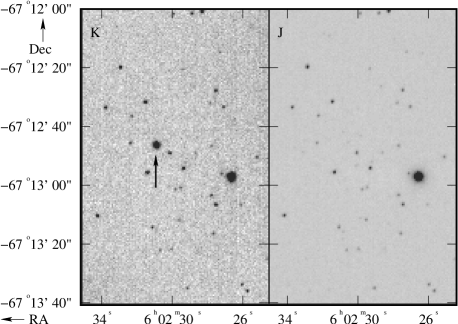
The moderately crowded optical images (Fig. 1) feature the sparse cluster KMHK 1603, dominated by the bright star KMHK 1603-1. At these wavelengths, LI-LMC 1813 is invisible. Undetected in the J-band, the brightness of LI-LMC 1813 in the K-band rivals that of KMHK 1603-1 (Fig. 2). These are the only two stars visible at 3 m, with LI-LMC 1813 by then outshining KMHK 1603-1. At even longer wavelengths, only LI-LMC 1813 is detected.
2.2 Photometry
| Band | Facility | Epoch | LI-LMC 1813 | KMHK 1603-1 | |||
| (m) | Photometry | 1- | Photometry | 1- | |||
| 0.515 | ESO/Dutch 0.9m | 27 Dec 1996 | 23.0 | 13.05 | |||
| 0.670 | ESO/Dutch 0.9m | 27 Dec 1996 | 23.0 | 13.06 | |||
| 0.797 | ESO/Dutch 0.9m | 27 Dec 1996 | 23.0 | 12.69 | |||
| Denis | 1995 — 1999 | 12.50 | |||||
| 1.25 | ESO/IRAC-2 | 2 Jan 1996 | 20.0 | 12.07 | 0.04 | ||
| Denis | 1995 — 1999 | 12.16 | |||||
| 2MASS | 26 Oct 1998 | 17.5 | 12.15 | 0.03 | |||
| 1.65 | 2MASS | 26 Oct 1998 | 15.59 | 0.15 | 11.87 | 0.04 | |
| 2.20 | ESO/IRAC-2 | 2 Jan 1996 | 13.26 | 0.02 | 11.80 | 0.02 | |
| 2MASS | 26 Oct 1998 | 12.87 | 0.04 | 11.80 | 0.03 | ||
| CTIO/OSIRIS | 6 Jul 2002 | 12.35 | 0.10 | ||||
| 3.78 | ESO/ISAAC | 19 Oct 2000 | 7.74 | 0.02 | 11.75 | 0.05 | |
| ESO/ISAAC | 14 Dec 2001 | 9.27 | 0.25 | ||||
| 8.28 | MSX | May 1996 — Feb 1997 | 0.204 | 0.013 | |||
| 10.6 | ESO/TIMMI-2 | 19 01 2001 | 0.60 | 0.05 | |||
| 12 | IRAS | 1983 | 0.40 | 0.03 | |||
| 25 | IRAS | 1983 | 0.25 | 0.02 | |||
| 60 | IRAS | 1983 | 0.10 | 0.04 | |||
The complete set of optical and infrared photometry in the range 0.5–60 m for LI-LMC 1813 is listed in Table 1. Also included in the table is photometry for KMHK 1603-1, whose IRAC-2, 2MASS and Denis magnitudes, which have been transformed onto the SAAO system (Carter 1990; Carpenter 2001), are in excellent agreement with each other.
2.3 Variability
A third epoch of K-band photometry is available from the acquisition image for the H+K-band spectroscopy in July 2002 (Appendix A2). The K-band magnitude of LI-LMC 1813 is obtained by assuming that the K-band magnitude of KMHK 1603-1 remained unchanged at mag.
A second epoch of L′-band photometry is obtained from the acquisition image taken for the L-band spectroscopy in December 2001 (Appendix A2). The L′-band magnitude of KMHK 1603-1 is assumed to have remained unchanged at mag (if the zero point were the same as that in October 2000, the L′-band magnitude of KMHK 1603-1 would be mag). Hence the L′-band magnitude of LI-LMC 1813 is mag, in excellent agreement with the flux-calibrated spectrum.

A sparse lightcurve is constructed from the differences of the three K-band and two L′-band magnitudes with their mean (Fig. 3): the variability of (obscured) AGB stars in the K and L′-bands are in phase with each other, and have similar amplitudes (see Whitelock et al. 2003). The data are consistent with a pulsation period of 680 d. If confirmed, this would be rather long but not unusual for highly evolved AGB stars (Wood 1998). The large L′-band amplitude of 1.6 mag might be due in part to temporal variations in the amount and temperature of the warm dust contributing to the IR excess at 3–4 m.
2.4 Interstellar extinction
The interstellar extinction towards the LMC is generally low (but see van Loon et al. 1997 for severely reddened background galaxies). From the reddening maps provided by Burstein & Heiles (1982), based on galaxy counts, the reddening towards LI-LMC 1813 is estimated to be mag. The reddening maps derived from the far-IR dust emission mapped by COBE/DIRBE (Schlegel, Finkbeiner & Davis 1998) yield a very consistent value of mag, which we adopt here. The spatial resolution of these maps is insufficient to detect differences in reddening over a few arcminutes, and therefore uniform reddening is assumed for the region within a radius of around KMHK 1603. This converts to an extinction of , 0.15 and 0.11 in the g, r and i-bands, and , 0.03, 0.02 and 0.01 mag in the J, H, K and L′-bands, respectively (Mathis 1990). The (uncorrected) photometry of Table 1 is corrected for this extinction before further analysis.
2.5 The distance to LI-LMC 1813
For the distance modulus of the LMC we adopt mag as derived by Groenewegen (2000) from the Cepheid period-luminosity relationship. However, the LMC is inclined, causing the distance modulus to vary across the face of the LMC. This is especially important for LI-LMC 1813, which is situated near the rim of the galaxy. Using the values for the centre, inclination and position angle of the nodes from van der Marel & Cioni (2001), the differential distance modulus with respect to the centre of the LMC is mag. Within an uncertainty of 0.2 mag, the distance modulus to LI-LMC 1813 then becomes mag.
3 The progenitor mass of LI-LMC 1813
The progenitor mass of LI-LMC 1813 may be estimated by isochrone-fitting to the colour-magnitude diagram of the stars in the cluster KMHK 1603.
3.1 Multi-object photometry
Multi-object photometry was performed on the optical images using an implementation of DAOPHOT (version ii) and ALLSTAR (Stetson 1987) within ESO-MIDAS. The reader is referred to van Loon et al. (2001) for a detailed description of the Point Spread Function (PSF), multi-object photometry and photometric calibration. As a result, sources were detected in each of the gri-bands in the square degree area around KMHK 1603. The completeness drops rapidly beyond 23 mag.
The point-sources were cross-correlated between the different filters after determining and applying a geometric transformation (rotation and linear translation), using an iterative scheme with a growing search radius and rejecting extended sources on the basis of the sharpness parameter returned by ALLSTAR. The photometry was then corrected for interstellar extinction as derived in section 2.4.
Because there are only objects visible in the near-IR images, and hence these images are not at all crowded, the near-IR photometry was obtained manually by aperture photometry. The photometry was transformed onto the SAAO system (see Appendix A1.2) and then corrected for interstellar extinction (section 2.4).
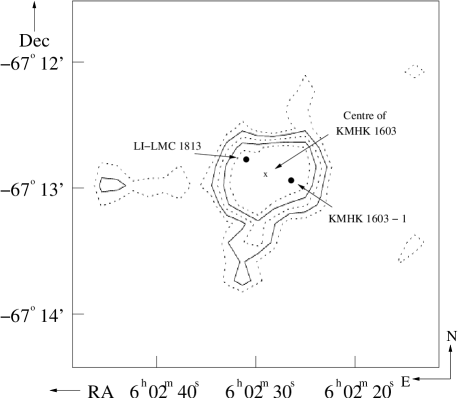
The surface density of stars in the g-band image was measured by counting stars with mag and sharpness , within a box which was successively moved across the image at steps of . The resulting contour map (Fig. 4) clearly shows the cluster KMHK 1603 as a region with a higher density of stars as compared to the surrounding field. The cluster appears to be somewhat elliptical, but for practical purposes we assume it to be spherical. The centre of the cluster is determined to be located at (J2000) RA and Dec.

The surface density of stars, as measured in annuli centred on the cluster, is given as a function of the radial distance in Fig. 5. The surface density in the core of the cluster is three times that of the field, and it drops to the field level at a radius of . With a (projected) distance to the cluster centre of , LI-LMC 1813 is located well within the cluster boundaries. To minimise contamination by field stars, the colour-magnitude diagrams of the cluster were constructed for stars within a smaller radius of .
3.2 The age and metallicity of KMHK 1603

The interstellar extinction-corrected versus colour-magnitude diagram is presented for the cluster KMHK 1603 (Fig. 6, left) and the surrounding field (Fig. 6, right). Also plotted are three isochrones from Bertelli et al. (1994), for a typical LMC metallicity of [M/H] and ages of 10 Gyr, 1 Gyr and 100 Myr, after transformation onto the photometric systems as described in detail in van Loon et al. (2003). These isochrones do not include the effects of circumstellar extinction.
Both the cluster and field show a well-populated Main Sequence up to an age of yr, and a red clump of core He-burning giants, at 1 and 18 mag, consistent with such intermediate or older ages. Although there are a number of field Main Sequence stars brighter than the yr Main Sequence turnoff, and corresponding RGB or AGB stars with 16 mag, there is a clear absence of stars younger than a few yr.

A close-up of the optical colour-magnitude diagram for the cluster stars (Fig. 7) reveals two populations: one of 1 Gyr and an older one of 2 Gyr. The younger population is traced by a Main Sequence turnoff (MS-TO) at 0.2 and 19.0 mag, clearly separated from the older population with a MS-TO at 0.4 and 19.8 mag. Both populations show a red clump at roughly the same location in the colour-magnitude diagram. The younger population stands out prominently amongst the stars in the direction of the cluster, but much less so in the field: counting stars with and mag ( 1 Gyr MS-TO: 1) and stars with and mag ( 2 Gyr MS-TO: 2), the ratio for the field but 0.42 in the direction of the cluster. Hence we identify the 1 Gyr stars with the cluster population, and the 2 Gyr stars with the field population. This is in good agreement with the star formation epochs around 1 and 2 Gyr that Smecker-Hane et al. (2002, their Fig. 5) find for another field in the LMC disk. There is also evidence for a younger population of several yr, both around KMHK 1603 (Fig. 6, right) and in the disk field studied by Smecker-Hane et al. (2002).
A better match to the optical colour-magnitude diagram of the cluster stars is obtained by an isochrone of slightly younger age, 800 Myr, yet the best match is obtained by an isochrone with 1 Gyr but with a somewhat lower metallicity of [M/H]. Smith et al. (2002) also argue that, with [M/H], LMC red giants with 3 M⊙ often have metallicities lower than what is normally taken as the canonical LMC metallicity, [M/H] to . Consequently, we also suspect that the older, a few Gyr-old, field population has a rather low metallicity of [M/H].

The near-IR colour-magnitude diagram does not distinguish very well between different intermediate-age populations (Fig. 8), but it is clear that the cluster population is not consistent with an age of much less than 1 Gyr (note that the 2MASS data sample a much larger area than the IRAC-2 data). The red clump is clearly visible in the cluster, at 0.5 and 17 mag.
The brightness of the red clump stars can be used as an age indicator. In the optical, the red clump in the cluster KMHK 1603 is observed at mag (Fig. 7) or, assuming that , at mag. This suggests an age of either Gyr or 1.22 Gyr for [M/H], and Gyr for [M/H] (Girardi & Salaris 2001, their Table 1). In the near-IR, the red clump is observed at mag, or mag. This suggests an age of either Gyr or 1.32 Gyr for [M/H], and either Gyr or 1.39 Gyr for [M/H] (Salaris & Girardi 2002, their Table 1). The ambiguity in the age solution is the reason for the near-coincidence of the red clump for the cluster and field stars, if the cluster and field are dominated by populations of 1 Gyr and Gyr, respectively.
3.3 Conclusion: progenitor mass of LI-LMC 1813
We conclude that LI-LMC 1813 probably has an age of Gyr (or slightly younger) and an initial metallicity of [M/H] (or slightly higher), and hence a progenitor mass of M⊙ (Bertelli et al. 1994).
4 Spectroscopic evidence for the carbon-rich nature of LI-LMC 1813
Dusty circumstellar envelopes may be separated into carbon-rich and oxygen-rich based on their location in IR colour-magnitude diagrams, but this diagnostic can be ambiguous (van Loon et al. 1998; Trams et al. 1999b): the colours of LI-LMC 1813, 4.3 mag, 8 mag, and 2 mag, are consistent with both carbon and oxygen-rich circumstellar material (Trams et al. 1999b, their Figs. 7 & 8). To determine the dominant chemistry of the stellar atmosphere, we thus resorted to taking near-IR spectra in the H, K and L-bands. These observations are described in full in Appendix A2.

The L-band spectrum of LI-LMC 1813 (Fig. 9) features strong absorption around 3.1 m from HCN and C2H2 molecules, a narrow absorption feature at 3.55 m due to HCN, and absorption around 3.8 m which is attributed to C2H2 (Matsuura et al. 2002). These molecules only form in great numbers after the supply of oxygen has been exhausted in the formation of CO. Hence the strong absorption due to carbonaceous molecules is only seen in the spectra of carbon stars, that have . The strength of the 3.55 and 3.8 m absorption bands is remarkable, especially as they are veiled by continuum emission from the circumstellar dust at wavelengths m (see Fig. 12). This hints at a contribution from molecules within the dust envelope surrounding the star, causing absorption seen against the thermal dust continuum emission.

The carbon-rich nature of LI-LMC 1813 is confirmed by the H and K-band spectra (Fig. 10), which clearly show the absorption bandhead of CO () at 2.293 m, and the Ballik-Ramsay bandhead of C2 () at 1.77 m. The strength of the latter requires a high ratio, possibly (Lançon & Wood 2000). A high ratio of has also been invoked by Matsuura et al. (2002) to explain the high abundance of C2H2 in the spectra of LMC carbon stars — including LI-LMC 1813. However, the molecular abundances not only depend on the free carbon abundance, but also on the local gas temperature (Matsuura et al., in preparation).

Although the equivalent width of the 3.1 m absorption in LI-LMC 1813 is very similar to that in other dust-enshrouded carbon stars in the LMC (Fig. 11 and Matsuura et al. 2002), the equivalent width of its 3.55 m absorption is the largest of that sample. It also has the reddest colour amongst these stars, which indicates a high mass-loss rate. These observations suggest either a highly advanced evolutionary state accompanied by a large ratio, or a very cool extended atmosphere leading to the abundant formation of molecules.
5 The mass-loss rate of LI-LMC 1813
5.1 Modelling the Spectral Energy Distribution

The SED was modelled with the radiative transfer code ”Dusty” (Ivezić, Nenkova & Elitzur 1999). The input parameter ”density type” was set to 3, which gives a density structure consistent with radiation-driven wind theory. The result of the best fit to the data is shown in Fig. 12.
A stellar temperature of K is used as such cool photosphere is typical for dust-enshrouded AGB stars (van Loon et al. 1998; Groenewegen & Blommaert 1998): carbon stars are produced with 2900 K, the superwind phase starts at 2700 K, and the coldest carbon stars known have 2200 K (Marigo 2002). Such range in temperatures corresponds to a range in derived luminosities of only 5%, and a range in mass-loss rates of 8%.
The temperature at the inner radius of the dust shell is assumed to be K as this is the typical temperature at which dust grains condense in a circumstellar environment. Since the data used to constrain the SED were taken at many epochs, it is quite possible that variations in the physical characteristics of the dust shell have occurred and therefore modelling with one set of properties will only provide an accurate fit for a portion of the SED. Stellar pulsations lead to variability in the luminosity, and therefore the dust temperature. A closer fit to the IRAS 25 and 60 m data is obtained by assuming K. This would also increase the stellar contribution in the L′-band, where photospheric spectral features are seen. Evidence of a higher dust temperature is provided by the much brighter L′-band photometric point. Averaged over the pulsational period, a value of K seems appropriate.
As LI-LMC 1813 is a carbon star (Section 4) we use amorphous carbon grains (Zubko et al. 1996) ranging in size from to 0.1 m according to a power-law distribution of the form with (Mathis, Rumpl & Nordsieck 1977). We assume the Dusty default for the dust grain specific mass density of g cm-3. The Dusty model assumes a gas-to-dust mass-ratio of . However, intermediate-age stars in the LMC may have a higher ratio, as their metallicity can be several times lower than solar. This only becomes important when calculating the mass-loss rate from the optical depth and luminosity. In particular, the radial density distribution throughout the radiatively-driven circumstellar outflow depends on the optical depth but not on the gas-to-dust ratio (Elitzur & Ivezić 2001).
The shell thickness depends on the outflow velocity and the length of time for which outflow has occured. The difference between the model results adopting and is slight and only noticeable at m. As there is no reason to assume that the dust shell is either extremely thick or thin, we use a relative thickness of . The inner radius of the dust shell around LI-LMC 1813 is found to be m, and thus the outer radius lies at m. The Dusty model for the best fit to the SED of LI-LMC 1813 predicts an outflow velocity of km s-1, and hence the duration of intense mass loss is estimated at yr. Although the data do not constrain this timescale better than by a lower limit of roughly yr, it does suggest that LI-LMC 1813 is undergoing a phase of prolonged intense mass loss (superwind).
Dusty produces the shape of the emergent spectrum, which is then scaled to match the observed flux. From the scaling factor we obtain the bolometric luminosity of L⊙ for LI-LMC 1813, or mag. This agrees extremely well both with the original estimate of mag (van Loon et al. 1997), and with the value of mag as predicted from the isochrone fit to KMHK 1603 (section 3.3).
The optical depth, , not only determines the shape of the SED, but also the mass-loss rate, , with . The optical depth at visual wavelengths is found to be , reflecting the highly obscured nature of LI-LMC 1813 (compare with van Loon et al. 1999b). The Dusty model returns a value for the mass-loss rate valid for L⊙ and , with depending on and as . At solar metallicity, dust-enshrouded objects have 100. However, the metallicity of LI-LMC 1813 is 3–5 times less than solar (Section 3). As the gas-to-dust ratio scales inversely proportional to the metallicity (van Loon 2000), we expect 300 to 500 in the dust shell of LI-LMC 1813. Hence we estimate the mass-loss rate of LI-LMC 1813 to be M⊙ yr-1.
5.2 Discussion: the superwind of the metal-poor carbon star LI-LMC 1813
LI-LMC 1813 is a carbon star. With its estimated progenitor mass of M⊙, dredge-up is indeed expected to have worked (Marigo 2001) in the absence of HBB (van Loon et al. 2001) to raise the photospheric abundance of carbon to above that of oxygen. The observed high ratio can be explained in terms of its low metallicity and relatively high mass as compared to carbon stars in the solar neighbourhood that have generally low-mass progenitors of M⊙ (see Marigo 2002, her Fig. 6). It also suggests that LI-LMC 1813 has been a carbon star for already quite some time.
LI-LMC 1813 is indeed a highly evolved AGB star. The isochrones that yield the mass estimate (based upon the colour-magnitude diagram of the cluster stars) for LI-LMC 1813 also indicate that its luminosity places it at the very tip of its evolution along the AGB. Its luminosity of L⊙ is a few times brighter than the peak in the optically bright carbon star luminosity function (Groenewegen 2002), but the same as the peak in the dust-enshrouded carbon star luminosity function (van Loon et al. 1999b). This is not unexpected, as the duration of the TP-AGB is longest for stars in the range 2 to 2.5 M⊙ (Marigo 2001).
It is therefore not surprising that LI-LMC 1813 is in the superwind phase, experiencing mass loss at a tremendous rate of M⊙ yr-1. Schröder, Winters & Sedlmayr (1999) show that low-mass carbon stars, with M⊙, expell thick shells during a brief period of enhanced luminosity as a result of a thermal pulse, but that more massive carbon stars such as LI-LMC 1813 suffer a longer period of a persistently high mass-loss rate. Our analysis of LI-LMC 1813 provides direct evidence for this superwind to occur at the tip of the AGB.
Vassiliadis & Wood (1993) model TP-AGB evolution including a prescription for the mass-loss rate based on empirical data for galactic Mira variables. They argue that the maximum mass-loss rate during the superwind phase is set by the transfer of momentum from the stellar radiation field onto the outflowing matter: , independent of the metallicity or chemical composition. Their prediction for the mass-loss rate of – M⊙ yr-1 during the superwind experienced by stars with –2.5 M⊙ is three times lower than the actual observed mass-loss rate of LI-LMC 1813. However, Gail & Sedlmayr (1986) have argued that multiple scattering can enhance the transfer of momentum and thus increase the maximum mass-loss rate, which was confirmed by observations of dust-enshrouded AGB stars in the LMC (van Loon et al. 1999b).
Wachter et al. (2002) derive a formula for the mass-loss rate of solar-metallicity carbon stars, based on dynamical models: . According to this formula, the mass-loss rate of LI-LMC 1813 is predicted to be M⊙ yr-1 for K. This agrees extremely well with the observed mass-loss rate of M⊙ yr-1. Considering that the metallicity of LI-LMC 1813 is three to five times lower than solar, the good agreement between the actual mass-loss rate of LI-LMC 1813 and the prediction for its mass-loss rate at solar metallicity suggests that the mass-loss rate — at least during the superwind phase — does not strongly depend on metallicity (see van Loon 2000).
In her new calculations for AGB evolution and the formation of carbon stars, Marigo (2002) includes the effects of molecule formation within the stellar atmosphere. One of the differences between these and previous models is that the drops once molecules are being formed, leading to high mass-loss rates of several M⊙ yr-1 at for carbon stars of M⊙. The observed insensitivity of to the initial metallicity may, in the case of carbon stars, be due to enhanced formation of carbonaceous molecules as a result of a higher ratio at lower metallicity. Alternatively, metallicity insensitivity of the pulsation mechanism has been suggested as a possible reason for the metallicity insensitivity of the mass-loss rate during the superwind phase (van Loon 2002).
When an AGB star arrives on the Mira period-luminosity (P-L) sequence, its mass-loss rate has become so severe that further evolution is along tracks of constant luminosity, with the radius (and hence pulsation period) growing as the structure of the mantle re-adjusts itself to the decrease in mass (e.g. Wood 1998). Describing the Mira as a polytrope, , and the pulsation as a harmonic oscillator, , the period evolves as (van Loon 2002).
If LI-LMC 1813 has evolved from 400 d on the Mira P-L ( M⊙) to 680 d at present, it has a current mass of only M⊙. According to Marigo (2001), its final mass will become M⊙. This means that, although it has already lost 0.9 M⊙, it must still lose another 0.7 M⊙. Stars of M⊙ with correspondingly long periods ( 1500 d) have not (yet) been found, the longest known period for such star being 900 d (Wood 1998). This is not surprising, as it would perhaps take as little as yr to lose the remainder of the stellar mantle, rendering these objects extremely rare.
6 Summary
As a result of a large observational effort, the mid-IR point source LI-LMC 1813 is now one of the few AGB stars experiencing the superwind phase of intense mass loss for which the progenitor mass, initial metallicity, atmospheric chemistry, luminosity and mass-loss rate are accurately known. It thus provides an important testcase against which to gauge models for the evolution and mass-loss of AGB stars.
Absorption features due to carbonaceous molecules in the near-IR spectra of LI-LMC 1813 indicate that it is a carbon star. From its location in the LMC cluster KMHK 1603, its progenitor mass is inferred to be M⊙, which is typical for a carbon star, whilst its initial metallicity is three to five times lower than solar.
The object is heavily obscured by its circumstellar dust, which shines brightly at IR wavelengths. From the modelling of the spectral energy distribution, a mass-loss rate of M⊙ yr-1 is estimated. This is very high, especially for such metal-poor star. As the luminosity of LI-LMC 1813 ( L⊙) places it at the very tip of its AGB, this observation provides direct evidence for the superwind to represent the final episode in the AGB evolution.
Although the observed mass-loss rate for LI-LMC 1813 is a few times higher than that predicted by the formalism in Vassiliadis & Wood (1993), it is in very good agreement with the prescription based on the dynamical models of Wachter et al. (2002) for solar metallicity. This suggests that the mass-loss rate in the superwind phase may be metallicity insensitive (van Loon 2000, 2002), perhaps because of a larger abundance of carbonaceous molecules other than carbon-monoxide in metal-poor stellar atmospheres (Matsuura et al. 2002; Marigo 2002).
Acknowledgments
We are grateful to the former Director of ESO for the generous allocation of Director’s Discretionary Time on the 0.9m Dutch telescope from Christmas to New Year’s Eve 1996, to Maria Messineo for taking the H+K-band spectra of LI-LMC 1813 at CTIO (and commenting on an earlier version of this manuscript), and to Dr. George Hau and the ESO 3.6m team for taking the optical spectrum of KMHK 1603-1 during an EFOSC-2 set-up night. We also would like to thank Dr. René Mendez (ESO) for digging up the ancient IRAC-2 filter transmission curves. This publication makes use of data products from the Two Micron All Sky Survey, which is a joint project of the University of Massachusetts and the Infrared Processing and Analysis Center/California Institute of Technology, funded by the National Aeronautics and Space Administration and the National Science Foundation. This research also made use of data products from the Midcourse Space Experiment. Processing of the data was funded by the Ballistic Missile Defense Organization with additional support from NASA Office of Space Science. This research has also made use of the NASA/IPAC Infrared Science Archive, which is operated by the Jet Propulsion Laboratory, California Institute of Technology, under contract with the National Aeronautics and Space Administration. Jacco thanks, above all, Joana… for everything.
Appendix A Observations
A.1 Photometry
A.1.1 Optical imaging (Dutch 0.9m, La Silla)
The direct imaging camera at the Dutch 0.9m telescope at La Silla, Chile, was used on the six nights of December 25 to 30, 1996, to obtain deep images of a region around the cluster KMHK 1603, through Gunn g ( Å, Å), r ( Å, Å) and i ( Å, Å) filters (Thuan & Gunn 1976; Wade et al. 1979). The total integration time amounts to 4 hours per filter, split into 5-minute exposures to avoid saturation and to allow for refocussing in order to reach the best image quality. The pixels measure on the sky, and stellar images on the combined (shift-added) frames have a Full Width at Half Maximum (FWHM) of , though some individual frames show stellar images of FWHM. The CCD frames were reduced using standard procedures within the ESO-MIDAS package. The reader is referred to van Loon et al. (2001) for more details.
A.1.2 J and K-band imaging (IRAC-2, La Silla)
The near-IR camera IRAC-2b at the ESO/MPI 2.2m telescope at La Silla, Chile, was used on January 2, 1996, to image the field around the IRAS point source LI-LMC 1813. Lens C was chosen to cover a field of view of , with a pixel scale of . A sequence of 12 images in the K-band filter were obtained, each consisting of ten 3-second exposures, shifted by in Right Ascension (RA) with respect to the previous image. This procedure was then repeated backwards, using the J-band filter. The image is deepest in the central . The photometry is transformed onto the SAAO system (Carter 1990). The reader is referred to van Loon et al. (1997) for more details.
A.1.3 Near-IR imaging (2MASS & DENIS)
Archival J, H and K-band data is available from the second incremental data release of 2MASS. It contains 8 stars within of LI-LMC 1813 which were detected in the K band down to 15 mag, including LI-LMC 1813 itself, on 26 October 1998. Especially valuable is the detection of LI-LMC 1813 in the H band, which is thereby the shortest wavelength at which the object has been seen. The Denis point source catalogue towards the Magellanic Clouds (Cioni et al. 2000) provides additional I, J and Ks-band data, but its sensitivity only reaches 12 mag and no star was detected within of LI-LMC 1813 except for the optically brightest star in the cluster, KMHK 1603-1, which was detected in the I and J-bands. The photometry from both 2MASS and Denis is transformed onto the SAAO system (Carter 1990; Carpenter 2001) before further analysis.
A.1.4 L′-band imaging (ISAAC, Paranal)
The Infrared Spectrometer And Array Camera (ISAAC) at the ESO VLT at Paranal, Chile, was used on October 19, 2000, to image LI-LMC 1813 through an L′-band filter ( m, m). Because of the high background, the image was obtained after chopping and nodding (both by in Declination), with 9 sub-integrations of 0.104 second at each chop position, and a total on-source integration time of 1 minute. The field-of-view of (at pixel-1) ensured that KMHK 1603-1 was imaged simultaneously with LI-LMC 1813. Conditions were very good, with 6% relative humidity at a temperature of C. The seeing was at Zenith, with the target at an airmass of 1.442.
The data were reduced using ESO-MIDAS and the Eclipse package (Devillard 1997). First the electrical ghosts were removed (is_ghost in Eclipse). Then the relative pixel responses were calibrated using a flatfield image, and aperture photometry was performed on the difference of the two images at each nodding position. The photometry was calibrated against that of the G3-giant standard star HR 2354 ( mag; van der Bliek, Manfroid & Bouchet 1996: virtually identical filter as that of ISAAC) at similar airmass (1.392) and only 10 minutes after LI-LMC 1813.
A.1.5 Mid-IR imaging (MSX)
LI-LMC 1813 is included in the Mid-course Space eXperiment (MSX) Point Source Catalogue (Price et al. 2001). It was only detected in band A (effective wavelength m). The transmission of this band runs from 6.1 to 10.8 m, though, peaking at 9.9 m, and the measured flux density thus depends heavily on the spectral slope of the object — which is greatly affected by circumstellar emission.
A.1.6 N-band imaging (TIMMI-2, La Silla)
The TIMMI-2 instrument at the ESO 3.6m telescope at La Silla, Chile, was used on January 19, 2001, to obtain an image of LI-LMC 1813 through the N2 filter ( m, with a transmission % between and 11.33 m). At a pixel scale of pixel-1, the slightly vignetted field measures (RA) (Dec). The standard technique for observing in the thermal IR was employed, chopping in Dec and nodding in RA. The total on-source integration time was 15 minutes. The images were combined, and the photometry was obtained, using standard commands within ESO-MIDAS. The K3 giant Hya was used as a prime calibrator, adopting a flux density of Jy (Cohen 1998). The photometry was checked against the IRAS 12 m flux densities for the K2 and K1 giants Tuc ( Jy) and Pic ( Jy).
A.1.7 Mid-IR photometry (IRAS)
Data at 12, 25 and 60 m were retrieved from the IRAS data base server in Groningen111The IRAS data base server of the Space Research Organisation of the Netherlands (SRON) and the Dutch Expertise Centre for Astronomical Data Processing is funded by the Netherlands Organisation for Scientific Research (NWO). The IRAS data base server project was also partly funded through the Air Force Office of Scientific Research, grants AFOSR 86-0140 and AFOSR 89-0320. (Assendorp et al. 1995). The Gipsy data analysis software was used to measure the flux density from a trace through the position of the star (Gipsy command scanaid). For a discussion about the sensitivity and reliability of this procedure for point sources in the LMC, see van Loon et al. (1999b).
A.2 Spectroscopy
A.2.1 Optical spectroscopy (EFOSC-2, La Silla)
The EFOSC-2 instrument at the ESO 3.6m telescope at La Silla, Chile, was used on October 31, 2002, to obtain an optical spectrum of KMHK 1603-1 between and 6700 Å with grism #9. The slit was narrowed to a width of only projected on the sky, in order to boost the spectral resolving power to 2000. Two spectra were taken, with exposure times of 300 seconds each, which were then combined. The bias level was subtracted first. Differences in illumination and responsivity across the image were corrected using flatfield spectra of an internal quartz lamp. The wavelength axis was calibrated using two exposures of a He/Ar lamp, with an accuracy to well within the spectral resolution. The sky-subtracted spectra were corrected for extinction by the Earth’s atmosphere, and for the response function as derived from a spectrum of the HST standard star HD 49798.
A.2.2 H and K-band spectroscopy (OSIRIS, CTIO)
The Ohio State InfraRed Imager/Spectrometer (OSIRIS) at the 4m Blanco telescope at Cerro Tololo (CTIO), Chile, was used on 6 July, 2002, to obtain a spectrum of LI-LMC 1813 covering the 0.9 to 2.4 m wavelength range. The instrument was used first in imaging mode to acquire the star in the slit. The spectra were acquired in cross-dispersed mode through a slit, providing a resolving power of . Four spectra were taken, with each time the star moved over along the slit. The slit orientation was East–West.
The data reduction was performed using Iraf. In the individual spectra bad pixels were eliminated and flatfield and linearisation corrections were applied. Since the spectra were taken in the morning almost at sunrise, the sky brightness changed considerably during the course of the observations. From each image another image (the nearest in time) was subtracted to perform a first sky subtraction. The individual spectra were then extracted and combined. Stars of spectral type A and B were observed as close to the LI-LMC 1813 spectrum’s airmass (1.756) as possible, in order to correct for telluric absorption features and the instrumental response. The raw spectra of these reference stars were obtained in the same manner as LI-LMC 1813. The hydrogen and helium series appearing in these spectra were removed by linear interpolation. The cleaned spectra of the early-type stars were divided by a blackbody curve to eliminate the slope due to their intrinsic energy distributions (see Messineo et al., in preparation, for more details). Temperatures were adopted from Gray (1992) and Vacca, Garmany & Schull (1996). The wavelength calibration was obtained using the telluric OH lines (Iraf tasks refspectra and dispcor; see Oliva & Origlia 1992). The spectra were dereddened (Iraf task deredden) using the extinction law of Cardelli, Clayton & Mathis (1989) — essentially the same as that of Mathis (1990).
A.2.3 L-band spectroscopy (ISAAC, Paranal)
ISAAC at the ESO VLT at Paranal, Chile, was used on December 14, 2001, to take an L-band spectrum of LI-LMC 1813. The total on-source exposure time was 36 minutes. With a slit width of , the resolving power was 600. The optical seeing was , but the infrared seeing was . The background was subtracted by chopping with a chopping throw of . Telescope nodding and jitter was used to correct for bad pixels. The data was reduced using the Eclipse package (Devillard 1997). Variations of the pixel response across the array were corrected with a flatfield of the twilight sky. The wavelength calibration is based on the exposure by an Ar+Xe arc lamp with the same wavelength setting as the target observation.
The weather was photometric. The B9 IV star HIP 029729 was used as a telluric standard and flux calibration star. For the flux calibration we use the effective temperature, , and colour for a spectral type B9 V instead of B9 IV, because no accurate value for is available for sub-giants. The spectrum is represented by a black body with K (Tokunaga 2000). The K-band magnitude of this star is mag (van der Bliek et al. 1996) and mag for a B9 V star, hence the L-band magnitude is estimated to be mag. The L-band magnitude is converted into Jansky according to the zero-magnitude in van der Bliek et al. (1996).
Appendix B The optically bright star KMHK 1603-1
The optical and infrared colours and magnitudes of the bright star KMHK 1603-1 are consistent with those of an F-type supergiant in the LMC. It could then either be a field supergiant of relatively young age ( yr), or a post-AGB star in the cluster KMHK 1603. The latter case would be especially interesting, as we could then compare the properties of an AGB and a post-AGB star of the same main-sequence mass and metallicity. However, it could also be a galactic foreground main-sequence star.

Modelling of the photometry (Fig. B1) suggested a temperature of (roughly) 6500–7000 K. If at the distance of the LMC, it will then have a bolometric luminosity of L⊙, i.e. virtually identical to that of LI-LMC 1813. As the luminosity of a post-AGB star (before reaching the White Dwarf cooling track) is the same as it had when it left the AGB, this lended further support for the hypothesis that KMHK 1603-1 is a post-AGB star in the KMHK 1603 cluster. Therefore, an optical spectrum was taken in order to confirm or reject this.

The H and H photospheric absorption lines in the spectrum of KMHK 1603-1 peak within 30 km s-1 from the heliocentric rest velocity (Fig. B2), ruling out LMC membership. On the basis of the relative strengths of the H and H lines, Mg i triplet (Pritchet & van den Bergh 1977), Na i D doublet and the and Fe i lines, and by comparison with the spectral library of Jacoby, Hunter & Christian (1984), the spectral type is estimated to be F6 V ( K). This suggests a bolometric luminosity of only 15 L⊙, and hence a difference in the distance modulus of 10 mag, which corresponds to a distance of 500 pc, or a distance above the galactic plane of 250 pc. From a comparison of the acquisition image of October 2002 with the imaging in December 1995, no proper motion could be detected in excess of yr-1, but the proper motion for a star at pc and galactic longitude of is also not expected to exceed this upper limit.
References
- [2001] Alard C., et al., 2001, ApJ 552, 289
- [1997] Arndt T.U., Fleischer A.J., Sedlmayr E., 1997, A&A 327, 614
- [1995] Assendorp R., Bontekoe T.R., de Jonge A.R.W., Kester D.J.M., Roelfsema P.R., Wesselius P.R., 1995, A&AS 110, 395
- [1994] Bertelli G., Bressan A., Chiosi C., Fagotto F., Nasi E., 1994, A&AS 106, 275
- [1991] Bowen G.H., Willson L.A., 1991, ApJ 375, L53
- [1989] Cardelli J.A., Clayton G.C., Mathis J.S., 1989, ApJ 345, 245
- [2001] Carpenter J.M., 2001, AJ 121, 2851
- [1990] Carter B.S., 1990, MNRAS 242, 1
- [2000] Cioni M.-R.L., et al., 2000, A&AS 144, 235
- [1998] Cohen M., 1998, AJ 115, 2092
- [1997] Devillard N., 1997, ESO Msngr 87, 19
- [2001] Elitzur M., Ivezić Ž, 2001, MNRAS 327, 403
- [1990] Frogel J.A., Mould J., Blanco V.M., 1990, ApJ 352, 96
- [1998] Frost C.A., Cannon R.C., Lattanzio J.C., Wood P.R., Forestini M., 1998, A&A 332, L17
- [1996] Gail H.-P., Sedlmayr E., 1986, A&A 161, 201
- [2001] Girardi L., Salaris M., 2001, MNRAS 323, 109
- [1992] Gray D.F., 1992, “The observation and analysis of stellar photospheres”, ed., Cambridge Astrophysics Series, CUP
- [2000] Groenewegen M.A.T., 2000, A&A 363, 901
- [2002] Groenewegen M.A.T., 2002, in: “The Chemical Evolution of Dwarf Galaxies”, Ringberg Castle Workshop (astro-ph/0208449)
- [1998] Groenewegen M.A.T., Blommaert J.A.D.L., 1998, A&A 332, 25
- [1993] Groenewegen M.A.T., de Jong T., 1993, A&A 267, 410
- [1983] Iben I., Renzini A., 1983, ARA&A 21, 271
- [1999] Ivezić Ž, Nenkova M., Elitzur M., 1999, User manual for Dusty
- [1984] Jacoby G.H., Hunter D.A., Christian C.A., 1984, ApJS 56, 257
- [1990] Kontizas M., Morgan D.H., Hatzidimitriou D., Kontizas E., 1990, A&AS 84, 527
- [2000] Lançon A., Wood P.R., 2000, A&AS 146, 217
- [1997] Loup C., Zijlstra A.A., Waters L.B.F.M., Groenewegen M.A.T., 1997, A&AS 125, 419
- [2001] Marigo P., 2001, A&A 370, 194
- [2002] Marigo P., 2002, A&A 387, 507
- [1996] Marigo P., Girardi L., Chiosi C., 1996, A&A 316, L1
- [1999] Marigo P., Girardi L., Bressan A., 1999, A&A 344, 123
- [1990] Mathis J.S., 1990, ARA&A 28, 37
- [1977] Mathis J.S., Rumpl W., Nordsieck K.H., 1977, ApJ 217, 425
- [2002] Matsuura M., Zijlstra A.A., van Loon J.Th., Yamamura I., Markwick A.J., Woods P.M., Waters L.B.F.M., 2002, ApJ 580, L133
- [1992] Oliva E., Origlia L., 1992, A&A 254, 466
- [2001] Price S.D., Egan M.P., Carey S.J., Mizuno D.R., Kuchar T.A., 2001, AJ 121, 2819
- [1977] Pritchet C., van den Bergh S., 1977, ApJS 34, 101
- [2002] Salaris M., Girardi L., 2002, MNRAS 337, 332
- [1998] Schlegel D.J., Finkbeiner D.P., Davis M., 1998, ApJ 500, 525
- [1999] Schröder K.-P., Winters J.M., Sedlmayr E., 1999, A&A 349, 898
- [2002] Smecker-Hane T.A., Cole A.A., Gallagher III J.S., Stetson P.B., 2002, ApJ 566, 239
- [2002] Smith V.V., et al., 2002, AJ 124, 3241
- [1987] Stetson P.B., 1987, PASP 99, 191
- [1997] Tanabé T., et al., 1997, Nature 385, 509
- [1976] Thuan T.X., Gunn J.E., 1976, PASP 88, 543
- [2000] Tokunaga A., 2000, in: Allen’s Astrophysical Quantities, ed. N. Cox, Springer
- [1999a] Trams N.R., et al., 1999a, A&A 344, L17
- [1999b] Trams N.R., A&A 346, 843
- [1996] Vacca W.D., Garmany C.D., Shull J.M., 1996, ApJ 460, 914
- [1996] van der Bliek N.S., Manfroid J., Bouchet P., 1996, A&AS 119, 547
- [2001] van der Marel R.P., Cioni M.-R.L., 2001, AJ 122, 1807
- [1999] van Loon J.Th., 1999, in: “Asymptotic Giant Branch stars”, IAU Symposium #191, eds. T. Le Bertre, A. Lèbre & C. Waelkens. ASP, p567
- [2000] van Loon J.Th., 2000, A&A 354, 125
- [2002] van Loon J.Th., 2002, in: “Radial and Nonradial Pulsations as Probes of Stellar Physics”, eds. C. Aerts, T. Bedding & J. Christensen-Dalsgaard. ASP Conf.Ser. 259, p548
- [1997] van Loon J.Th., Zijlstra A.A., Whitelock P.A., Waters L.B.F.M., Loup C., Trams N.R., 1997, A&A 325, 585
- [1998] van Loon J.Th., et al., 1998, A&A 329, 169
- [1999a] van Loon J.Th., Zijlstra A.A., Groenewegen M.A.T., 1999a, A&A 346, 805
- [1999b] van Loon J.Th., Groenewegen M.A.T., de Koter A., Trams N.R., Waters L.B.F.M., Zijlstra A.A., Whitelock P.A., Loup C., 1999b, A&A 351, 559
- [2001] van Loon J.Th., Zijlstra A.A., Kaper L., Gilmore G.F., Loup C., Blommaert J.A.D.L., 2001, A&A 368, 239
- [2003] van Loon J.Th., et al., 2003, MNRAS 338, 857
- [1993] Vassiliadis E., Wood P.R., 1993, ApJ 413, 641
- [2002] Wachter A., Schröder K.-P., Winters J.M., Arndt T.U., Sedlmayr E., 2002, A&A 384, 452
- [1979] Wade R.A., Hoessel J.G., Elias J.H., Huchra J.P., 1979, PASP 91, 35
- [2003] Whitelock P.A., Feast M.W., van Loon, J.Th., Zijlstra A.A., 2003, submitted to MNRAS
- [1998] Wood P.R., 1998, A&A 338, 592
- [1996] Zijlstra A.A., Loup C., Waters L.B.F.M., Whitelock P.A., van Loon J.Th., Guglielmo F., 1996, MNRAS 279, 32
- [1996] Zubko V.G., Mennella V., Colangeli L., Bussoletti E., 1996, MNRAS 282, 1321